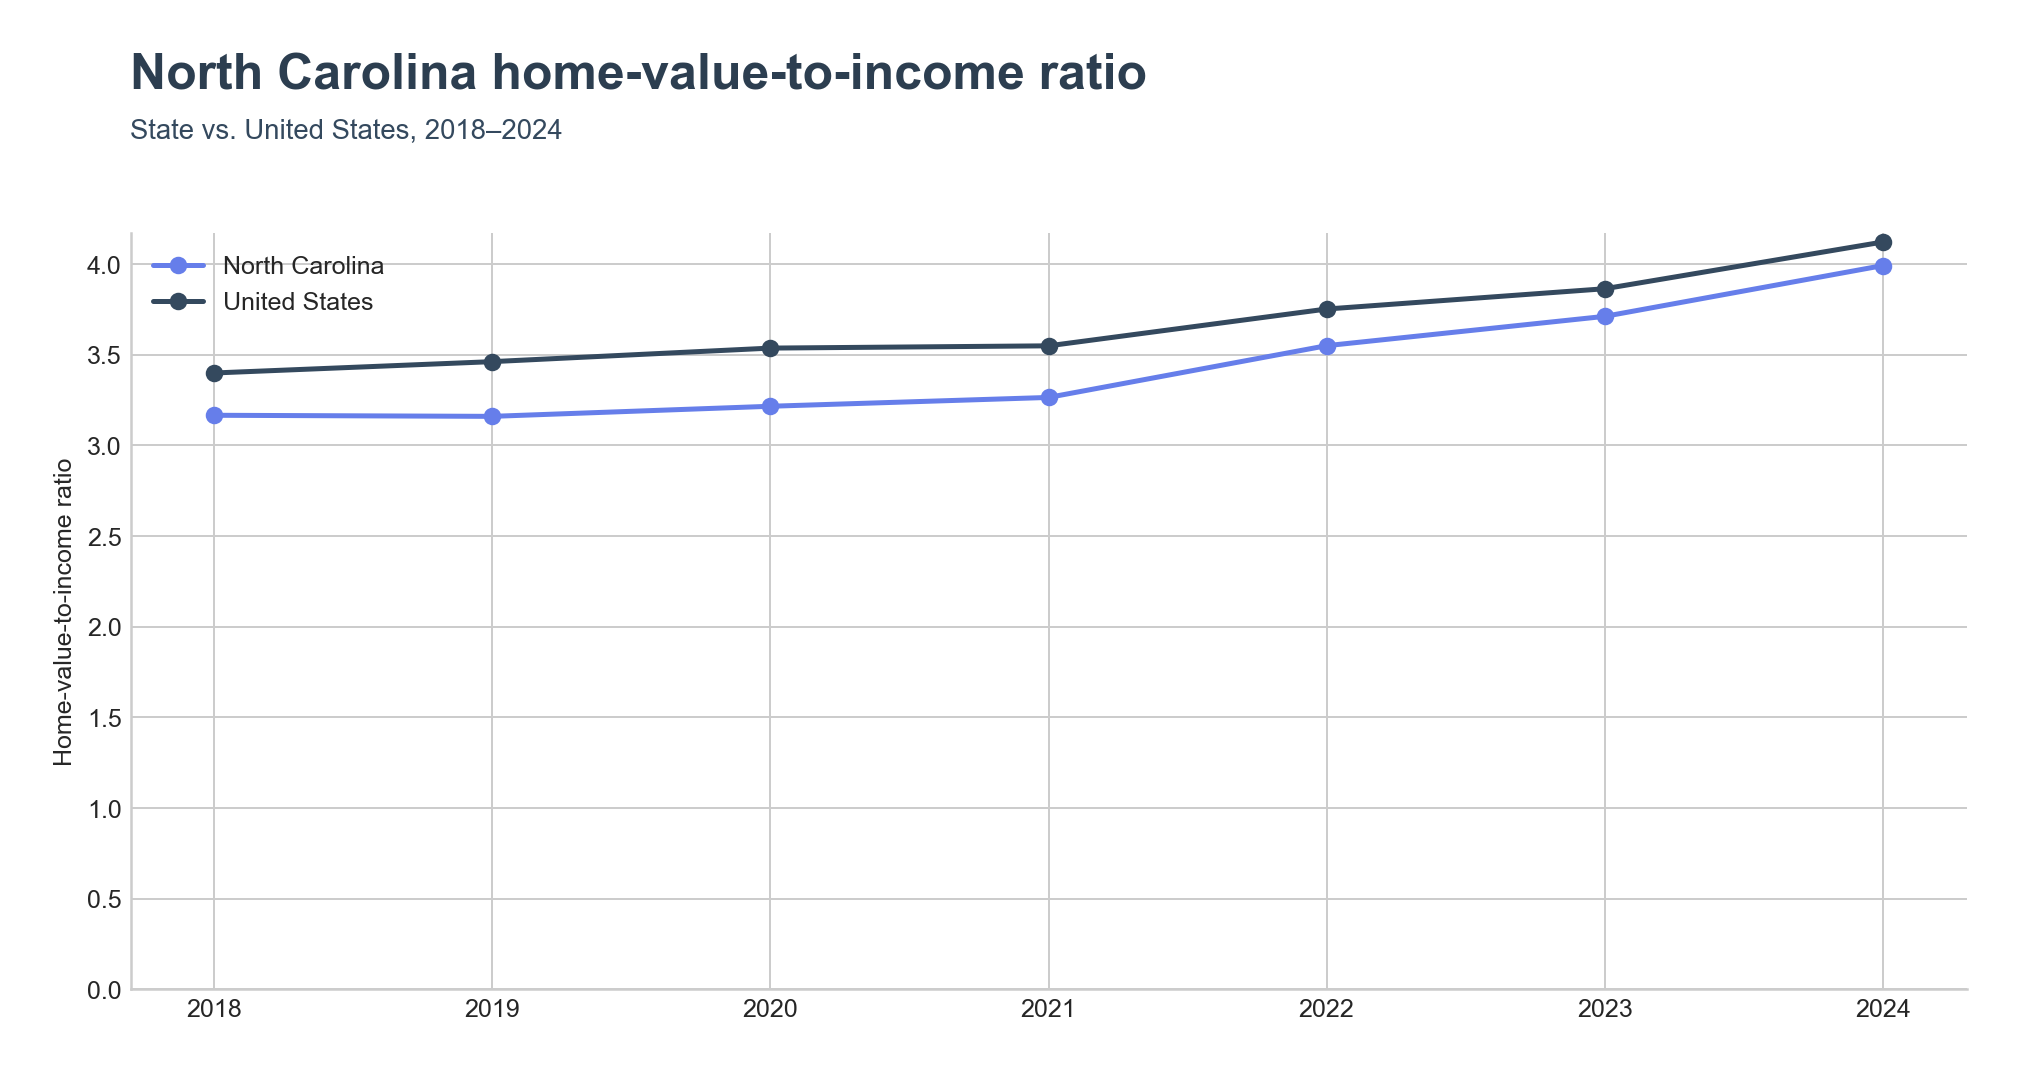
North Carolina's home-value-to-income ratio reached 3.99x in 2024, still below the US reference of 4.12x but climbing on the same trajectory. The state's ratio rose from 3.17x in 2018 — a six-year shift driven by median home value jumping from $165,900 to $288,900 while median household income moved from $52,413 to only $72,388.
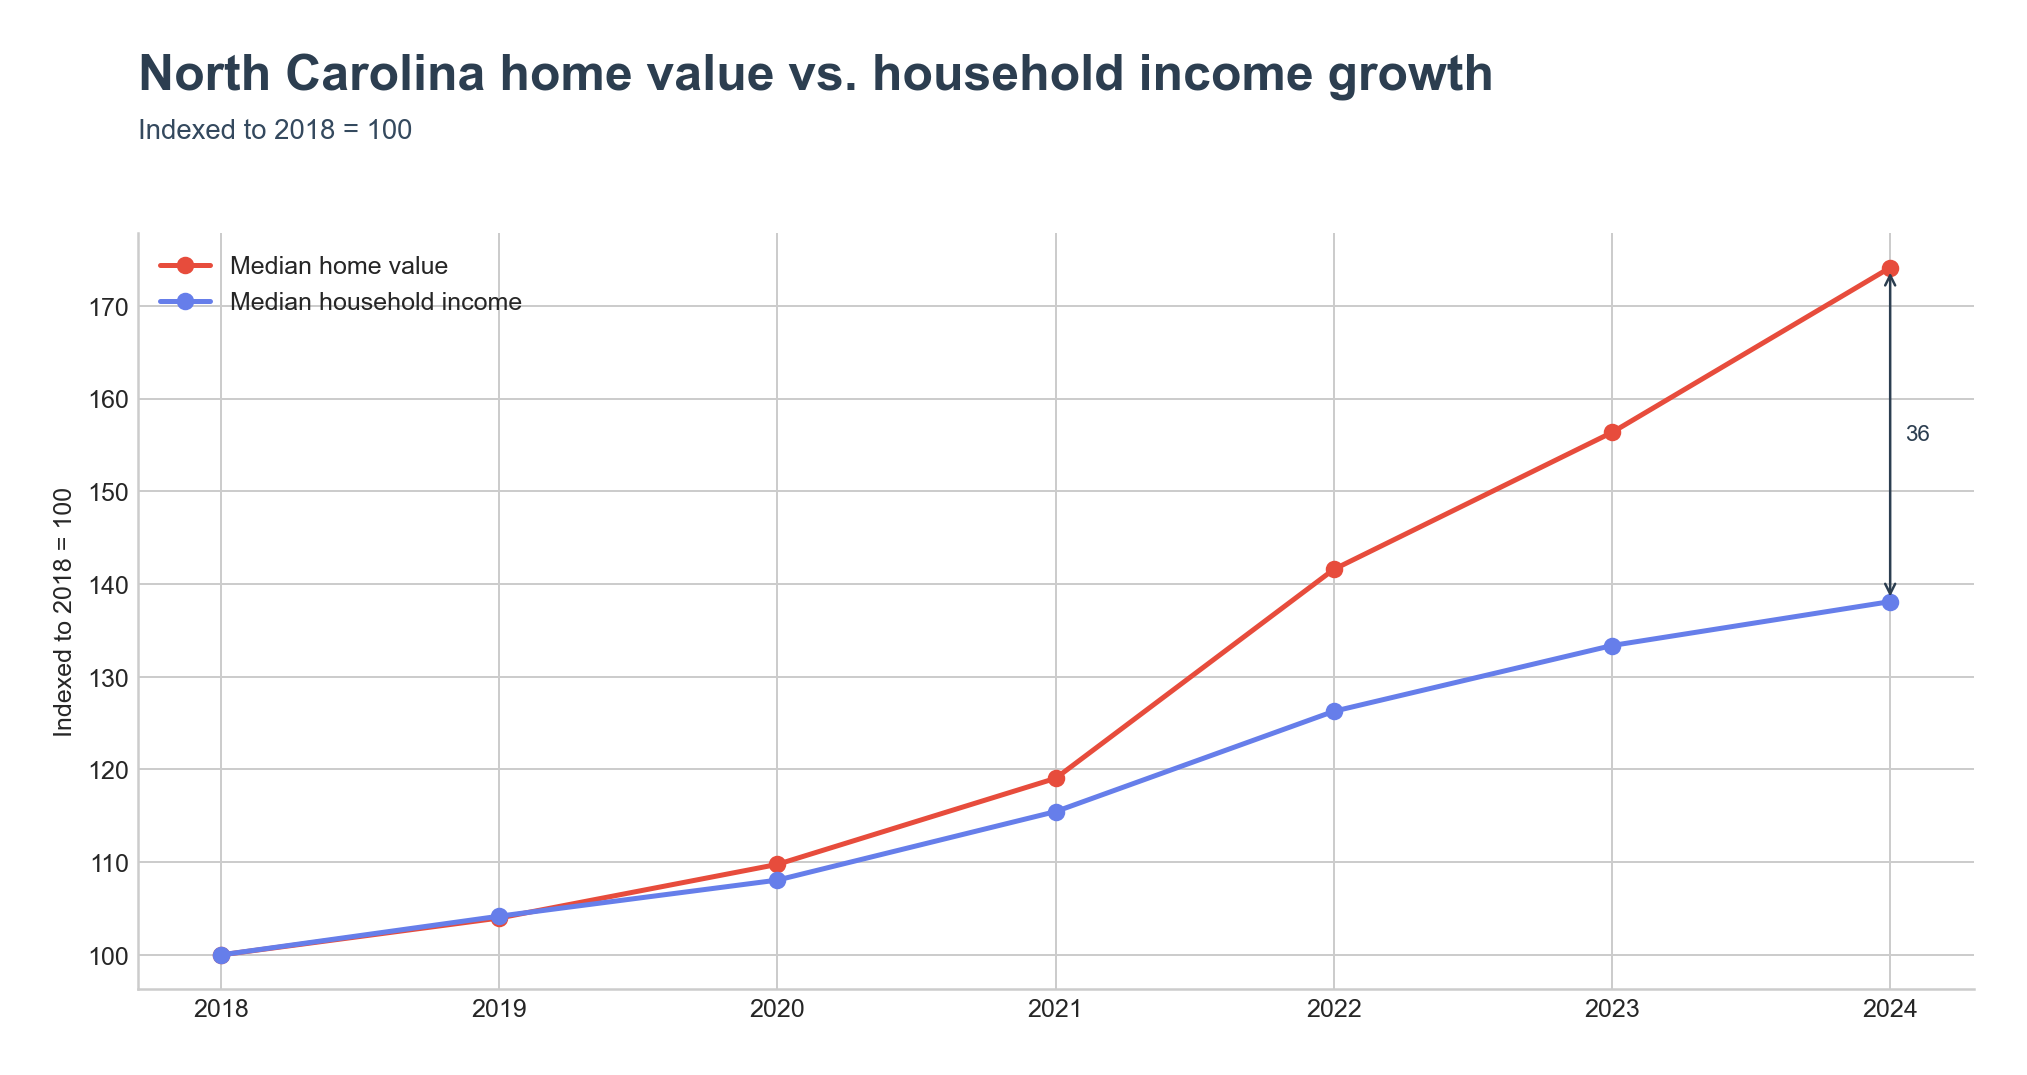
Indexed to 2018, North Carolina home values reached 174 by 2024 while household income reached 138 — a 36-point spread that opened sharply after 2020.
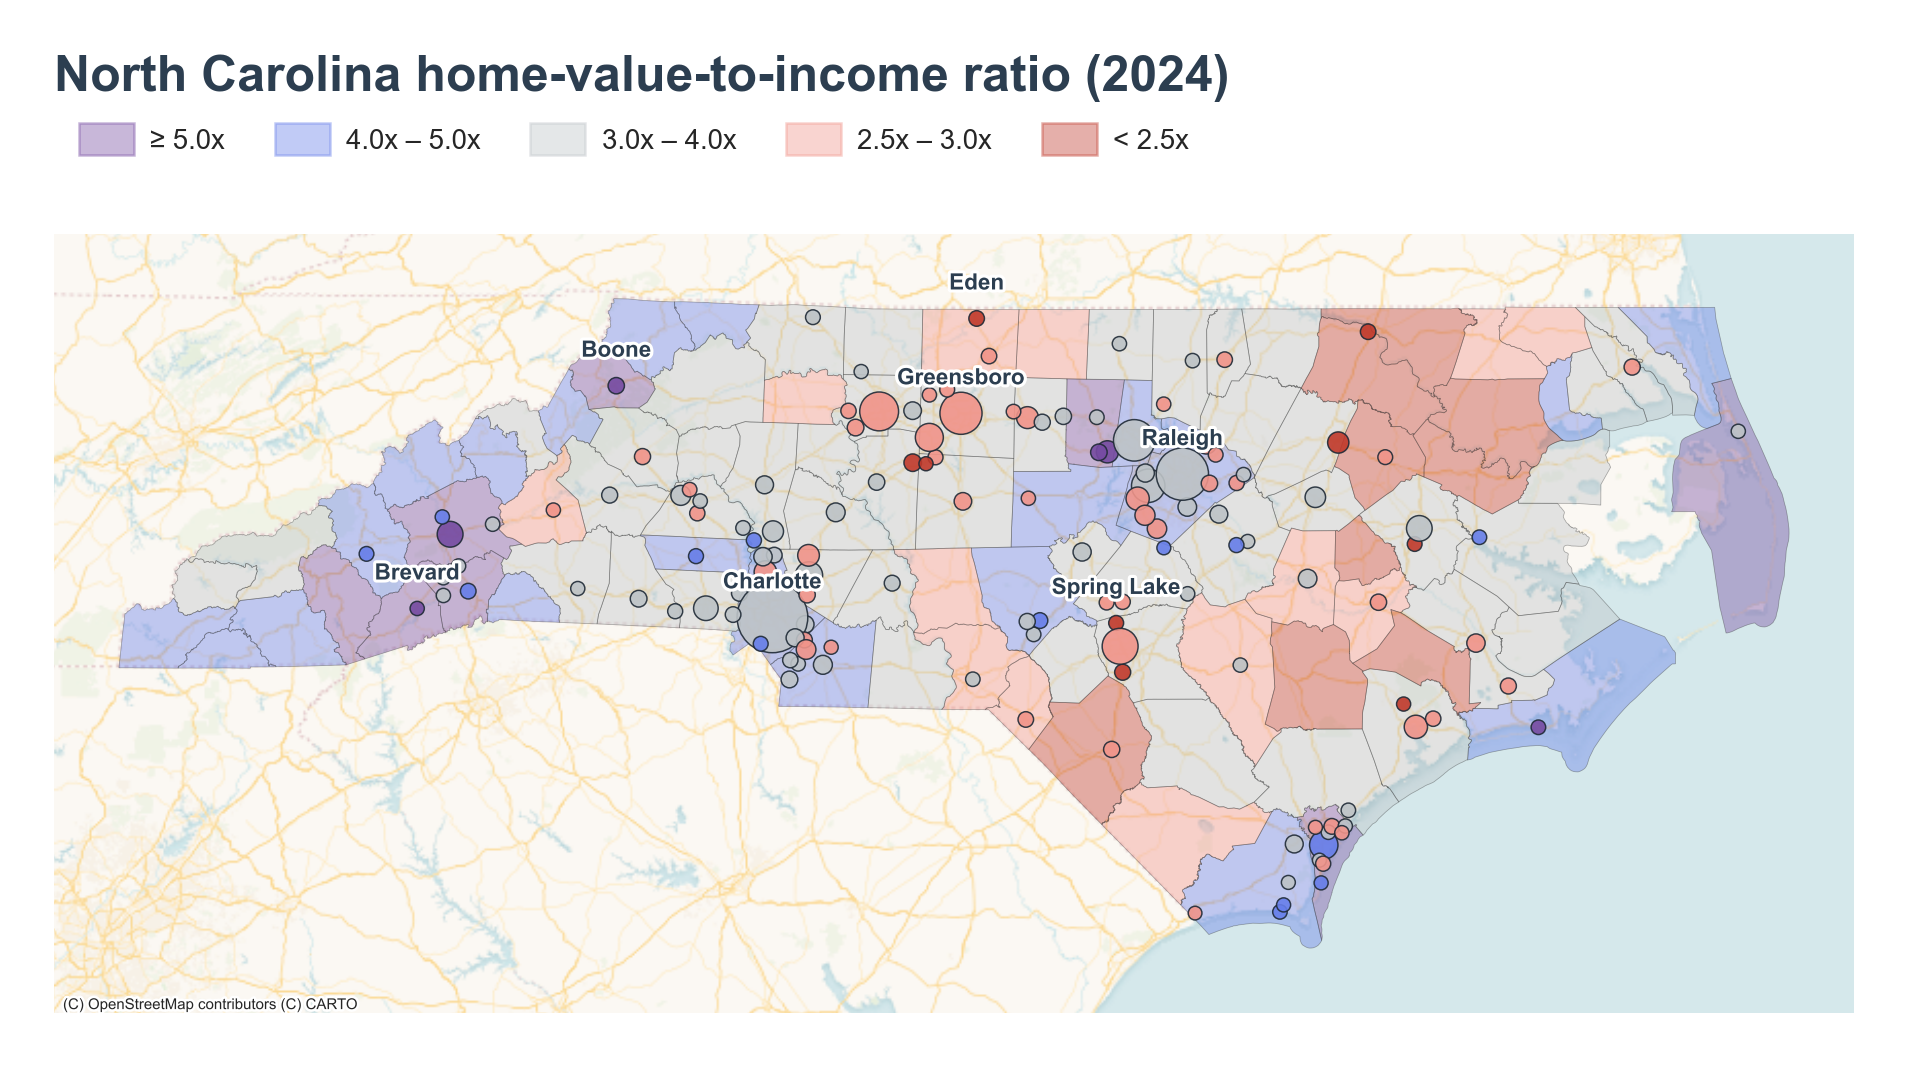
Where the ratio runs hottest
Boone leads the state at 13.67x ($411,100 against $30,065), a Blue Ridge mountain town where the Appalachian State University student population depresses the income denominator against second-home and resort-driven home values. Brevard follows at 8.32x ($450,000 / $54,103), another western mountain town in Transylvania County . Chapel Hill — home to the University of North Carolina — reaches 7.14x on a $613,700 median home, the highest absolute home value in the top five. Morehead City on the central coast posts 6.36x, and adjacent Carrboro sits at 6.29x.
At the county level the pattern is concentrated in two places: the western mountains and the coast. Watauga County (containing Boone) leads at 6.94x, followed by Transylvania at 5.64x and Buncombe County — home to Asheville — at 5.26x. Dare County on the Outer Banks reaches 5.17x on a $460,400 median home, and New Hanover County , anchored by Wilmington , follows at 5.16x.
Where it runs coldest
The lowest-ratio places sit near large military installations and in the old textile and tobacco belts. Spring Lake bottoms the state at 2.39x ($124,000 / $51,958), adjacent to Fort Liberty . Eden , a former textile-mill town in Rockingham County , posts 2.55x on a $120,700 median home. Trinity sits at 2.62x, Half Moon — near Marine Corps Base Camp Lejeune — at 2.65x, and Roanoke Rapids at 2.66x.
At the county level the bottom is even lower and clusters in the rural east. Bertie County anchors the state at 2.02x ($98,500 / $48,750). Jones follows at 2.18x, Greene at 2.20x, Robeson at 2.25x, and Martin at 2.26x. These counties share low home values, not high incomes.
The distribution shift
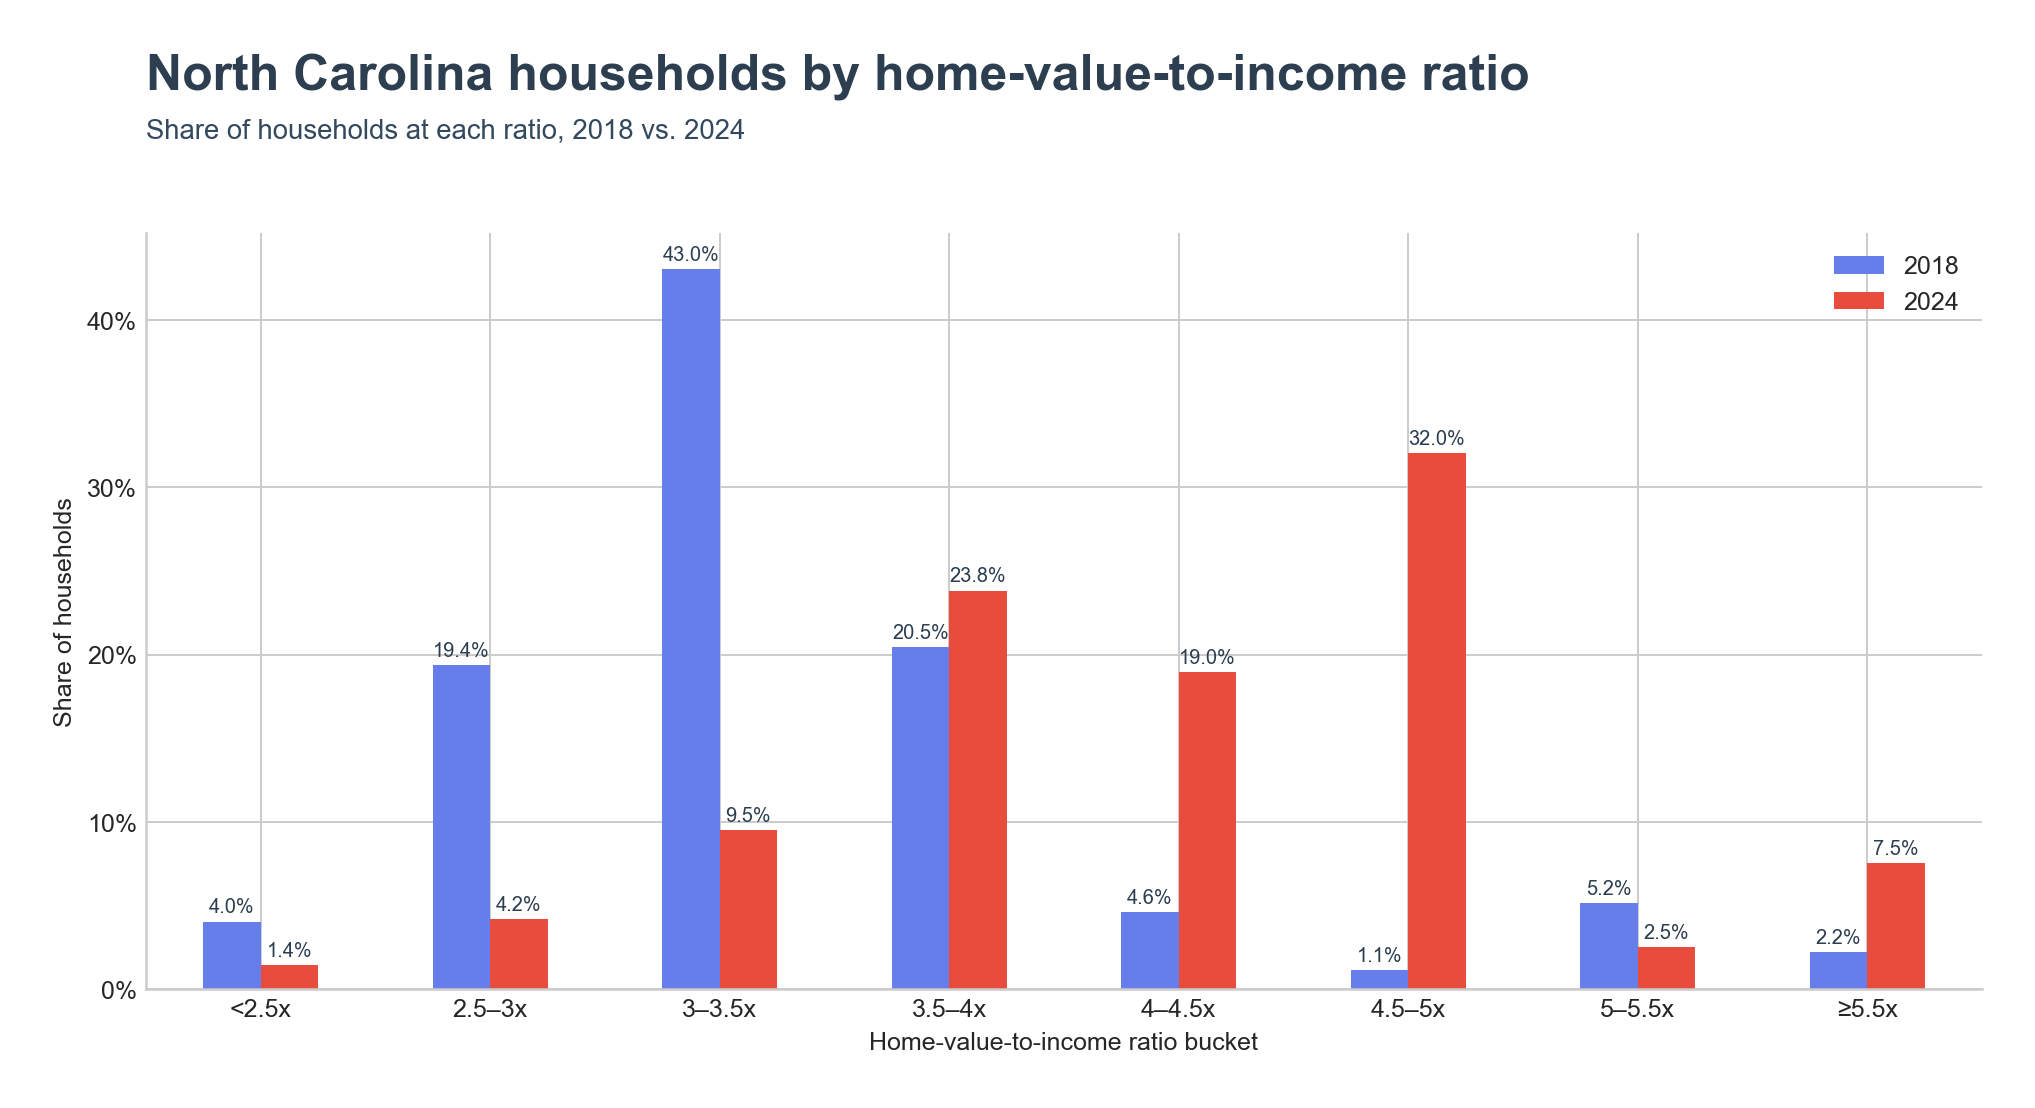
The share of North Carolina households living in places at the 3–3.5x ratio fell from 43.0% in 2018 to 9.5% in 2024 — the single largest movement on the chart. The mass moved up: the 3.5–4x band edged from 20.5% to 23.8%, the 4–4.5x band grew from 4.6% to 19.0%, and the 4.5–5x band — barely a sliver at 1.1% in 2018 — now holds 32.0% of households. The ≥5.5x bucket more than tripled from 2.2% to 7.5%, while the <2.5x bucket shrank from 4.0% to 1.4%.
Key Takeaways
- North Carolina's home-value-to-income ratio rose from 3.17x in 2018 to 3.99x in 2024, against the US figure of 4.12x.
- Home values grew 74% since 2018 while household income grew 38%, opening a 36-point indexed gap.
- Boone tops the state at 13.67x — driven by an Appalachian State University student population against mountain-town housing.
- The Blue Ridge mountains (Watauga, Transylvania, Buncombe) and the coast (Dare, New Hanover) account for every county above 5x.
- The bottom of the distribution is rural and eastern: Bertie County at 2.02x anchors the state, and military-adjacent places like Spring Lake and Half Moon hold the lowest place-level ratios.
- The 4.5–5x bucket grew from 1.1% of households in 2018 to 32.0% in 2024, now the single largest band in the state.