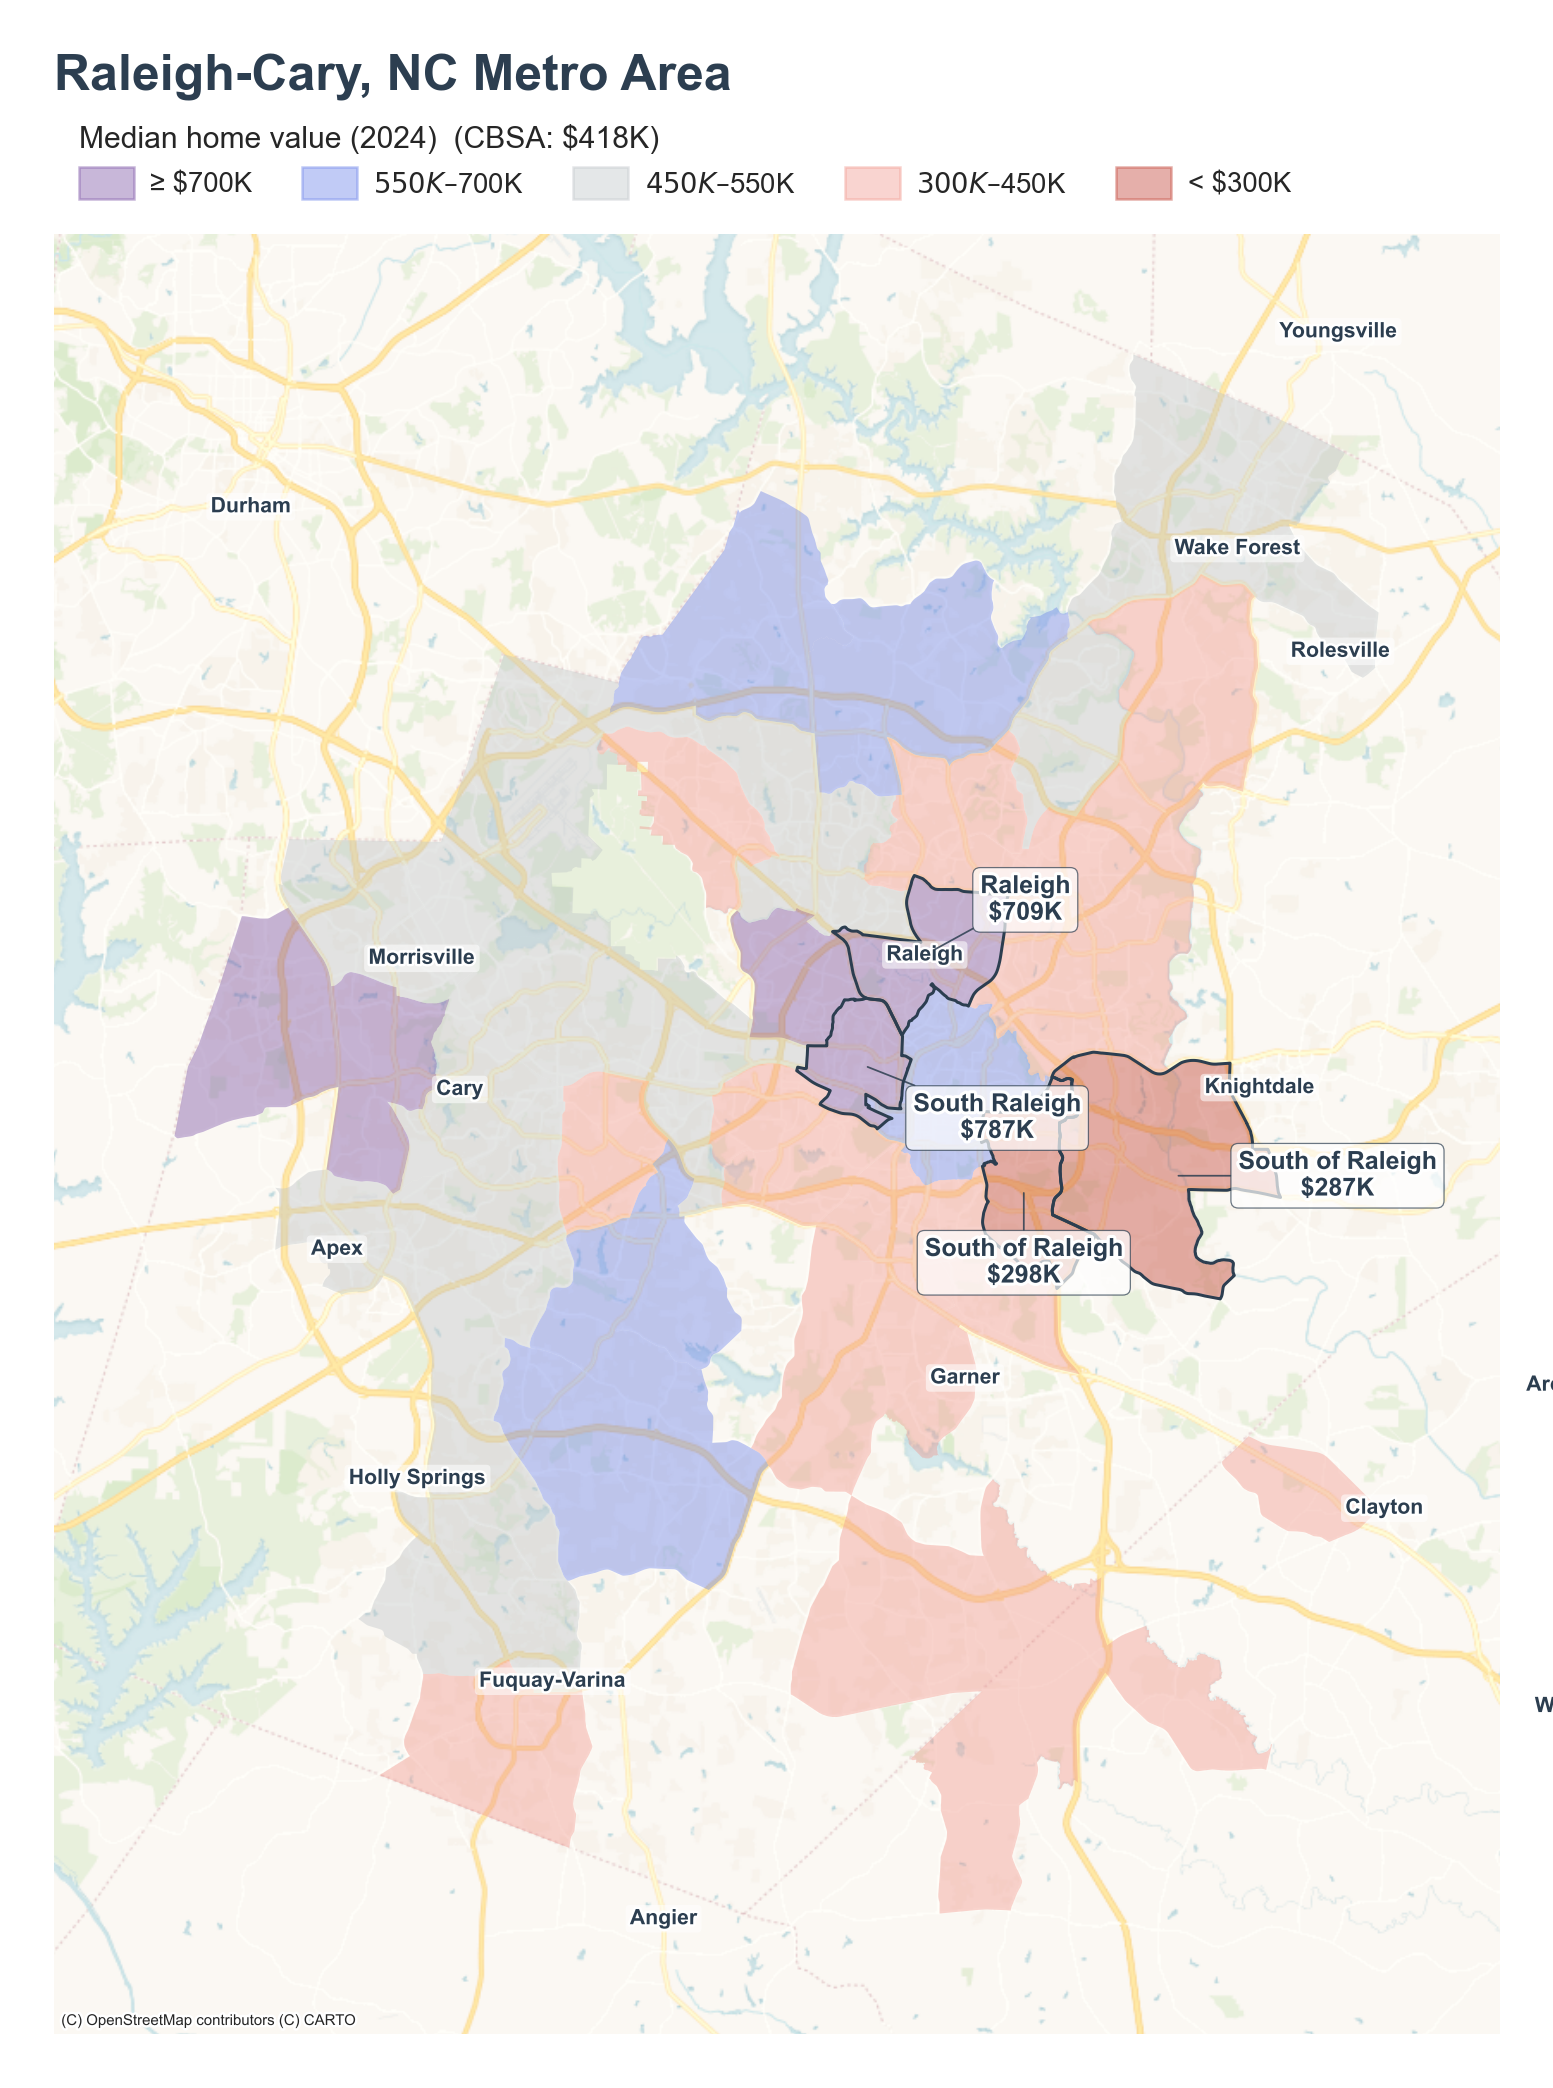
Neighborhood Insights Blog

Data Stories Powered By This Site

Explore data stories and practical guides built from the same Census-backed datasets used across the site.

Explore by place

Click a highlighted state or metro to filter the posts below.

Median home value (2024) by neighborhood across the Orlando metro
Metro Profile 2026-05-31 5 min read

Orlando–Kissimmee–Sanford Metro Profile

A neighborhood-level look at home values, incomes, age, and education across the Orlando metro, where lakefront wealth concentrates in southwest Orange County around Windermere and Horizon West while a wedge of low values runs west of downtown through Pine Hills.

Read post
Median home value (2024) by neighborhood across the Houston metro
Metro Profile 2026-05-31 5 min read

Houston–Pasadena–The Woodlands Metro Profile

A neighborhood-level look at home values, incomes, age, and education across the Houston metro, where a western and southwestern wedge of high-value, highly educated neighborhoods sits above a lower-value eastern band tracing the Houston Ship Channel.

Read post
Wyoming counties shaded by 2024 home-value-to-income ratio with place markers
Housing Affordability 2026-05-30 5 min read

Wyoming Housing Affordability

Wyoming's home-value-to-income ratio rose from 3.43x in 2018 to 4.07x in 2024, crossing from just above the US line to just below it, while Teton County and Jackson pulled past 12x and the energy-producing east stayed near 3x.

Read post
Median home value (2024) by neighborhood across the Washington, DC metro
Metro Profile 2026-05-30 5 min read

Washington–Arlington–Alexandria Metro Profile

A neighborhood-level look at home values, incomes, age, and education across the Washington, DC metro, where wealth and education concentrate in the western inner suburbs from Arlington through Bethesda while the lowest values and incomes sit in Prince George's County to the east and southeast.

Read post
Median home value (2024) by neighborhood across the New York metro
Metro Profile 2026-05-29 4 min read

New York–Newark–Jersey City Metro Profile

A neighborhood-level look at home values, incomes, age, and education across the New York metro, where wealth and education concentrate in the core around Manhattan and the inner New Jersey suburbs while the oldest neighborhoods line the Jersey Shore and the youngest sit in Lakewood.

Read post
New York counties shaded by 2024 home-value-to-income ratio with place markers
Housing Affordability 2026-05-29 5 min read

New York Housing Affordability

New York's home-value-to-income ratio reached 4.93x in 2024, still above the U.S. 4.12x, but the gap narrowed as national affordability eroded faster. A high-ratio downstate and a low-ratio upstate split the state in two.

Read post
Median home value (2024) by neighborhood across the Austin metro
Metro Profile 2026-05-26 5 min read

Austin–Round Rock–San Marcos Metro Profile

A neighborhood-level look at home values, incomes, age, and education across the Austin metro, where a wealthy wedge west of the city tops every metric and a band of lower-value, younger neighborhoods runs from east Austin south through Kyle to San Marcos.

Read post
County choropleth with place markers
Housing Affordability 2026-05-25 4 min read

Utah Housing Affordability

Utah's home-value-to-income ratio reached 5.14x in 2024, opening a full point above the United States as home values grew nearly twice as fast as household income.

Read post
South Carolina counties shaded by 2024 home-value-to-income ratio with place markers overlaid
Housing Affordability 2026-05-25 4 min read

South Carolina Housing Affordability

South Carolina's home-value-to-income ratio rose from 3.03x in 2018 to 3.74x in 2024, trailing the US 4.12x. The coast — Charleston, Beaufort, Hilton Head, Myrtle Beach — pulled the high end; rural inland counties anchored the bottom.

Read post
Median home value (2024) by tract cluster
Metro Profiles 2026-05-25 4 min read

Salt Lake City Metro Profile

A neighborhood-level look at home values, income, age, and education across the Salt Lake City–Murray metro, anchored by a wealthy east-bench band running from the University of Utah south to Draper, set against a working-class corridor through West Valley City.

Read post
North Carolina counties shaded by 2024 home-value-to-income ratio with place markers overlaid
Housing Affordability 2026-05-25 4 min read

North Carolina Housing Affordability

North Carolina's home-value-to-income ratio rose from 3.17x in 2018 to 3.99x in 2024, trailing the US 4.12x but climbing on the same slope. The Blue Ridge mountains, the Outer Banks, and university towns pulled the ≥5x bucket; rural east and coastal-plain counties anchored the bottom.

Read post
Median home value (2024) by tract cluster
Metro Profile 2026-05-25 5 min read

Miami–Fort Lauderdale–Pompano Beach Metro Profile

A neighborhood-level look at home values, incomes, age, and education across the Miami metro, where the Atlantic coastal band runs far above the metro and an inland strip from west Pompano Beach through Homestead sits well below it.

Read post
Massachusetts counties shaded by 2024 home-value-to-income ratio with place markers
Housing Affordability 2026-05-25 4 min read

Massachusetts Housing Affordability

Massachusetts's home-value-to-income ratio reached 5.41x in 2024, well above the US 4.12x, with the islands and Greater Boston pushing past 7x while the western counties still sit near 4x.

Read post
Median home value (2024) by neighborhood cluster across the Los Angeles metro
Metro Profiles 2026-05-25 5 min read

Los Angeles–Long Beach–Anaheim Metro Profile

A neighborhood-level read on home value, income, age, and education across the Los Angeles–Long Beach–Anaheim metro, where a coastal Westside–Palos Verdes–south-Orange-County wedge anchors the high end and an inland band from central LA out to the Pomona–Ontario edge anchors the low end.

Read post
County choropleth with place markers
Housing Affordability 2026-05-25 5 min read

Illinois Housing Affordability

Illinois homes still cost about three times household income, nearly a full point below the United States. The pressure is concentrated in Chicago's North Shore and DuPage suburbs while much of downstate remains under 2x.

Read post
Median home value (2024) by tract cluster
Metro Profiles 2026-05-25 4 min read

Denver–Aurora–Centennial Metro Profile

A neighborhood-level look at home values, income, age, and education across the Denver–Aurora–Centennial metro, anchored by a wealthy southern wedge and a working-class northeast band through Commerce City and north Aurora.

Read post
Median home value (2024) by tract cluster
Metro Profile 2026-05-25 4 min read

Charlotte–Concord–Gastonia Metro Profile

A neighborhood-level look at home value, income, age, and education across the Charlotte–Concord–Gastonia metro, where a wealthy southern wedge through uptown contrasts with lower-value mill-town and exurban edges.

Read post
California counties shaded by 2024 home-value-to-income ratio with place markers
Housing Affordability 2026-05-25 6 min read

California Housing Affordability

California's home-value-to-income ratio reached 7.41x in 2024, roughly 1.8x the U.S. level, and nearly half of households now live in places at 8x or higher.

Read post
Median home value (2024) by neighborhood across the Boston metro
Metro Profile 2026-05-25 5 min read

Boston–Cambridge–Newton Metro Profile

A neighborhood-level look at home values, incomes, age, and education across the Boston metro, where a wealthy MetroWest band running through Wellesley, Newton, and Lexington tops every metric and the lowest values sit on the metro's southern and northern fringes.

Read post
Median home value (2024) by tract cluster
Metro Profile 2026-05-24 5 min read

Sacramento–Roseville–Folsom Metro Profile

A neighborhood-level look at home value, household income, age, and education across the Sacramento–Roseville–Folsom metro, where wealth concentrates along a northeast suburban band from Granite Bay to El Dorado Hills while inner Sacramento and the North Highlands corridor anchor the metro's lower end.

Read post
County choropleth with place markers
Housing Affordability 2026-05-22 4 min read

Iowa Housing Affordability

Iowa's home-value-to-income ratio sits well below the national figure, but the gap has widened sharply since 2018 as home values outran incomes and households slid into higher ratio buckets.

Read post
County choropleth with place markers
Housing Affordability 2026-05-21 4 min read

Texas Housing Affordability

Texas still sits below the national home-value-to-income ratio, but the gap has closed sharply since 2018 as home values raced ahead of incomes. The pressure concentrates in the Hill Country and the Austin–Dallas axis, while the Panhandle and Rio Grande Valley remain the most affordable corners of the state.

Read post
Median home value (2024) by neighborhood across the Dallas–Fort Worth metro
Metro Profile 2026-05-21 4 min read

Dallas–Fort Worth–Arlington Metro Profile

A neighborhood-level look at home values, incomes, age, and education across the Dallas–Fort Worth metro, where a wealthy spine running from the Park Cities up through Southlake and North Dallas sits above lower-value communities in south Dallas and east Fort Worth.

Read post
Median home value (2024) by neighborhood across the Chicago–Naperville–Elgin metro
Metro Profile 2026-05-21 4 min read

Chicago–Naperville–Elgin Metro Profile

A neighborhood-level look at home values, income, age, and education across the Chicago–Naperville–Elgin metro. The North Shore and the Hinsdale–Oak Brook western suburbs concentrate wealth and degrees; Gary, East Chicago, and the South Cook County edge sit at the bottom of value, income, and education.

Read post
County choropleth with place markers
Housing Affordability 2026-05-20 4 min read

Florida Housing Affordability

Florida's home-value-to-income ratio crossed the United States line during the pandemic and kept climbing. The pressure concentrates in South Florida and the Keys, while the rural Panhandle stays the most affordable part of the state.

Read post
Median home value (2024) by neighborhood across the Des Moines–West Des Moines metro
Metro Profile 2026-05-20 4 min read

Des Moines–West Des Moines Metro Profile

A neighborhood-level look at home values, income, age, and education across the Des Moines–West Des Moines metro. The western suburban band from Waukee through Urbandale concentrates wealth and degrees; central and north-side Des Moines sit at the bottom of value, income, and education together.

Read post
County choropleth with place markers
Housing Affordability 2026-05-20 4 min read

Colorado Housing Affordability

Colorado's home-value-to-income ratio has pulled further away from the United States since 2018, with the mountain resort corridor running near double the state figure and the southeastern plains holding the only affordable corners left.

Read post
Median home value (2024) by neighborhood across the Columbus, OH metro
Metro Profile 2026-05-19 4 min read

Columbus, OH Metro Profile

A neighborhood-level look at home values, income, age, and education across the Columbus, OH metro. The Dublin–Upper Arlington arc concentrates wealth and degrees; the campus belt skews young; East Columbus and Whitehall sit at the bottom of value, income, and education.

Read post
Median home value (2024) by neighborhood across the Phoenix–Mesa–Chandler metro
Metro Profile 2026-05-17 6 min read

Phoenix–Mesa–Chandler Metro Profile

A neighborhood-level look at home value, household income, age, and education across the Phoenix–Mesa–Chandler metro, benchmarked against metro-wide medians.

Read post
Maine counties shaded by 2024 home-value-to-income ratio with place markers
Housing Affordability 2026-05-13 4 min read

Maine Housing Affordability

Maine's home-value-to-income ratio climbed from 3.33x in 2018 to 3.97x in 2024, still below the US 4.12x but pulled up by a southern coastal strip where Portland and resort towns now sit above 6x.

Read post
Median home value (2024) by neighborhood across the Atlanta metro
Metro Profile 2026-05-12 4 min read

Atlanta–Sandy Springs–Roswell Metro Profile

A neighborhood-level look at home values, incomes, age, and education across the Atlanta metro, where a wealthy northern arc sits beside lower-value southern communities along the airport corridor.

Read post
Median home value (2024) by neighborhood across the Seattle-Tacoma-Bellevue metro
Metro Profile 2026-05-07 5 min read

Seattle–Tacoma–Bellevue Metro Profile

A neighborhood-level look at home values, incomes, age, and education across the Seattle–Tacoma–Bellevue metro, where the eastside lakeshore sits far above the metro and the south-Tacoma corridor sits well below it.

Read post
County choropleth with place markers
Housing Affordability 2026-05-05 4 min read

Georgia Housing Affordability

Georgia's home-value-to-income ratio rose from 3.00x in 2018 to 3.92x in 2024, trailing the US 4.12x but climbing on the same slope. Metro Atlanta and the north Georgia mountains pulled the ≥5x bucket; rural south and east Georgia anchored the bottom.

Read post
Washington counties shaded by 2024 home-value-to-income ratio with place markers
Housing Affordability 2026-05-04 5 min read

Washington State Housing Affordability

Washington's home-value-to-income ratio reached 5.75x in 2024 against a US figure of 4.12x — a gap that widened every year after 2018 and pushed roughly four in five households into places above the 5x line.

Read post
Ohio counties shaded by 2024 home-value-to-income ratio with place markers
Housing Affordability 2026-05-03 5 min read

Ohio Housing Affordability

Ohio's home-value-to-income ratio is still well below the U.S. average, but the share of Ohioans living in places at 3x or higher rose from 9.3% in 2018 to 38.9% in 2024.

Read post
County choropleth with place markers
Housing Affordability 2026-05-02 4 min read

Minnesota Housing Affordability

Minnesota's home-value-to-income ratio rose from 3.10x in 2018 to 3.70x in 2024, still below the United States at 4.12x, with the strain concentrated in Twin Cities suburbs and the northern lake counties.

Read post
Median home value (2024) by neighborhood across the Minneapolis–St. Paul metro
Metro Profile 2026-05-02 5 min read

Minneapolis–St. Paul–Bloomington Metro Profile

A neighborhood-level look at home values, incomes, age, and education across the Twin Cities metro, where a wealthy western arc through Edina and the Lake Minnetonka suburbs sits beside lower-value pockets ringing east St. Paul.

Read post

Foundational reading

Neighborhood Insights logo
Guide 2026-05-03 5 min read

What are Census Areas?

Census geography is not one simple ladder. Some areas nest cleanly inside one another, while others overlap, split, or sit on a different map entirely. Here is a practical guide to the major Census geographies, how they are defined, and what kind of area or population they usually represent.

Read post
Neighborhood Insights logo
Guide 2026-05-02 3 min read

Where Neighborhood Insights data comes from

Neighborhood Insights brings together Census geography files and ACS measures on population, age, education, marital status, household income, and home values. This guide explains the main metrics on the site and points to the official Census documentation behind them.

Read post