Illinois finished 2024 with a home-value-to-income ratio of 3.16x, against a United States figure of 4.12x — a gap of nearly a full point that has widened every year since 2020.
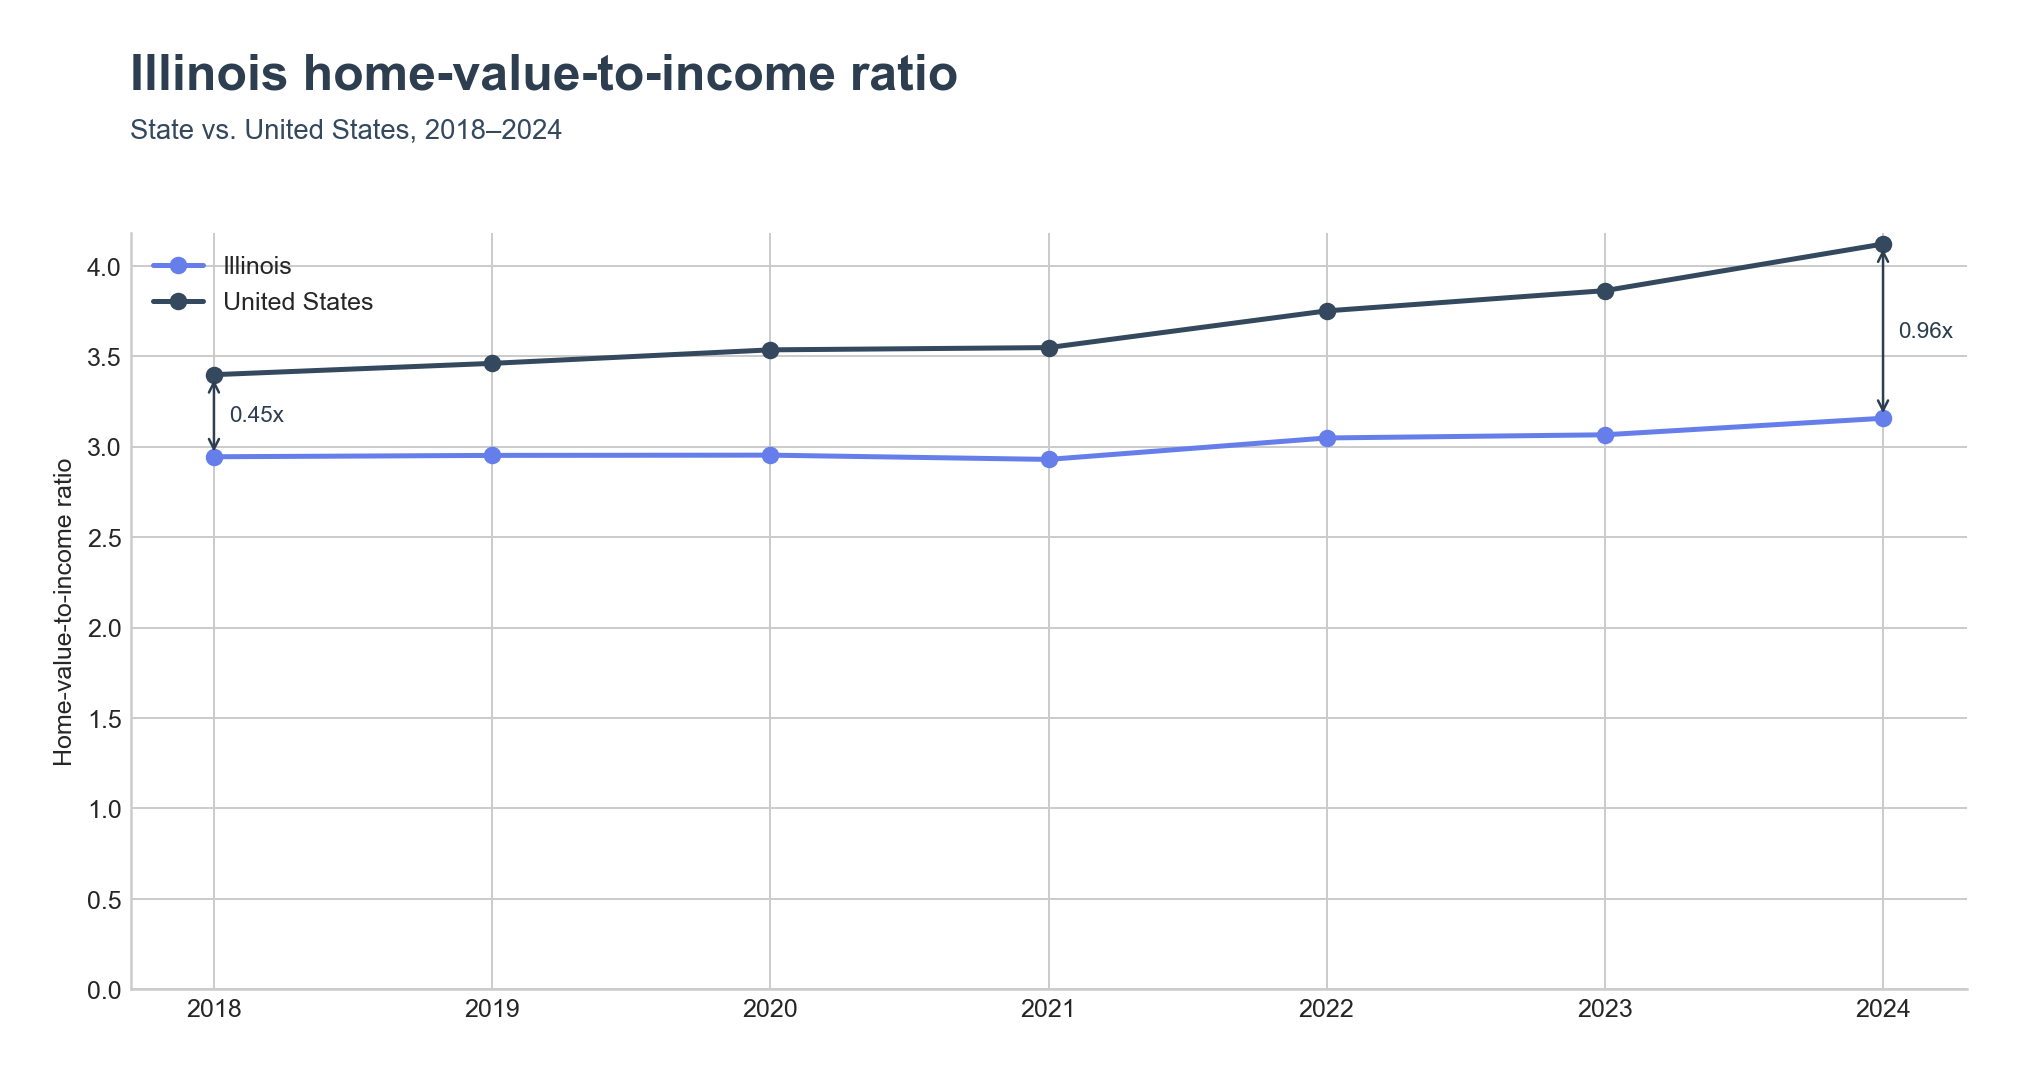
A slower climb than the country
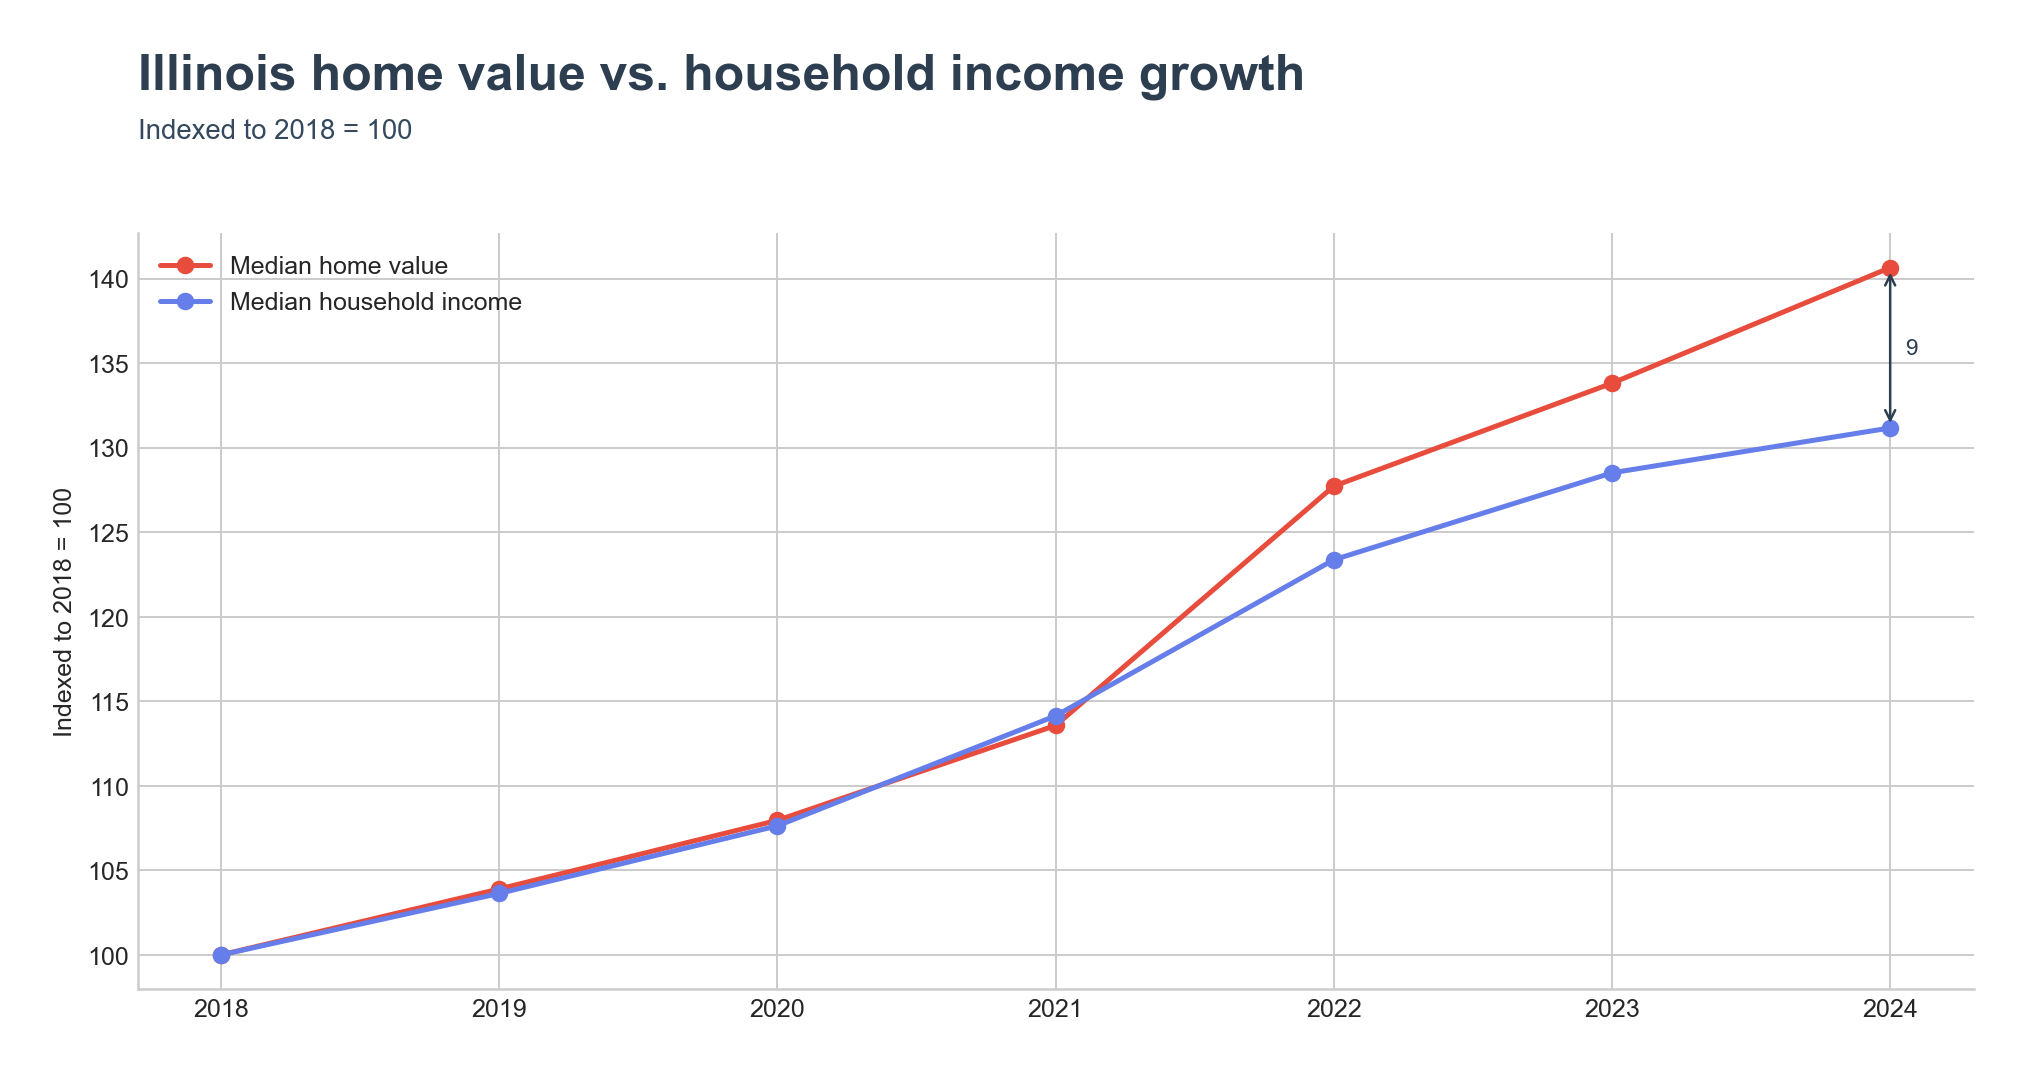
Illinois entered the window at 2.94x in 2018 while the country sat at 3.40x. By 2024 the state had moved to 3.16x and the country to 4.12x. Median home value in Illinois rose from $187,200 to $263,300 (about 41% over six years) while median household income rose from $63,575 to $83,390 (about 31%). The two lines tracked each other through 2021 and then separated, with home values pulling ahead after 2021.
Where the ratio is highest
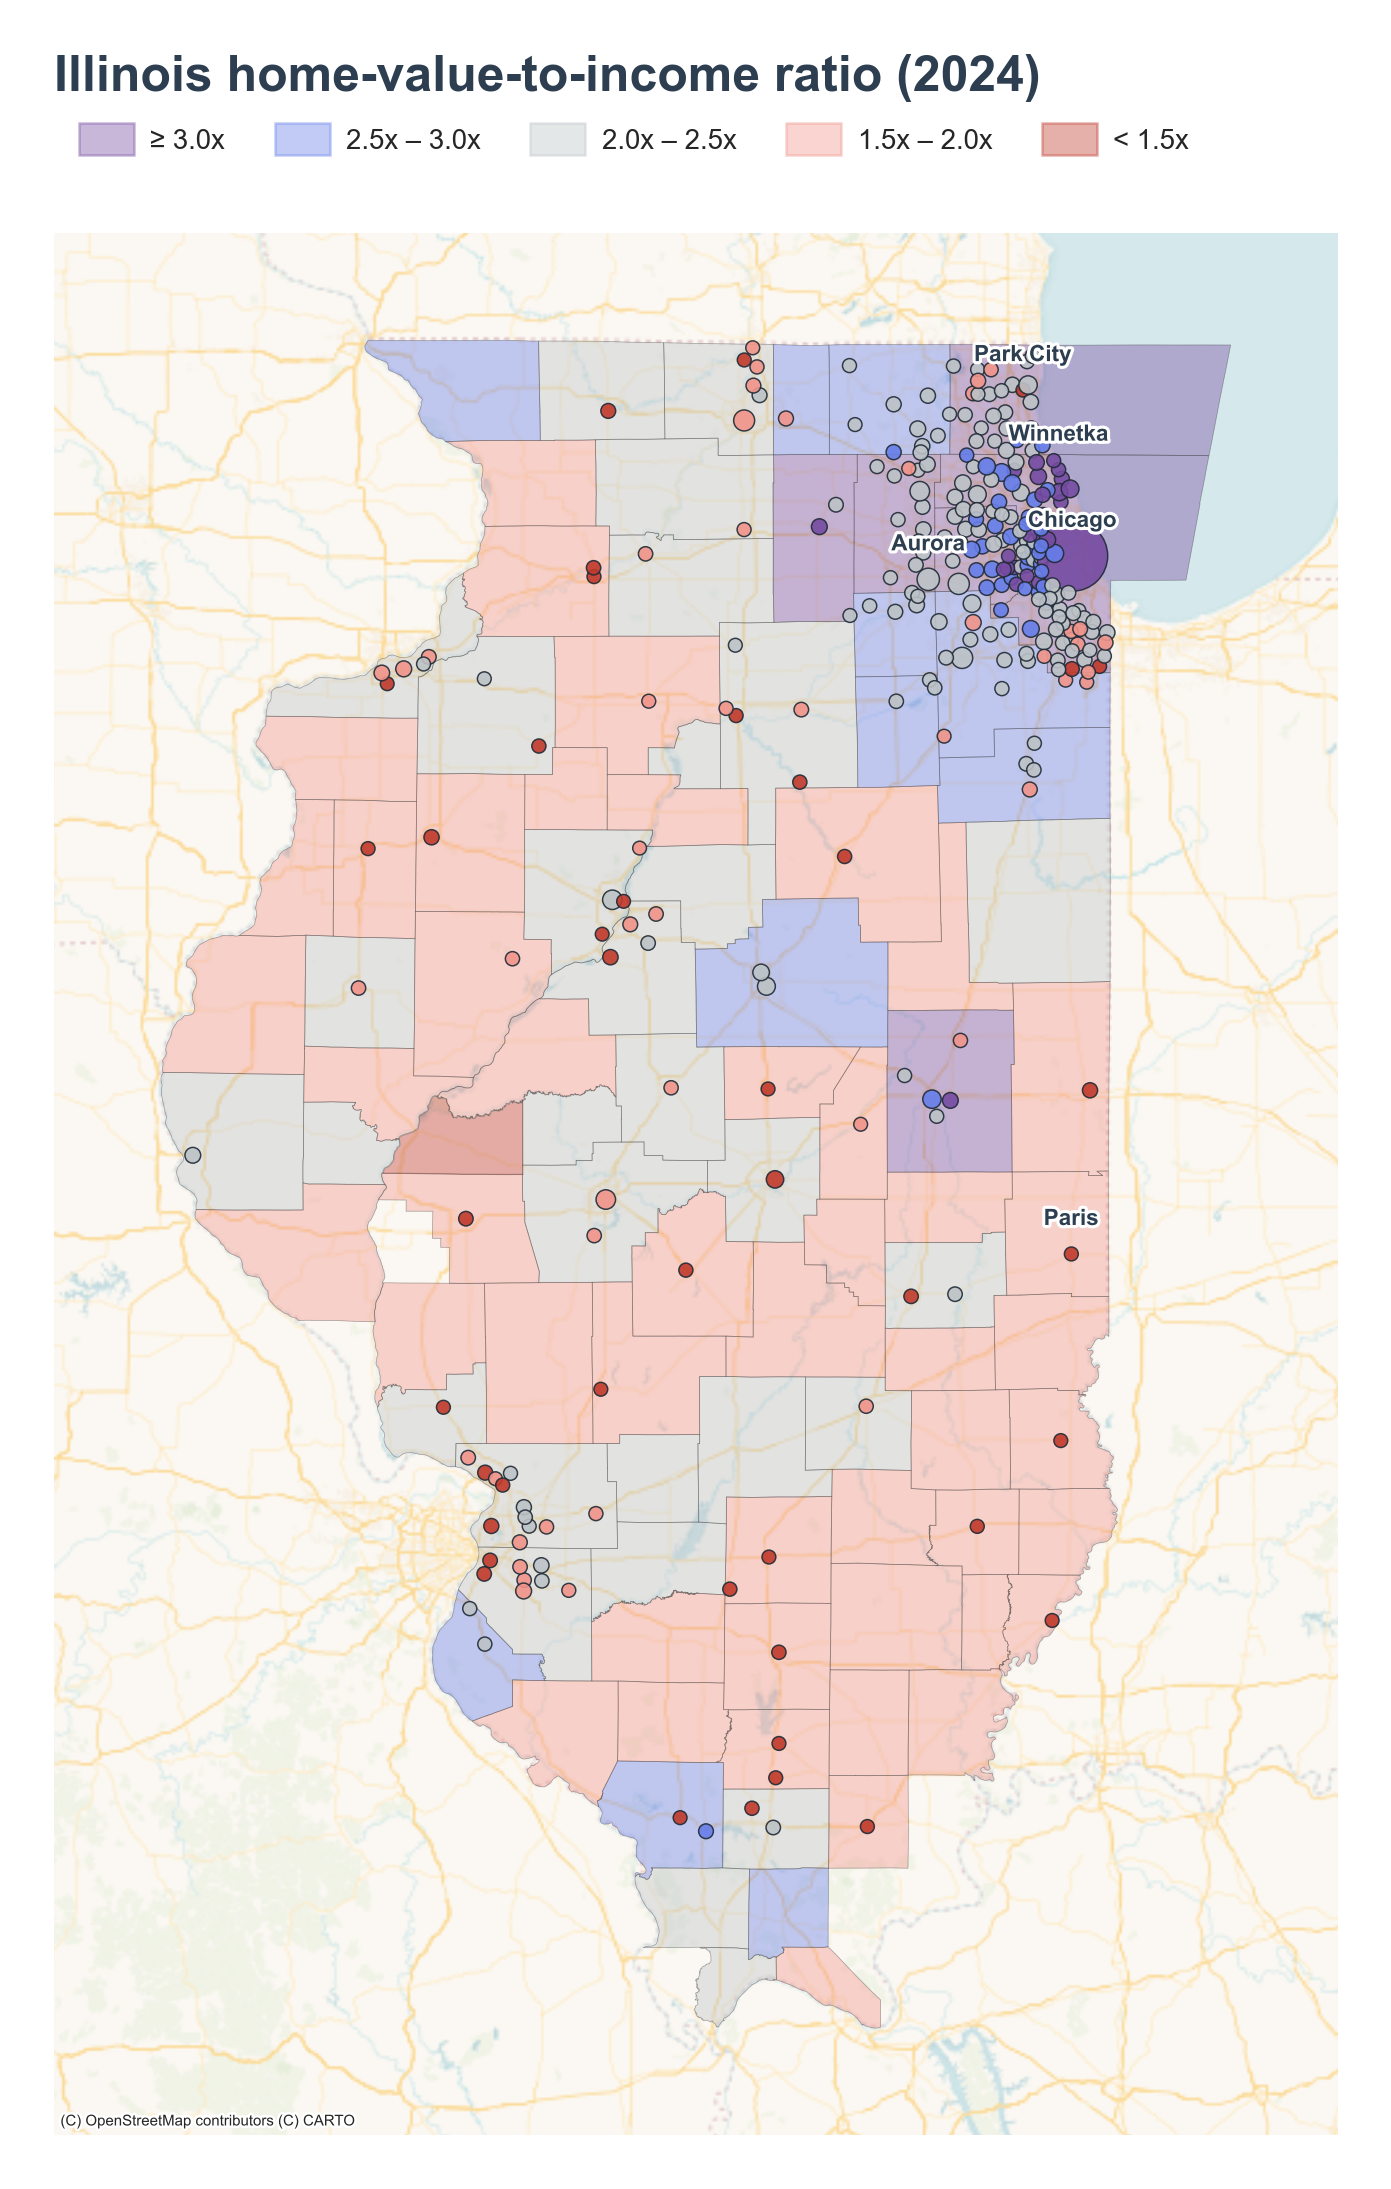
The top of the place ranking is dense along Chicago's North Shore ) and inner-western suburbs. Glencoe leads at 5.75x on a median home value of $1,432,500 and a median household income of $248,933. Neighboring Winnetka sits at 5.35x on a $1,337,800 median value. Both are lakefront villages in New Trier Township , where land-use is dominated by single-family lots and very little new supply.
West of the city, Oak Brook in DuPage County clears 5.14x; it is home to the McDonald's global headquarters and a cluster of corporate campuses. Evanston , home to Northwestern University , reaches 4.99x, and Niles , an older inner-ring suburb just north of Chicago, hits 4.77x.
At the county level, Cook County (the Chicago core) sits at 3.89x, followed by DuPage at 3.49x and Kane at 3.17x — the three populous collar counties anchoring the metro. Two university counties also land in the top five: DeKalb at 3.44x, home to Northern Illinois University , and Champaign at 3.32x, home to the University of Illinois Urbana-Champaign . In each, a large student-renter base pulls the median income down relative to faculty- and family-owned homes.
Where the ratio is lowest
The bottom of the place ranking sits well below the state line. Park City , a small Lake County community, posts the state's lowest ratio at 0.95x — a median home value of just $57,400 against a household income of $60,171, the only place in the ranking where the typical home is worth less than a year of household earnings. Paris , the seat of Edgar County near the Indiana border, comes in at 1.40x.
The rest of the bottom five are western and southwestern Illinois manufacturing or farm communities: Monmouth at 1.42x, Kewanee at 1.44x, and East St. Louis at 1.47x. East St. Louis lost more than two-thirds of its population from its mid-century peak and has the lowest median home value in the group at $52,600.
The bottom of the county ranking is a continuous downstate band. Cass at 1.43x, Greene at 1.53x, Warren at 1.56x, Franklin at 1.57x, and Clay at 1.61x — all rural counties in the western and southern halves of the state, where median home values sit between $89,000 and $105,000.
How the distribution shifted
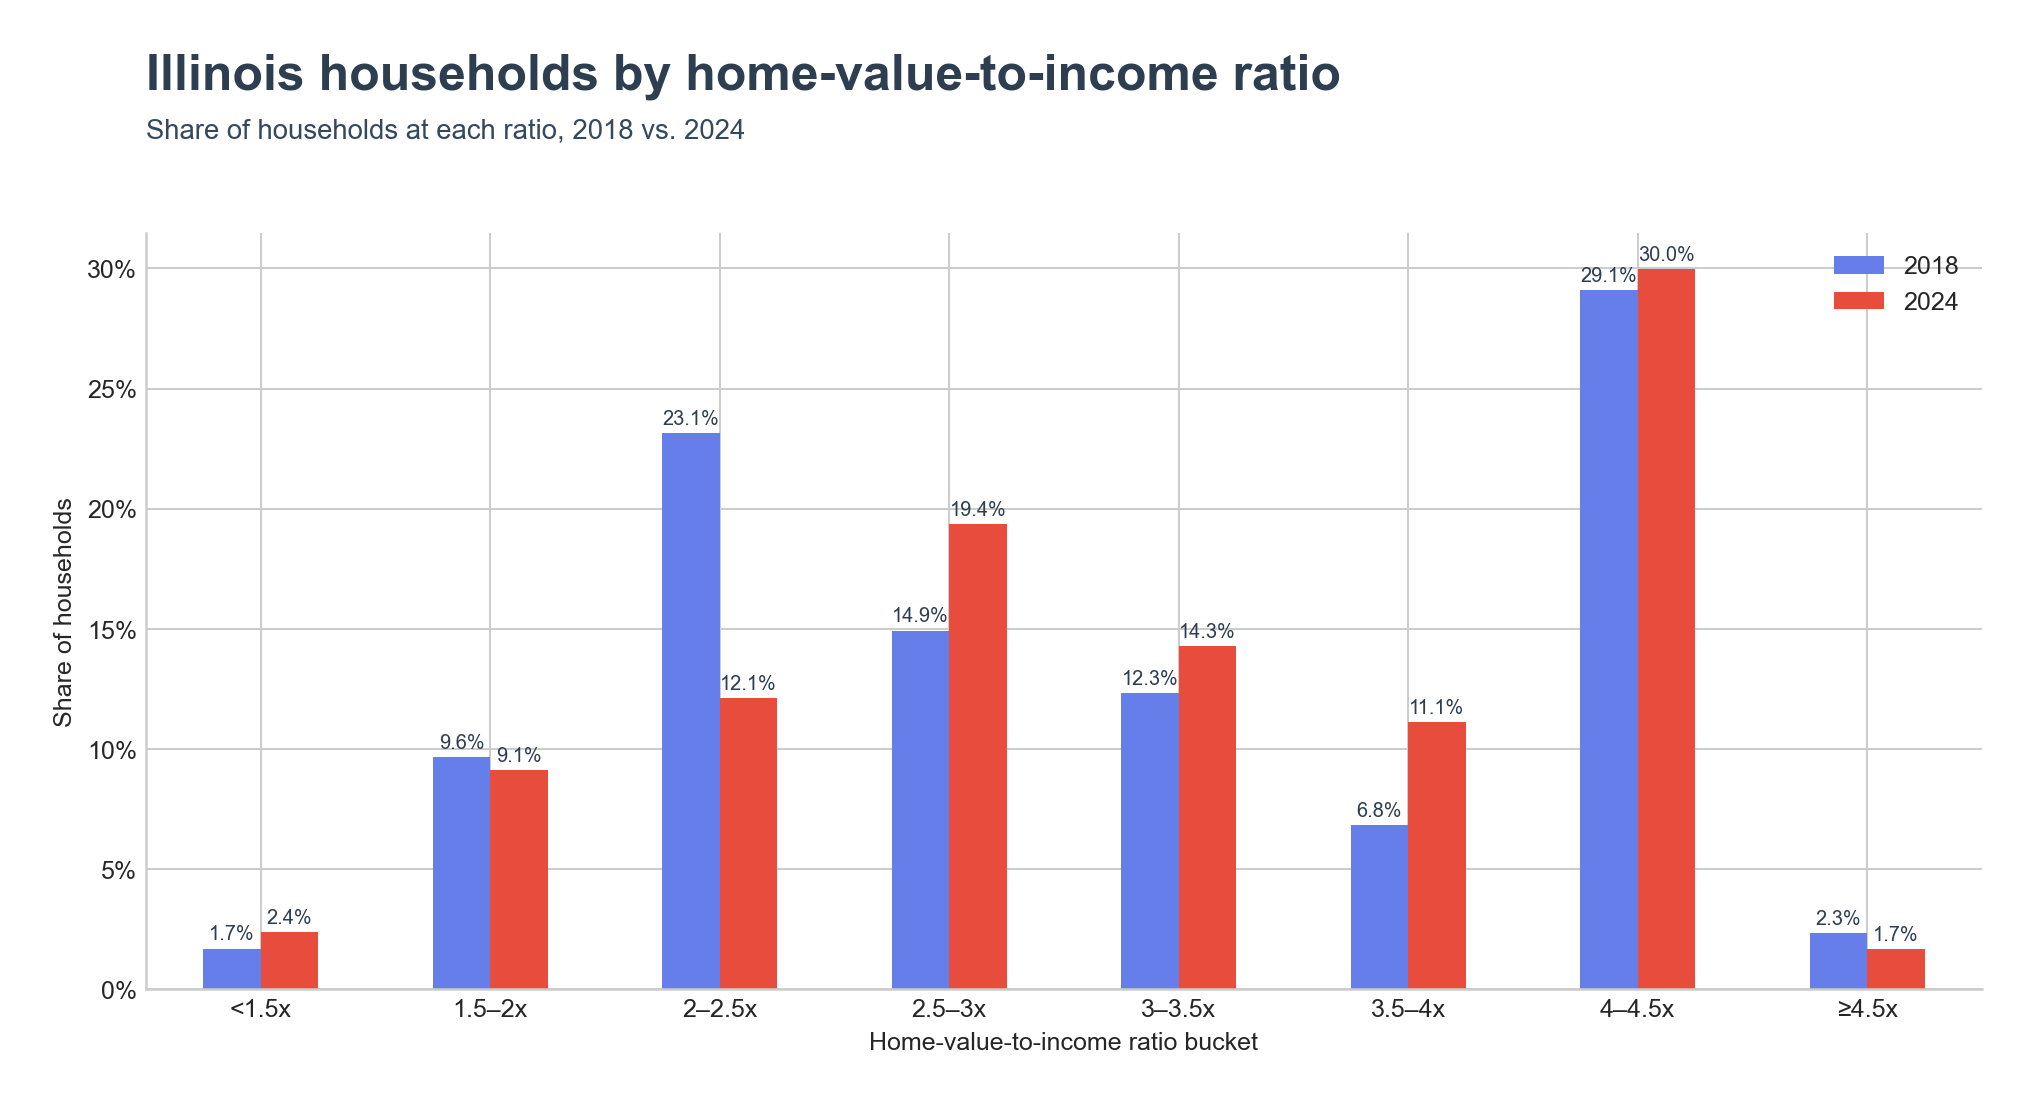
The share of Illinois households living in places at 2–2.5x fell from 23.1% in 2018 to 12.1% in 2024, while the share at 2.5–3x rose from 14.9% to 19.4% and the share at 3.5–4x rose from 6.8% to 11.1%. The 4–4.5x band — the largest single bucket — held roughly flat at about 30%, and the ≥4.5x bucket actually slipped from 2.3% to 1.7%. The shift is the middle of the distribution moving up by half a step, not the high end pulling further away.
Key Takeaways
- Illinois's home-value-to-income ratio rose from 2.94x in 2018 to 3.16x in 2024, staying about a full point below the United States figure of 4.12x.
- Median home value grew 41% while median household income grew 31%, with the split opening up after 2021.
- The highest-ratio places are concentrated on Chicago's North Shore (Glencoe at 5.75x, Winnetka at 5.35x) and in DuPage (Oak Brook at 5.14x).
- University counties DeKalb (3.44x) and Champaign (3.32x) sit near the top alongside the Chicago collar counties Cook, DuPage, and Kane.
- The lowest-ratio communities are downstate manufacturing and farm towns plus East St. Louis, all under 1.5x on median home values below $90,000.
- The household distribution shifted up by about half a bucket — the 2–2.5x band shrank by 11 points while the 2.5–3x and 3.5–4x bands grew.