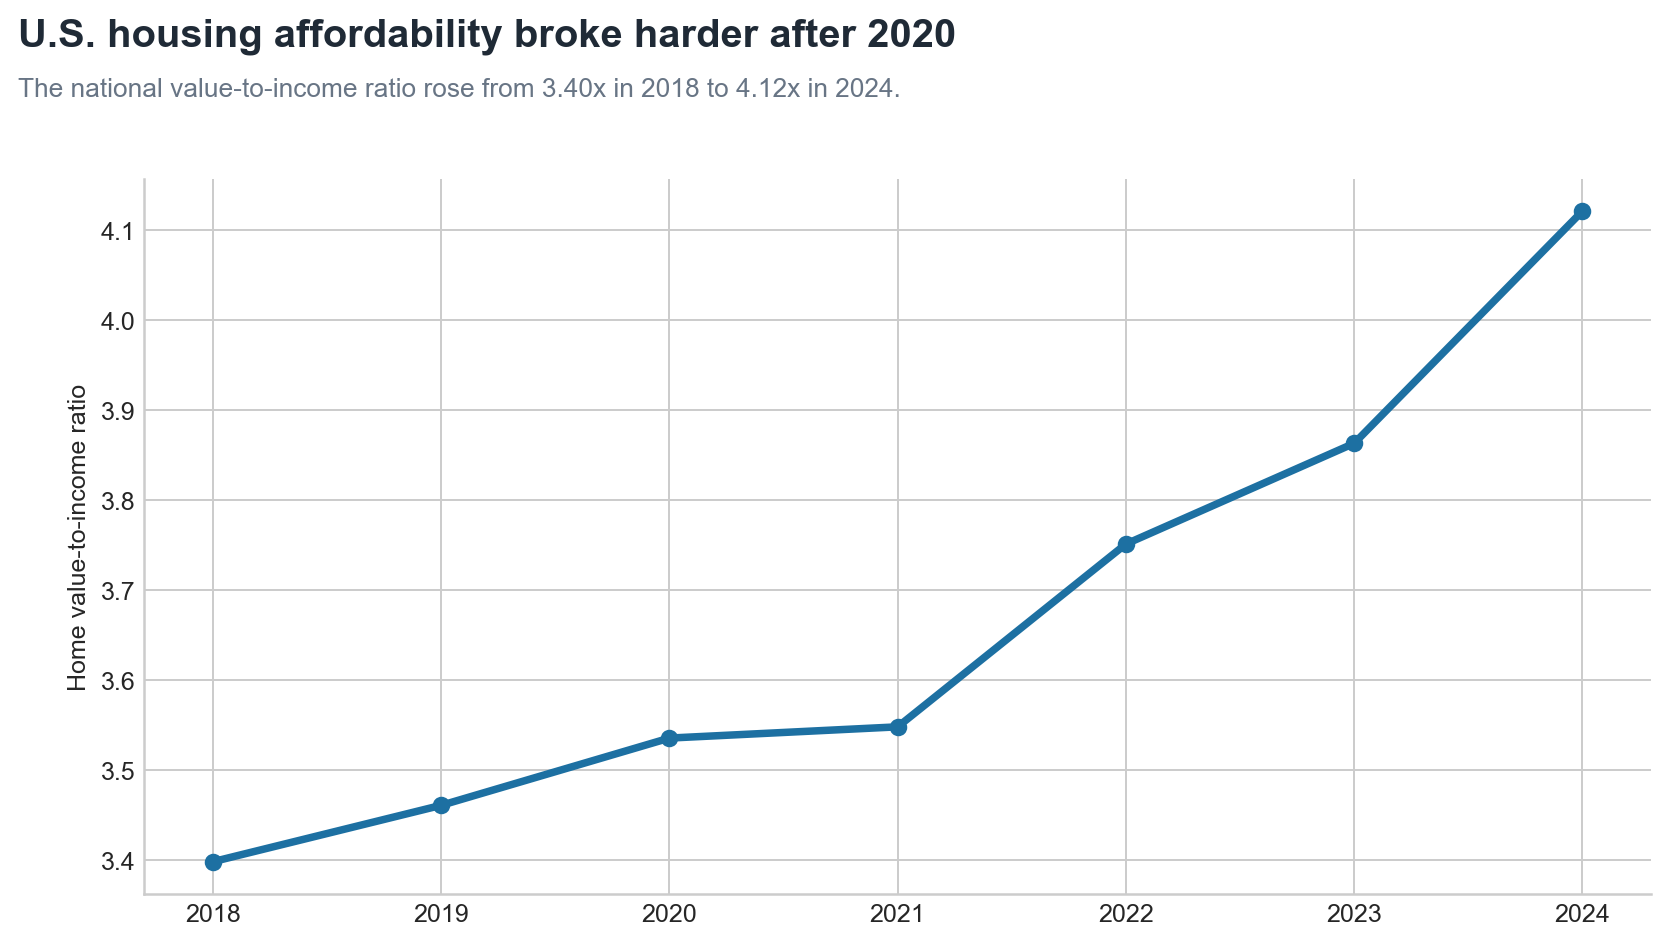
After 2020, the rise in housing affordability ratio accelerated significantly.
If you measure housing affordability as median home value divided by median household income, or the "affordability ratio", the pattern is clear: U.S. affordability did not just keep drifting at the same speed after COVID. It switched gears.
The national affordability ratio rose from 3.40x in 2018 to 3.54x in 2020, then jumped to 4.12x in 2024. The pace of increase almost doubled from +0.07x per year during 2018-2020 to about +0.15x per year during 2020-2024.
You see a clear acceleration in affordability ratio after 2020.
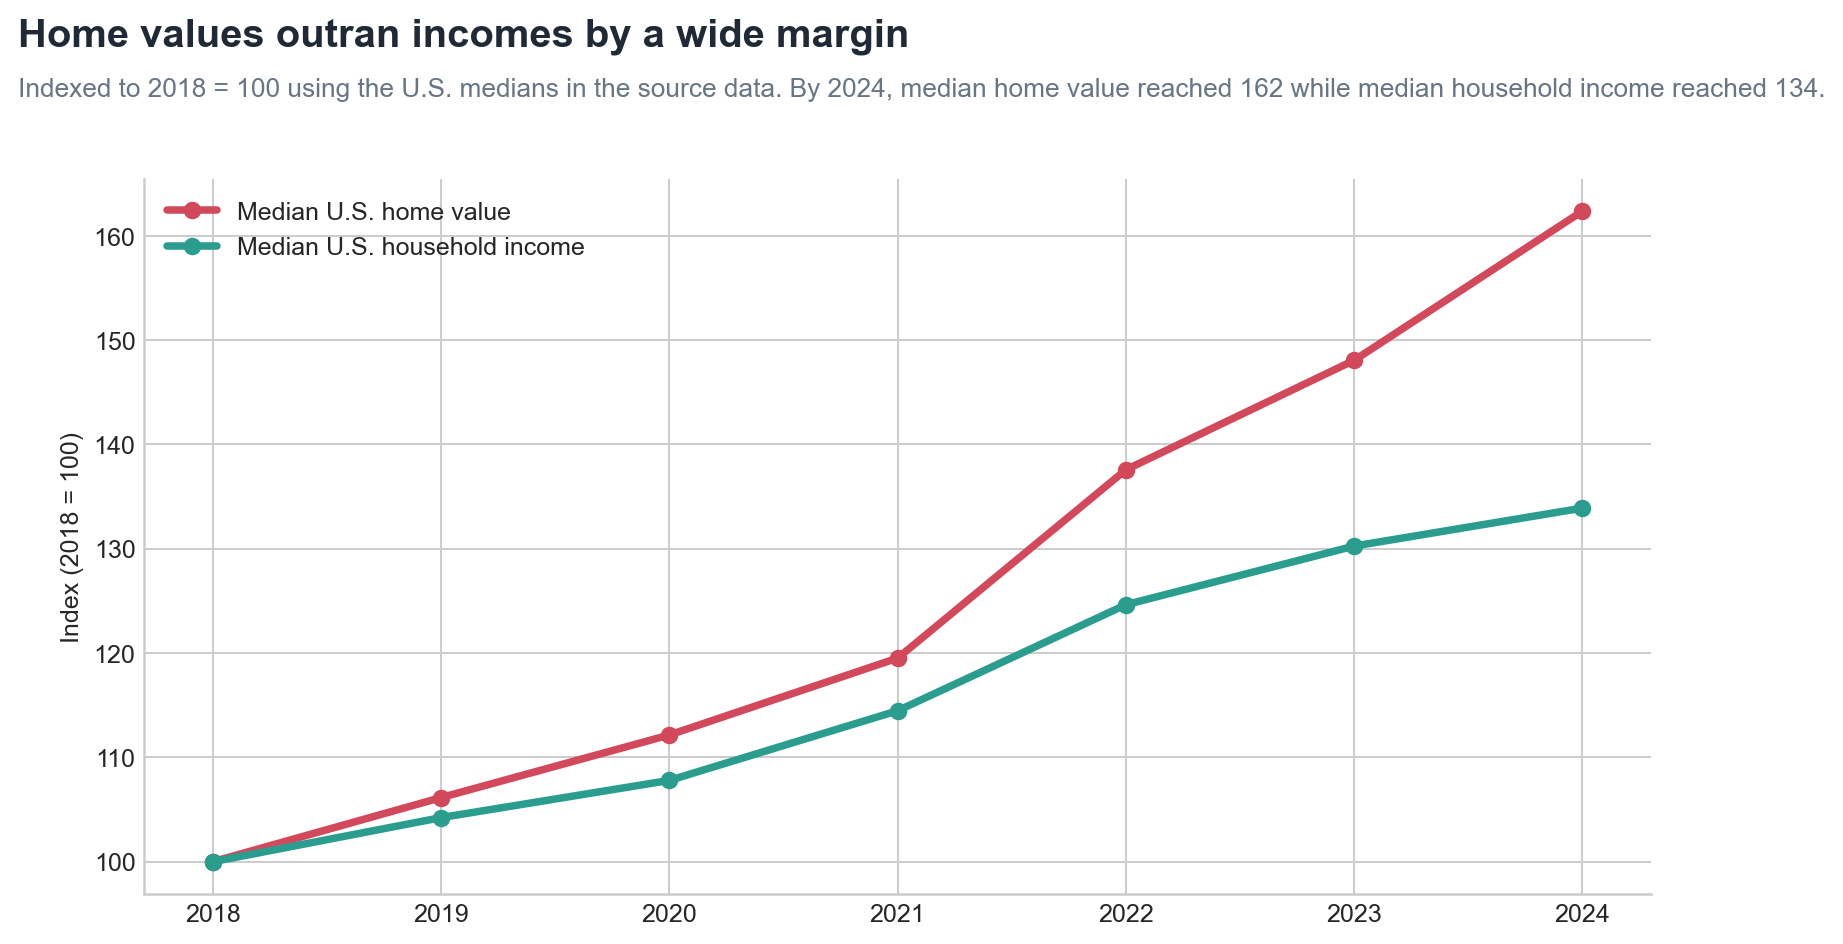
Home values outran incomes.
At the national level, the U.S. median home value rose from $204,900 in 2018 to $332,700 in 2024, a 62.4% increase. Median household income rose from $60,293 to $80,734, a 33.9% increase. Both went up. The price side just ran much faster.
The shape of the housing stock shifted too. Homes valued below $200,000 made up 48.9% of housing units in 2018, but only 27.2% in 2024. Homes valued at $750,000 or more went from 6.0% to 13.9%. On the income side, households earning $150,000 or more rose from 13.3% to 23.0%, while households below $25,000 fell from 20.2% to 14.6%.
These numbers do not account for other costs of housing like rates, supply, migration, local zoning, or investor demand. But they do show the basic mechanics: the housing-value distribution moved upward faster than the income distribution did.
The acceleration after 2020 showed up almost everywhere, not just in a few select markets.
The faster yearly shift after 2020 shows up across most geography types. Among states plus DC, 96% had a faster yearly increase in the affordability ratio from 2020 to 2024 than from 2018 to 2020 (49 of 51). The two exceptions were Nevada and North Dakota. Both still became less affordable, but their pre-2020 pace was already unusually fast, and their post-2020 yearly increase did not exceed that earlier pace. 82% of CBSAs and 69% of places[1] had a faster post-2020 yearly increase than pre-2020.
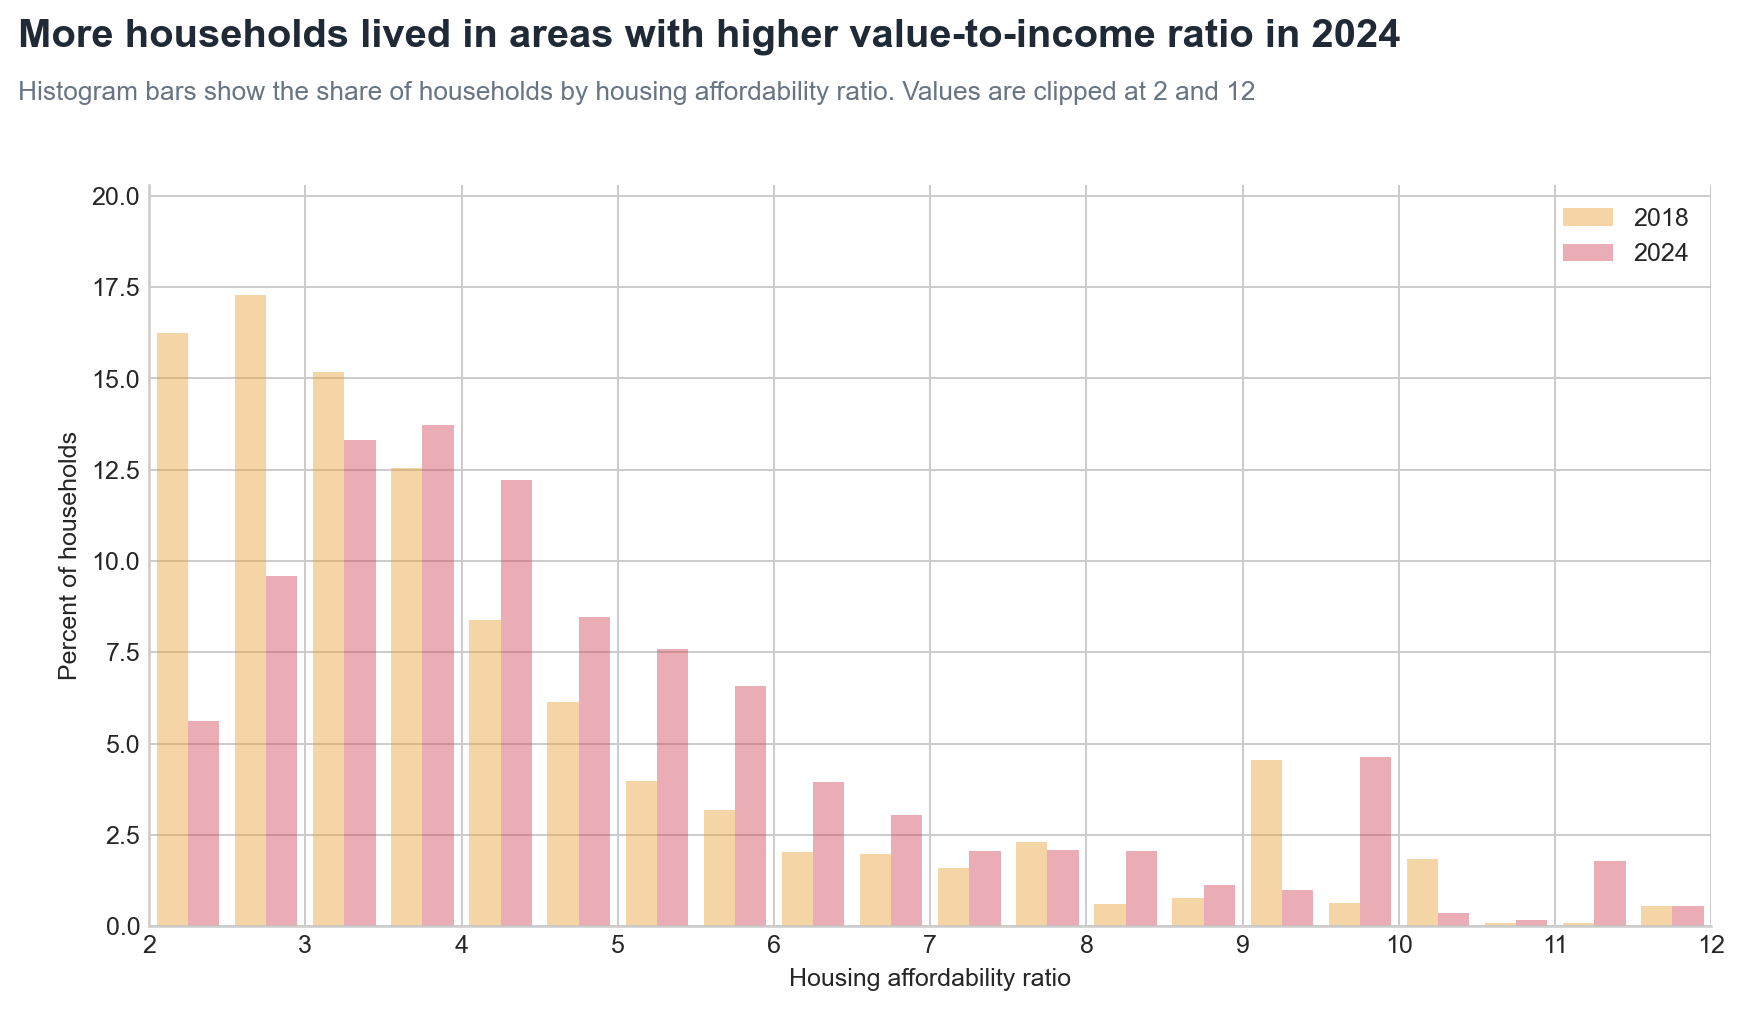
This was not just a shift in a few outliers. The share of households living in places with 5x+ affordability ratios rose from 24.2% to 37.0%.
The charts below show how households shifted across affordability-ratio buckets between 2018 and 2024, and where post-2020 annualized increases were faster than the 2018-2020 pace.[2]
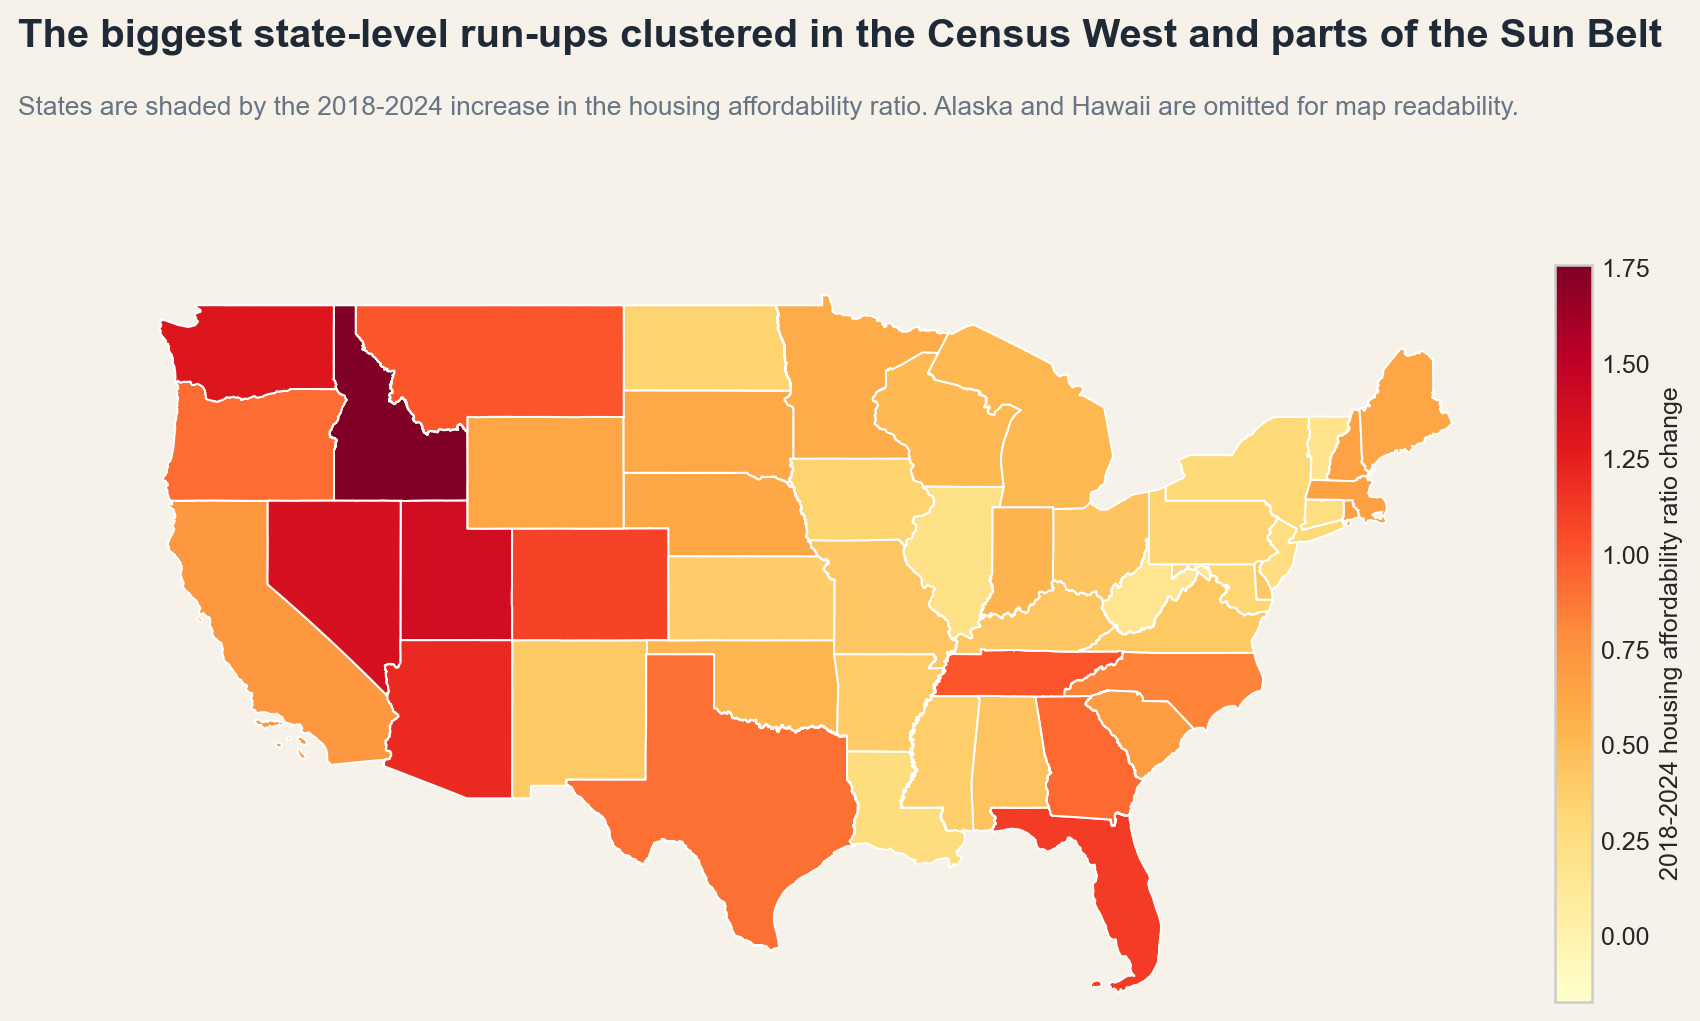
The West still has the highest value-to-income ratios.
Here, the West refers to the official Census West region.[3] The West remains the region with the highest home-value-to-income ratios by a large margin. In 2024, the weighted average affordability ratio (weighted by households) was 6.35x in the West, compared with 4.38x in the Northeast, 3.91x in the South, and 3.18x in the Midwest. Among places included here, the gap is stark. In the West, 64.5% of places were already above 5x in 2024. In the Midwest, only 1.5% were.
At the state level, the biggest 2018-2024 increases came from Idaho (+1.76x), Utah (+1.39x), Nevada (+1.36x), Washington (+1.31x), and Arizona (+1.21x). But the South shows how widely the strain spread: Florida (+1.12x), Tennessee (+1.01x), Georgia (+0.93x), and Texas (+0.90x) all posted large increases even though the region still sits below the West in absolute housing affordability ratio terms.
Big metros still top the rankings, but smaller regional markets are no longer offstage.
The country's biggest metros[4] still dominate the expensive end of the list. In 2024, Los Angeles sat at 9.08x, San Jose at 8.93x, San Francisco at 8.39x, and San Diego at 8.04x. Among very large metros, the biggest 2018-2024 increases included Las Vegas (+1.44x), Seattle (+1.40x), Nashville (+1.33x), and Tampa (+1.32x).
Micro areas included here still had a lower median housing affordability ratio than metros in 2024, 2.94x versus 3.58x, yet some of them now look like classic high-cost metro markets. Jackson, WY-ID reached 9.05x, Kapaa, HI hit 8.94x, and Key West-Key Largo, FL came in at 8.90x. The fastest micro-area increases included Sandpoint, ID (+2.48x), Kalispell, MT (+2.35x), and Heber, UT (+2.00x).
By 2024, housing affordability looked less like a local exception and more like a national reset.
By 2024, the affordability problem had spread well beyond the places people already expected to be expensive. The West still had the highest home value-to-income ratios, and the biggest coastal metros still sat near the top of the rankings, but the post-2020 shift was much broader than that. Home values pulled farther away from incomes across all states with especially large increases spreading through the South, smaller CBSAs, and many places outside the principal city in a region.
The timing matters as well. The national affordability ratio rose only modestly from 2018 to 2020, then accelerated sharply from 2020 to 2024. By 2024, many more households were living in places where buying a typical home required stretching incomes more than before. This ratio does not include the full cost of housing. But as a broad measure of how far home values have moved beyond local incomes, it shows a clear national pattern: after 2020, the affordability problem became wider, faster-moving, and harder to treat as someone else's local issue.
Sources and Footnotes
For background on the data behind these numbers, see Where Neighborhood Insights data comes from and What are Census Areas?.
This article uses the annual American Community Survey 5-year releases for 2018 through 2024. The main measure is the housing affordability ratio, defined here as median home value / median household income.
- Median household income comes from ACS Detailed Table B19013, Median Household Income in the Past 12 Months
- Median home value comes from B25077, Median Value (Dollars)
- Household income bracket shares come from B19001, Household Income in the Past 12 Months
- Home value bracket shares come from B25075, Value .
Geography definitions come from the Census Bureau:
- Geography Program Glossary ,
- Metropolitan and Micropolitan Statistical Area Glossary
- About Metropolitan and Micropolitan Statistical Areas
- Census Designated Places .
State comparisons use the 50 states plus DC; territory-equivalent units and Puerto Rico CBSAs are excluded, and the national state map omits Alaska and Hawaii for plotting clarity.
[1] Place comparisons. In Census usage, a place is a named community such as a city, town, village, borough, or Census-designated place. Unless otherwise noted, place comparisons in this article focus on places with at least 2,500 residents and 1,000 households in 2024. Back
[2] National ratio, weighting, and distribution chart. The U.S. housing affordability ratio uses the direct U.S. ACS document, not a weighted average of places. Regional ratios are weighted by household counts across states within each Census region. The histogram uses equal-width 0.5x bins, clips values below 2x to 2x, clips values above 12x to 12x, and compares household-weighted place distributions for 2018 and 2024. The post-2020 comparison uses annualized changes so the 2018-2020 and 2020-2024 periods are compared on the same yearly basis. Back
[3] Census regions. When this article says West, South, Midwest, and Northeast, it means the four official Census regions. Back
- Northeast: Connecticut, Maine, Massachusetts, New Hampshire, Rhode Island, Vermont, New Jersey, New York, and Pennsylvania.
- Midwest: Illinois, Indiana, Michigan, Ohio, Wisconsin, Iowa, Kansas, Minnesota, Missouri, Nebraska, North Dakota, and South Dakota.
- South: Delaware, Florida, Georgia, Maryland, North Carolina, South Carolina, Virginia, District of Columbia, West Virginia, Alabama, Kentucky, Mississippi, Tennessee, Arkansas, Louisiana, Oklahoma, and Texas.
- West: Alaska, Arizona, California, Colorado, Hawaii, Idaho, Montana, Nevada, New Mexico, Oregon, Utah, Washington, and Wyoming.
[4] Metro, micro, and principal-city comparisons. A metro area is a regional labor market built around an urban core of at least 50,000 people, and a micro area is the smaller version built around an urban core of 10,000 to 50,000 people. Metro and micro-area comparisons here include CBSAs with valid affordability ratios in 2018, 2020, and 2024; Puerto Rico CBSAs are excluded. The principal-city comparison uses the Census field that marks whether a place is one of the main cities in a metro area and is limited to places with at least 10,000 people. Back
[5] CDPs. A CDP, or Census-designated place, is a named community the Census tracks even though it is not an incorporated city or town. Back