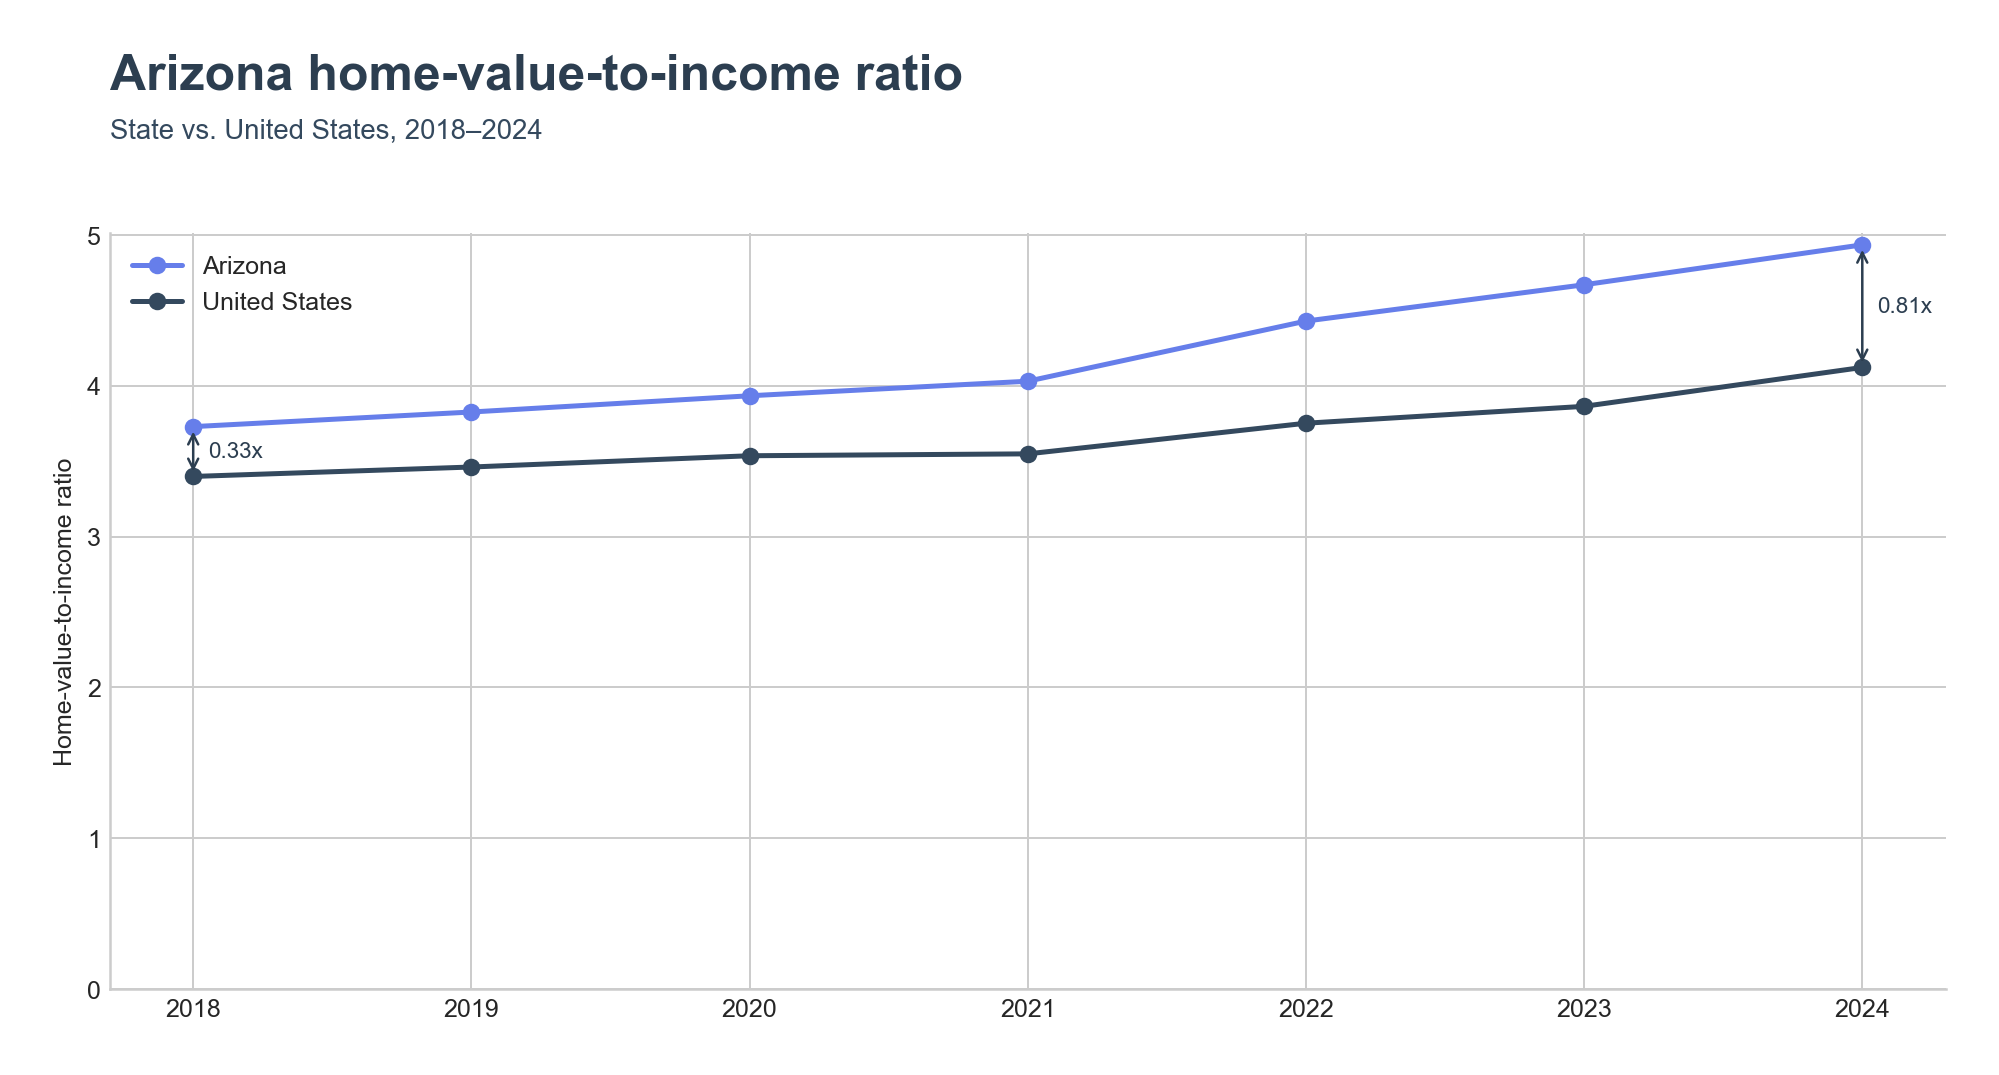
Arizona pulled away from the U.S. after 2020 and never came back.
Arizona's statewide home-value-to-income ratio reached 4.93x in 2024, up from 3.73x in 2018. The United States moved from 3.40x to 4.12x over the same window. Arizona started 0.33x above the national ratio and ended 0.81x above — the gap roughly 2.5x wider. The state's +1.20x climb easily outran the national +0.72x, and the split happened in one move: the two lines tracked together through 2021, then Arizona separated sharply between 2021 and 2022.
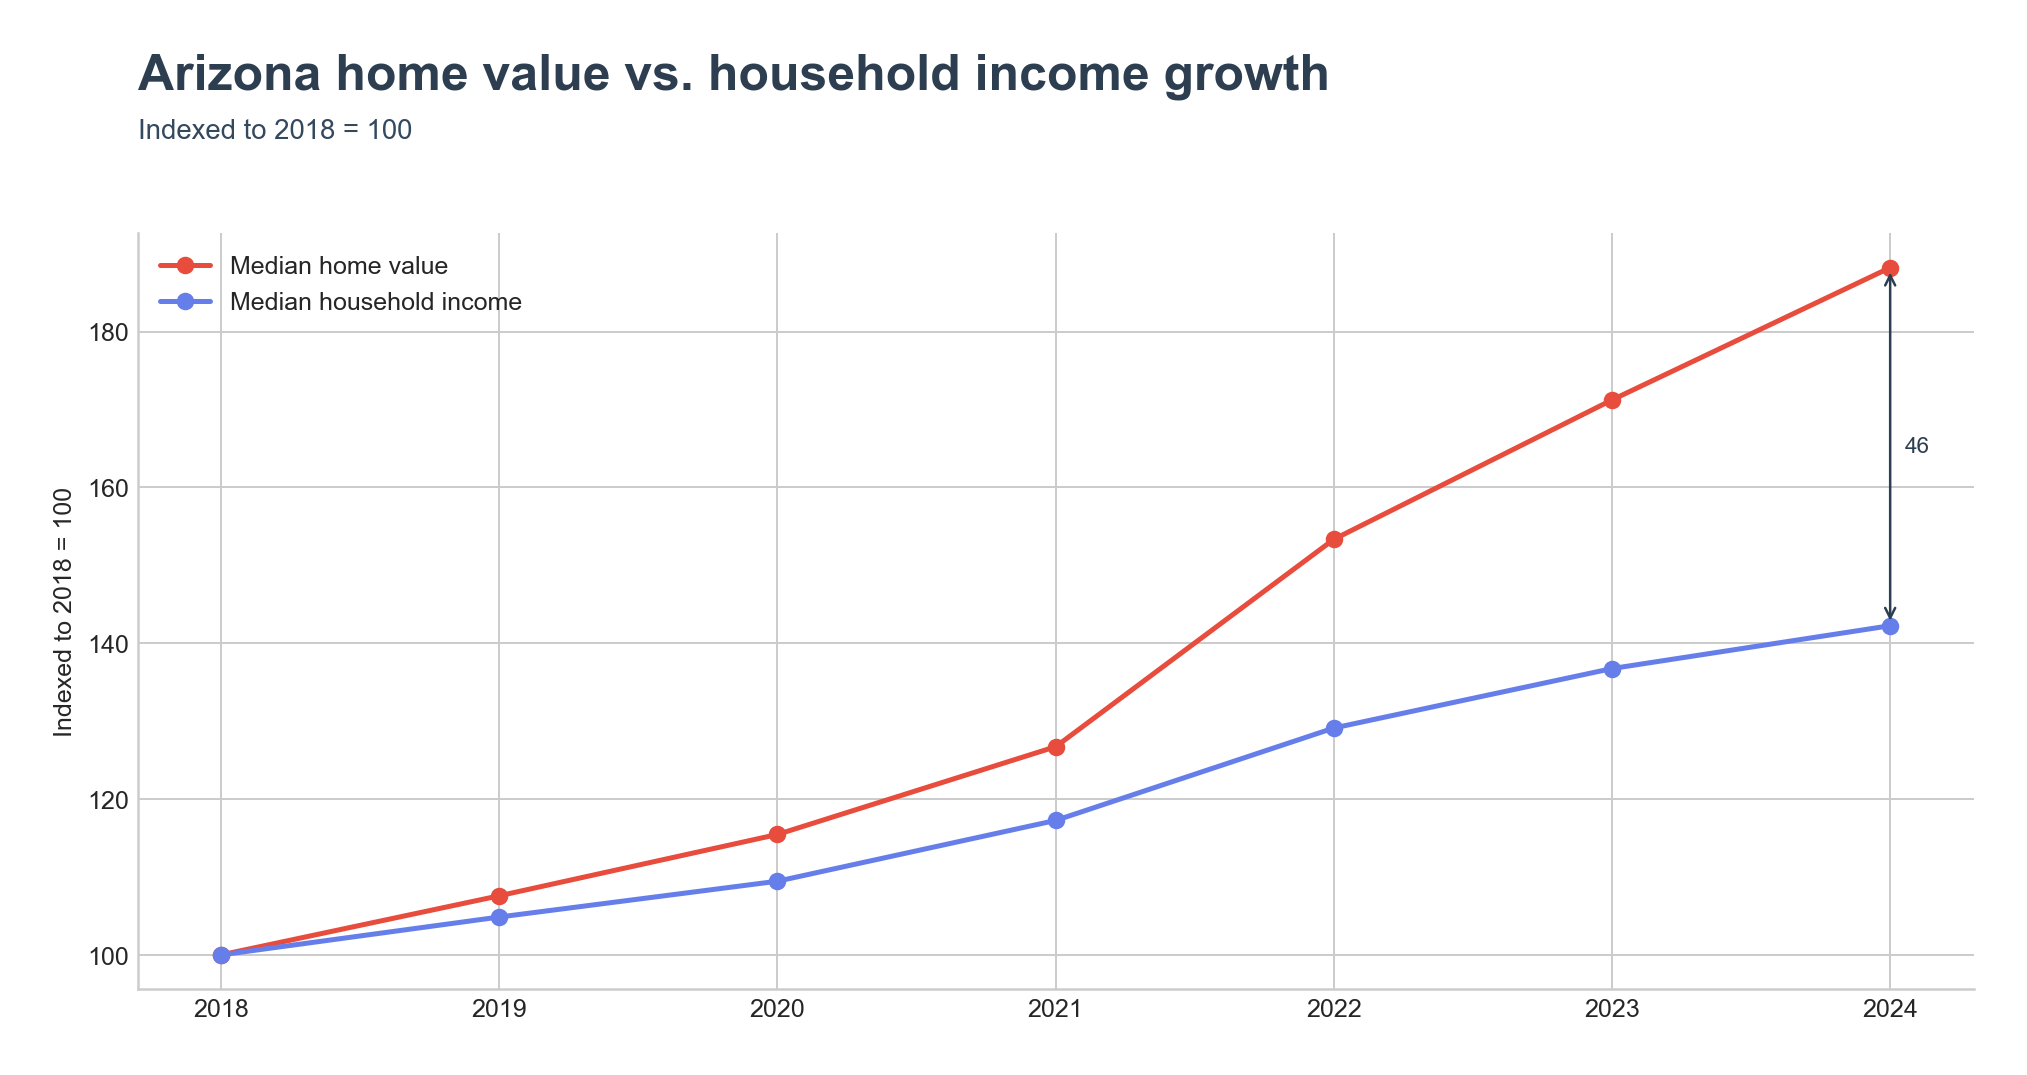
Home values rose 88% while incomes rose 42%.
Indexed to 2018 = 100, Arizona's median home value reached 188 by 2024 while median household income reached 142 — a 46-point gap. The typical Arizona home went from $209,600 to $394,500 (an +88% move) while median household income rose from $56,213 to $79,964 (a +42% move). The two series tracked each other through 2020 and split decisively from 2021 onward.
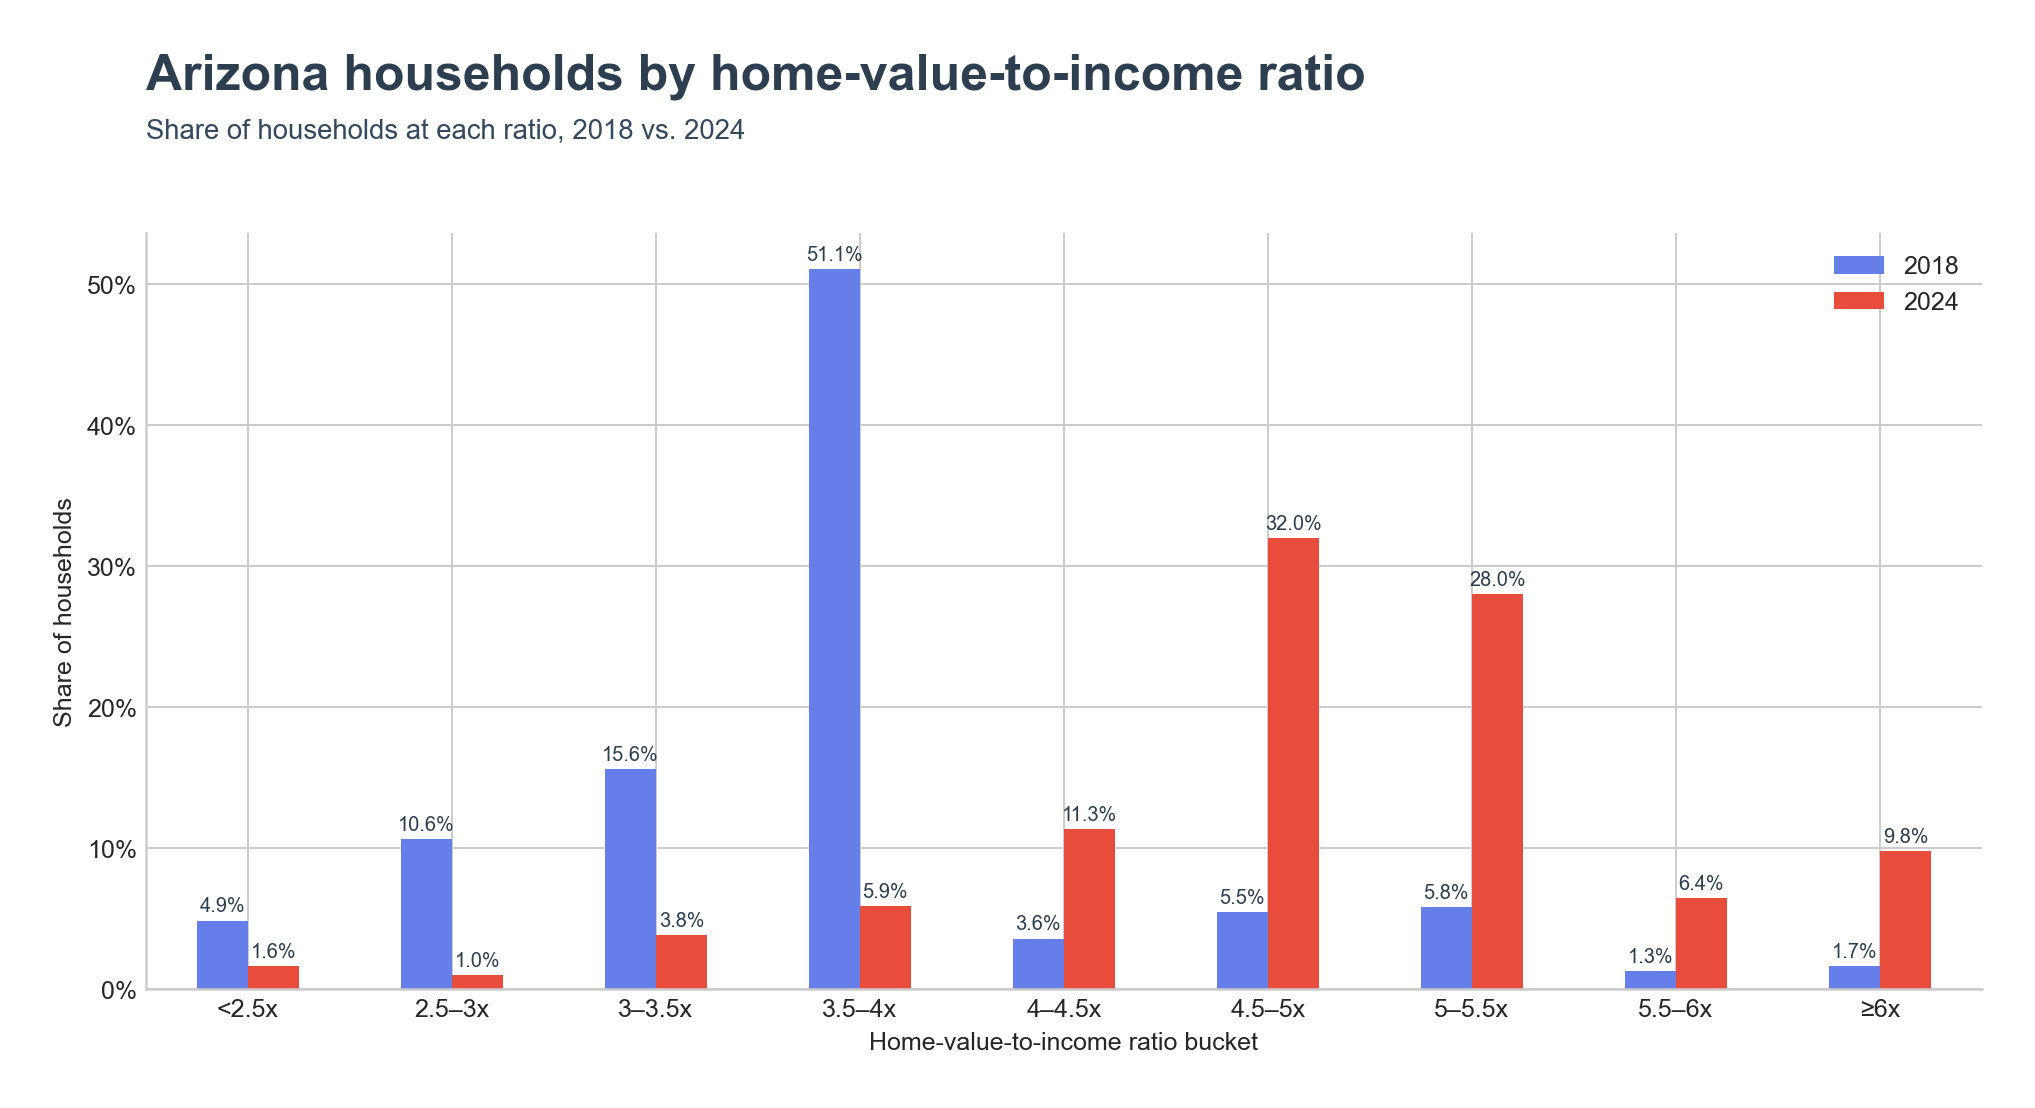
The Arizona middle moved up two full ratio steps.
In 2018, 17.9% of Arizona households lived in places at 4x or higher. By 2024 that share was 87.5%. The whole distribution shifted right by two buckets — the 2018 modal pillar at 3.5–4x collapsed from 51.1% to 5.9%, and 4.5–5x is now the modal bucket at 32.0%, with another 28.0% sitting in 5–5.5x. The ≥6x bucket grew from 1.7% to 9.8%.
High ratios concentrate in the Verde Valley and Phoenix; low ratios sit on the Navajo Nation, Greenlee, and the lower Colorado.
The county map splits along elevation and tribal land. Coconino County tops the state at 6.14x — it contains Flagstaff , Northern Arizona University , and the South Rim of Grand Canyon National Park , where recreational and second-home demand sits against student-heavy reported incomes. Yavapai County sits right behind at 6.11x — home to Prescott and the Yavapai-side portion of Sedona , it is one of Arizona's main retirement destinations. Maricopa County (Phoenix) at 5.07x, Mohave County at 4.87x — anchored by Lake Havasu City and Bullhead City snowbird markets — and Pima County (Tucson) at 4.55x round out the top five.
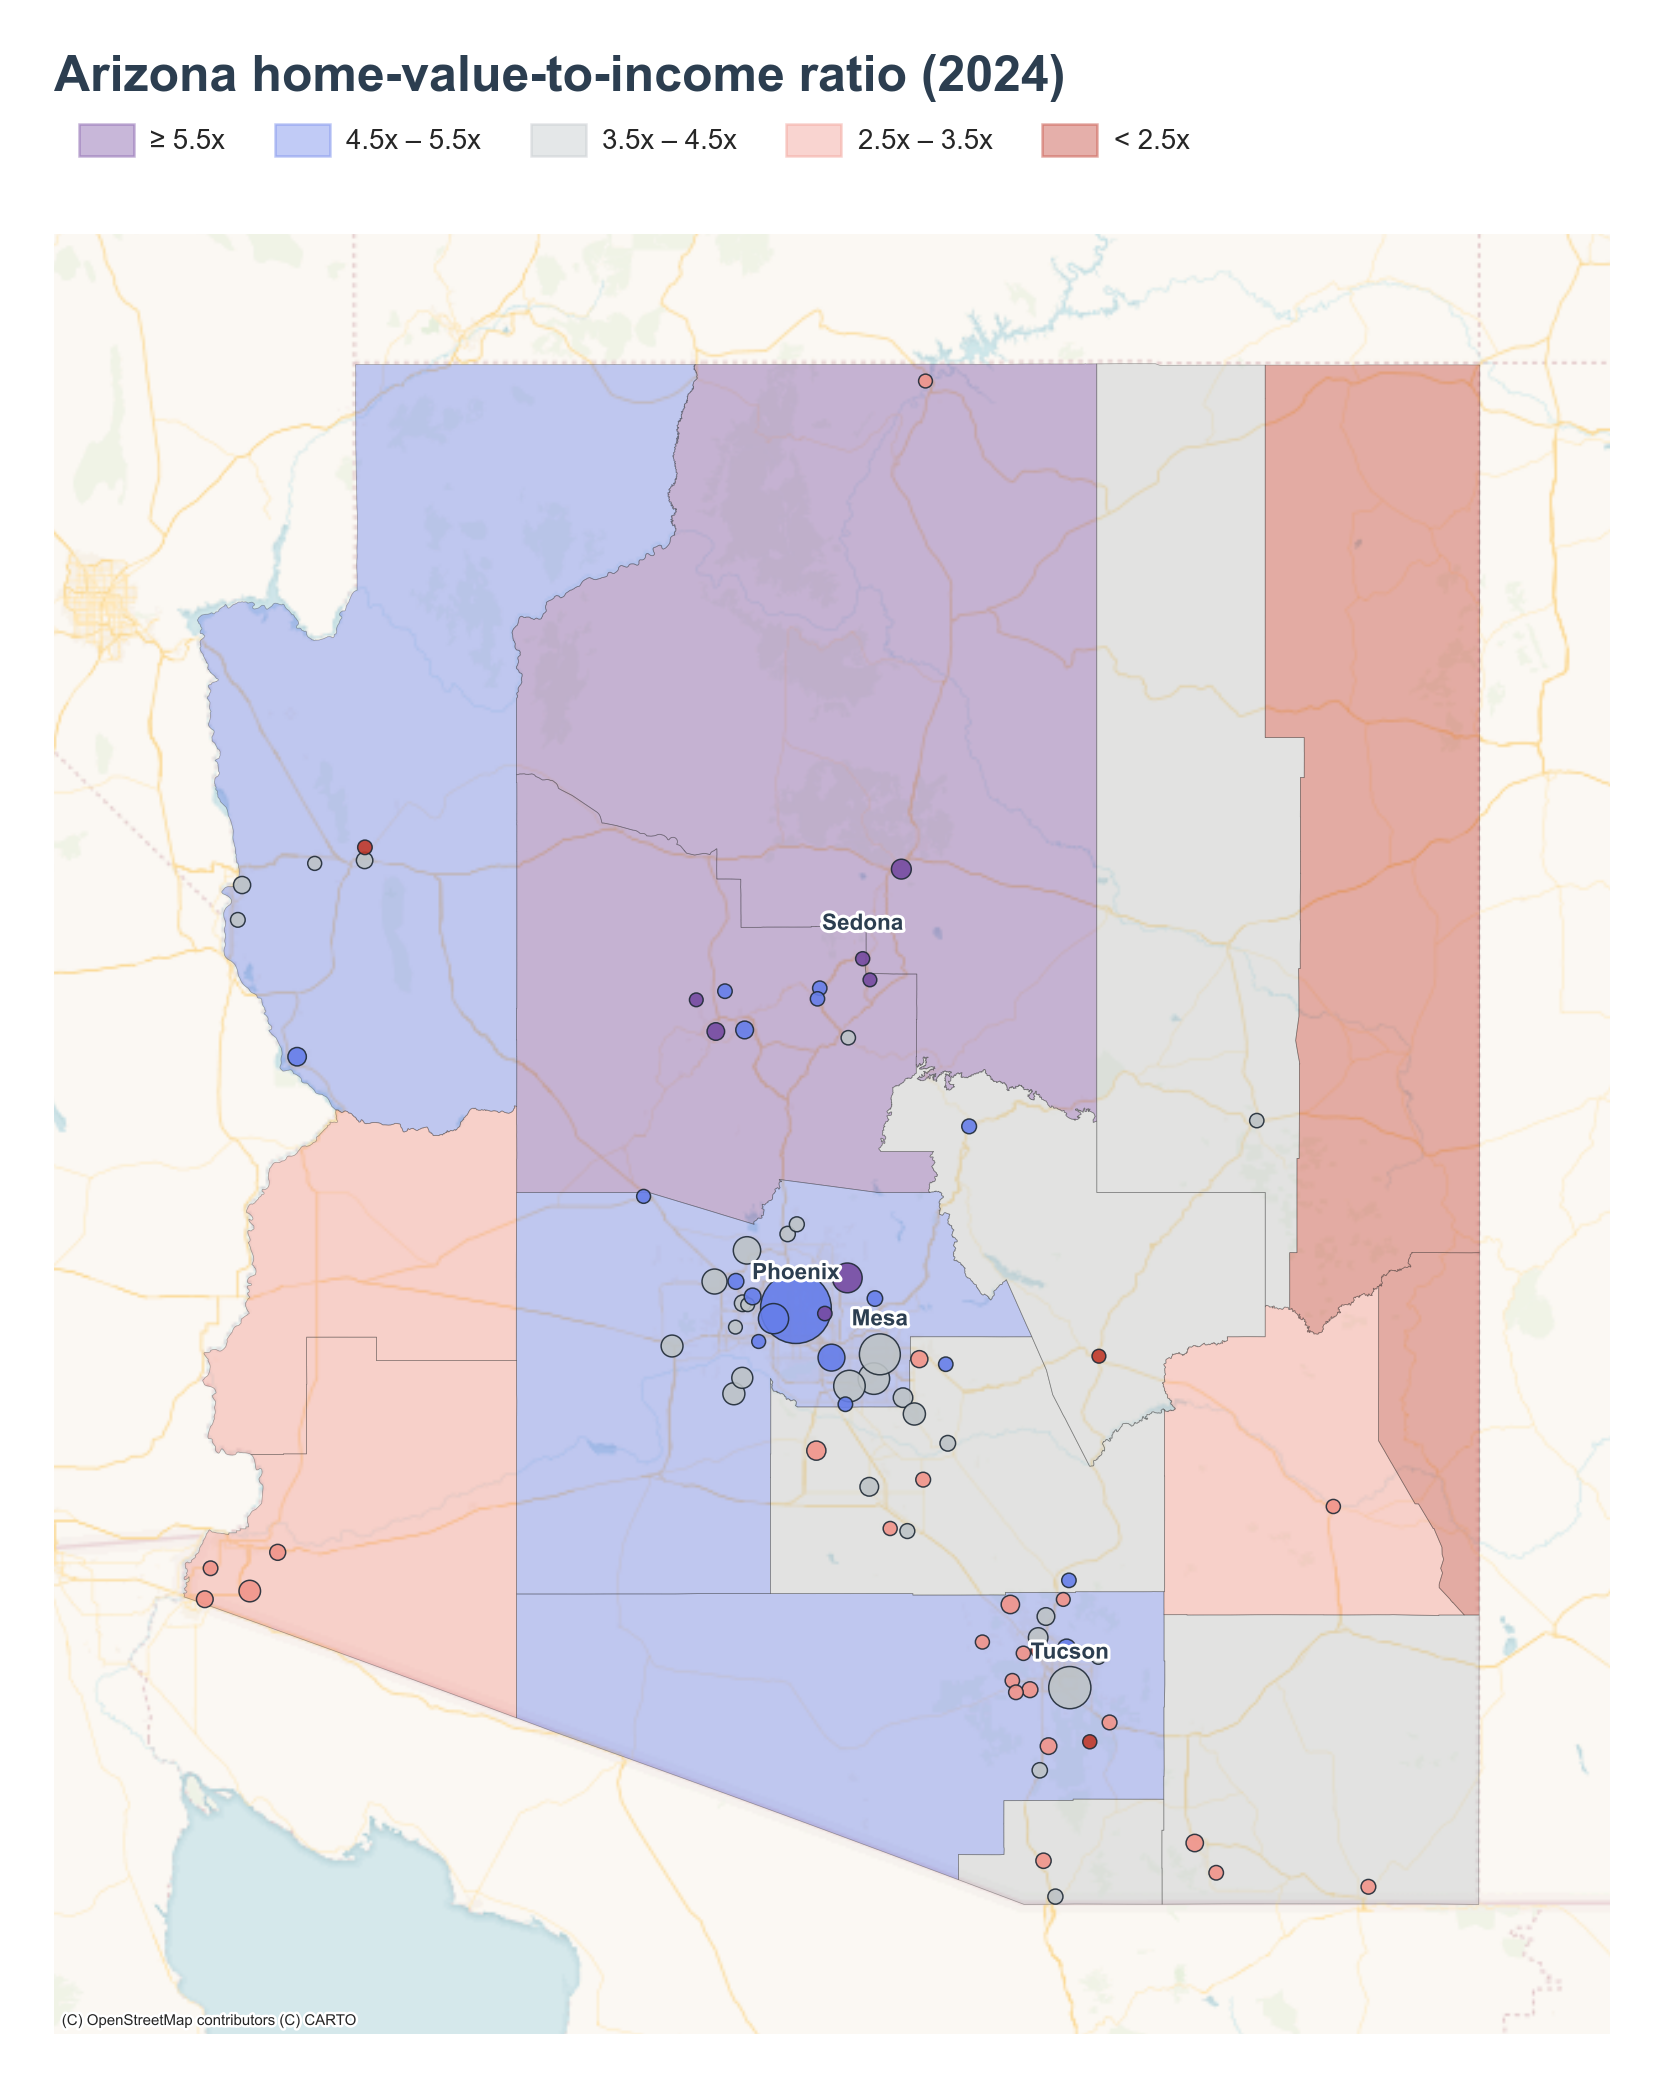
The bottom of the county distribution is tribal and rural-border geography. Apache County at 1.54x is roughly two-thirds Navajo Nation land, where on-reservation home values stay low alongside very low reported household incomes. Greenlee County at 2.23x is anchored by the Morenci copper mine , where mining wages prop incomes up against modest housing stock. La Paz County at 2.74x and Yuma County at 3.46x are lower-Colorado agricultural counties, and Graham County at 3.15x is the Safford mining-and-farming basin in the southeast.
Place rankings are Verde Valley amenity towns plus Paradise Valley on top, Tucson-edge and small-town communities on the bottom.
Sedona leads the state at 10.67x — its red-rock setting, Coconino National Forest surroundings, and second-home demand drive a median home value of $786,800 against a local median household income of $73,738. Village of Oak Creek (Big Park) at 9.16x is the community immediately south of Sedona and shares the same amenity premium. Williamson at 8.19x is a community just west of Prescott in Yavapai County. Paradise Valley at 8.09x is the small affluent municipality between Phoenix and Scottsdale, long Arizona's wealthiest incorporated town, where a median home value above $2,000,000 still outpaces its $247,159 median household income. Prescott at 7.96x is the Yavapai County seat and a mile-high retirement destination. The top five cluster into two patterns: the Verde Valley/Prescott amenity-and-retirement belt in north-central Arizona (Sedona, Village of Oak Creek, Williamson, Prescott) and Phoenix-area wealth (Paradise Valley).
The bottom five are spread across small communities outside the major metros. Flowing Wells at 1.03x is a Tucson-adjacent community — a near-1.0x ratio means median home value ($41,100) sits roughly at median household income ($39,774), an unusually low result that reflects an older mobile-home–heavy housing stock. Corona de Tucson at 2.89x sits southeast of Tucson, where a high median household income of $132,568 pulls the ratio down against a $382,700 median home value. New Kingman-Butler at 2.90x is a community on the outskirts of Kingman . Globe at 2.99x is a copper-mining town east of Phoenix in Gila County , and Safford at 3.04x is the Graham County seat where mining and farming incomes hold up against modest home values.
Key Takeaways
- Arizona's home-value-to-income ratio reached 4.93x in 2024, 0.81x above the U.S. 4.12x.
- The state rose +1.20x since 2018, well past the national +0.72x, and the divergence happened almost entirely between 2021 and 2022.
- Median home value grew 88% ($209,600 → $394,500) while median household income grew 42% ($56,213 → $79,964).
- The share of Arizonans living in places at 4x or higher went from 17.9% in 2018 to 87.5% in 2024; the 3.5–4x modal pillar collapsed from 51.1% to 5.9%, with 4.5–5x now the modal bucket at 32.0%.
- High ratios are the Verde Valley/Prescott amenity belt (Sedona, Village of Oak Creek, Williamson, Prescott) and Paradise Valley, plus retirement/recreation counties (Coconino, Yavapai, Mohave); low ratios are the Navajo Nation in Apache County, copper-and-agriculture counties (Greenlee, La Paz, Graham, Yuma), and small communities around Tucson, Kingman, Globe, and Safford.