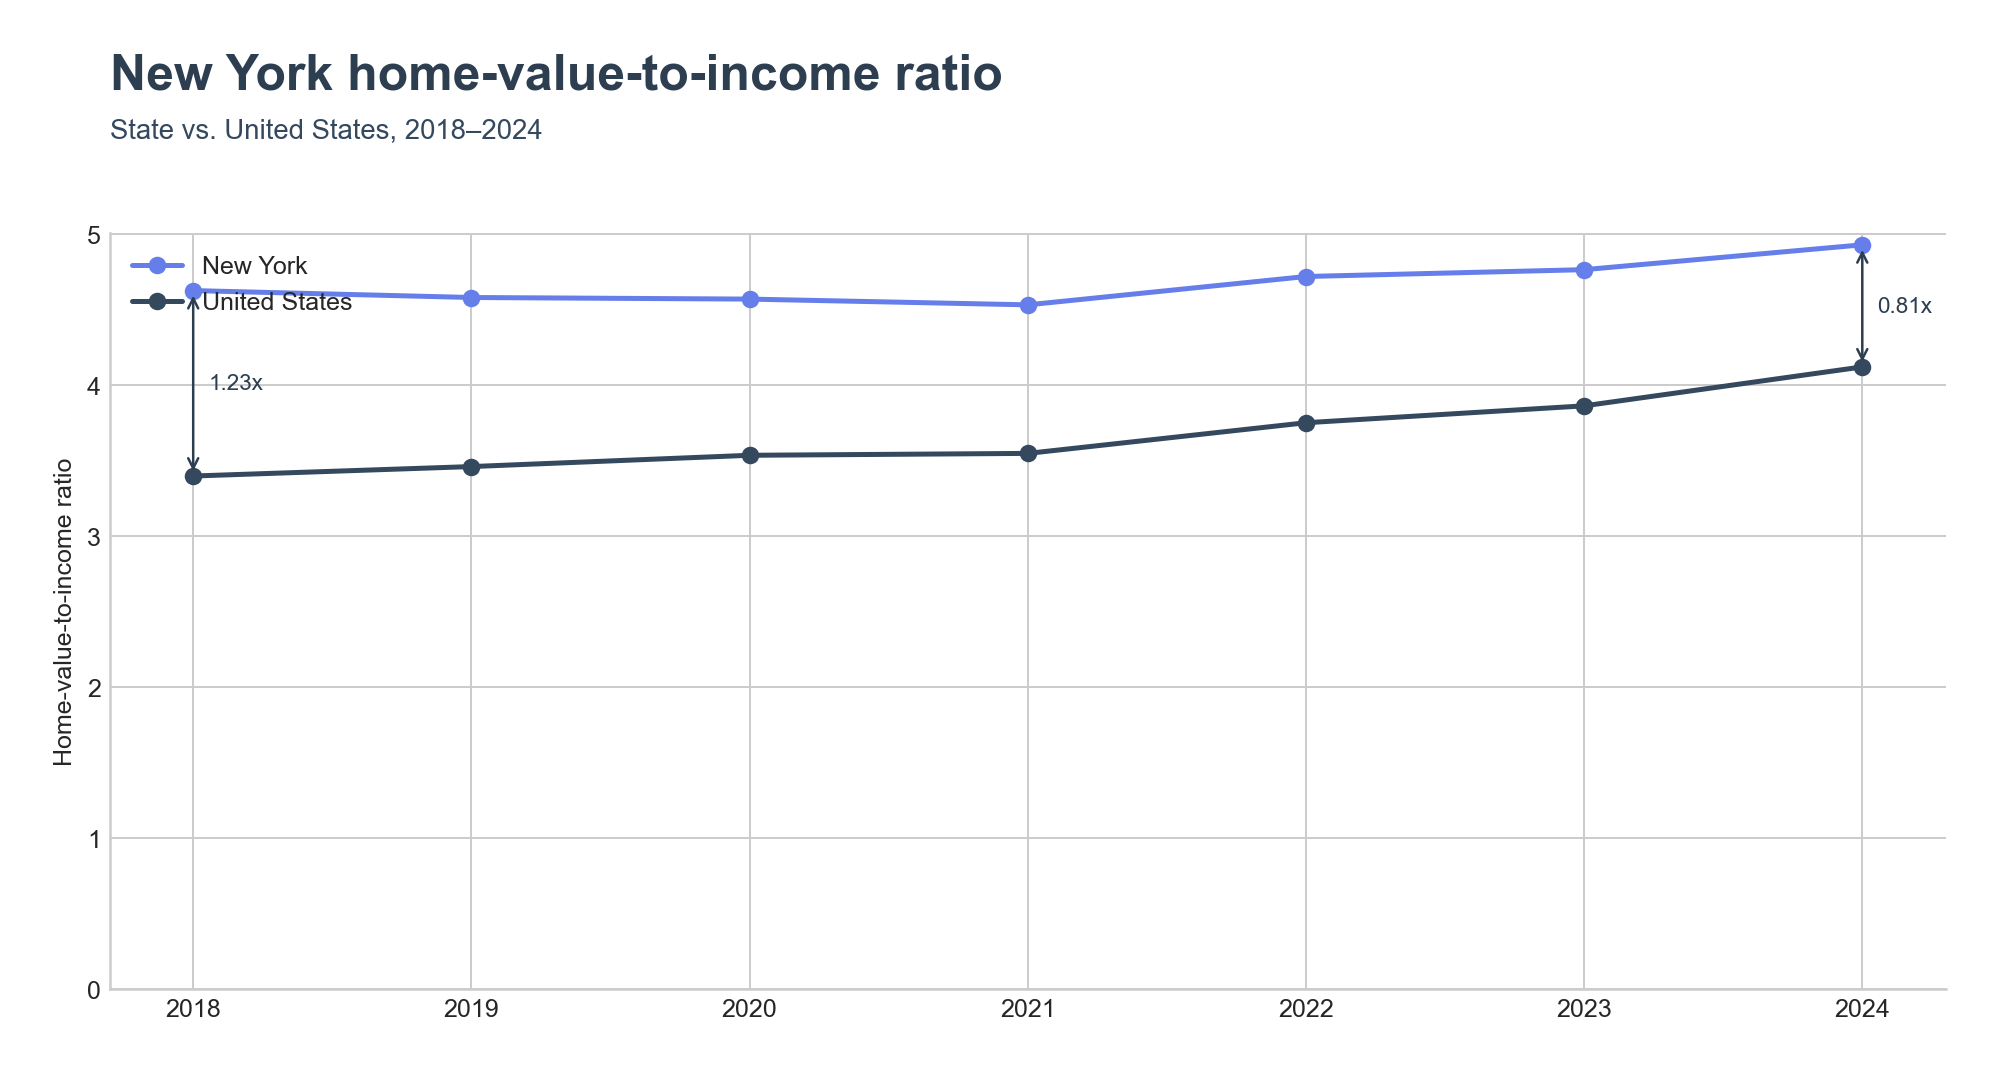
New York stays above the U.S., but the gap is closing.
New York's statewide home-value-to-income ratio reached 4.93x in 2024, up from 4.63x in 2018. The United States moved from 3.40x to 4.12x over the same window. New York started 1.23x above the national ratio and ended only 0.81x above — not because the state improved, but because the country deteriorated faster. New York's ratio climbed +0.30x over six years while the U.S. climbed +0.72x, more than twice as fast. The national line is catching up to a level New York reached years ago.
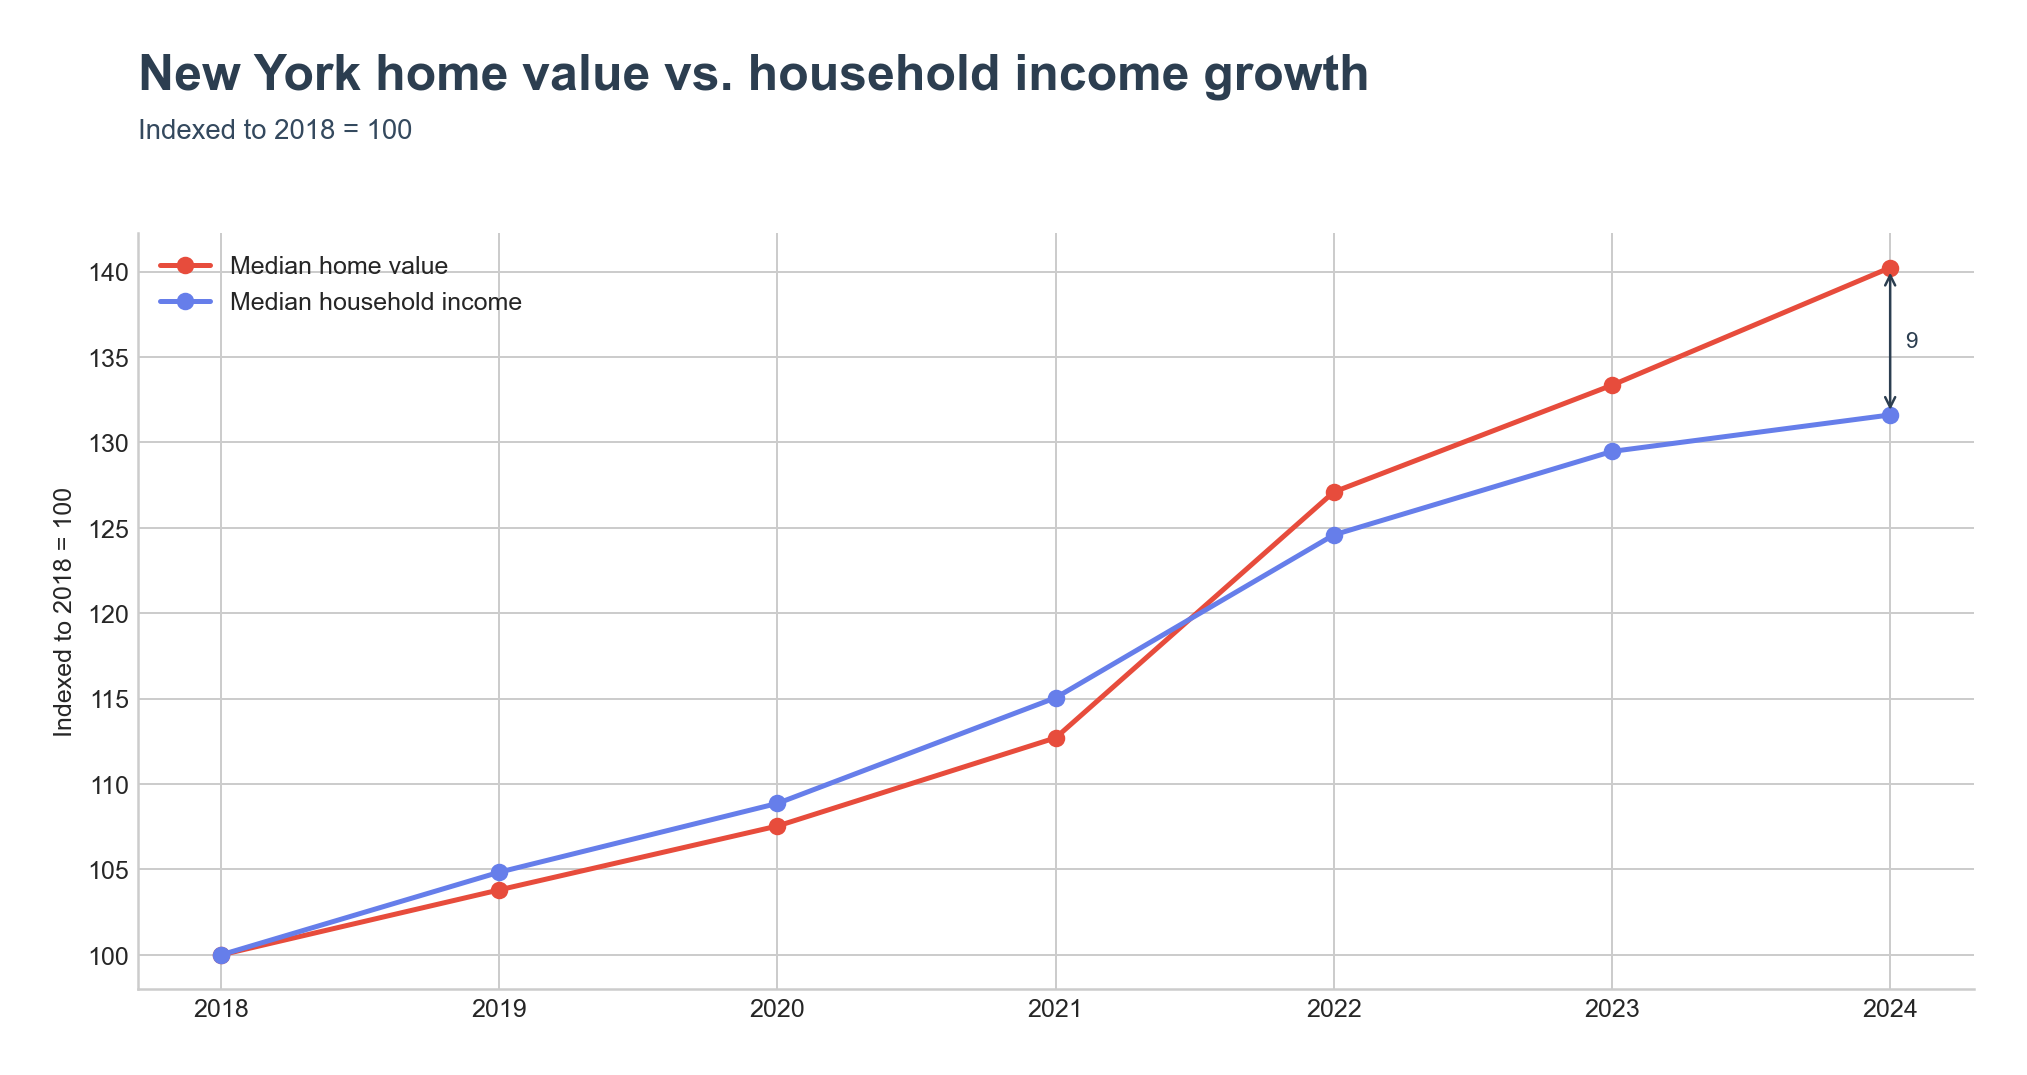
Home values pulled ahead of incomes after 2021.
New York's median home value rose from $302,200 in 2018 to $423,800 in 2024, while median household income rose from $65,323 to $85,974. Indexed so 2018 equals 100, the two lines tracked each other through 2021, then split: home values accelerated while income growth flattened, leaving a clear gap by 2024. The widening after 2021 is what pushed the statewide ratio to its highest point in the series.
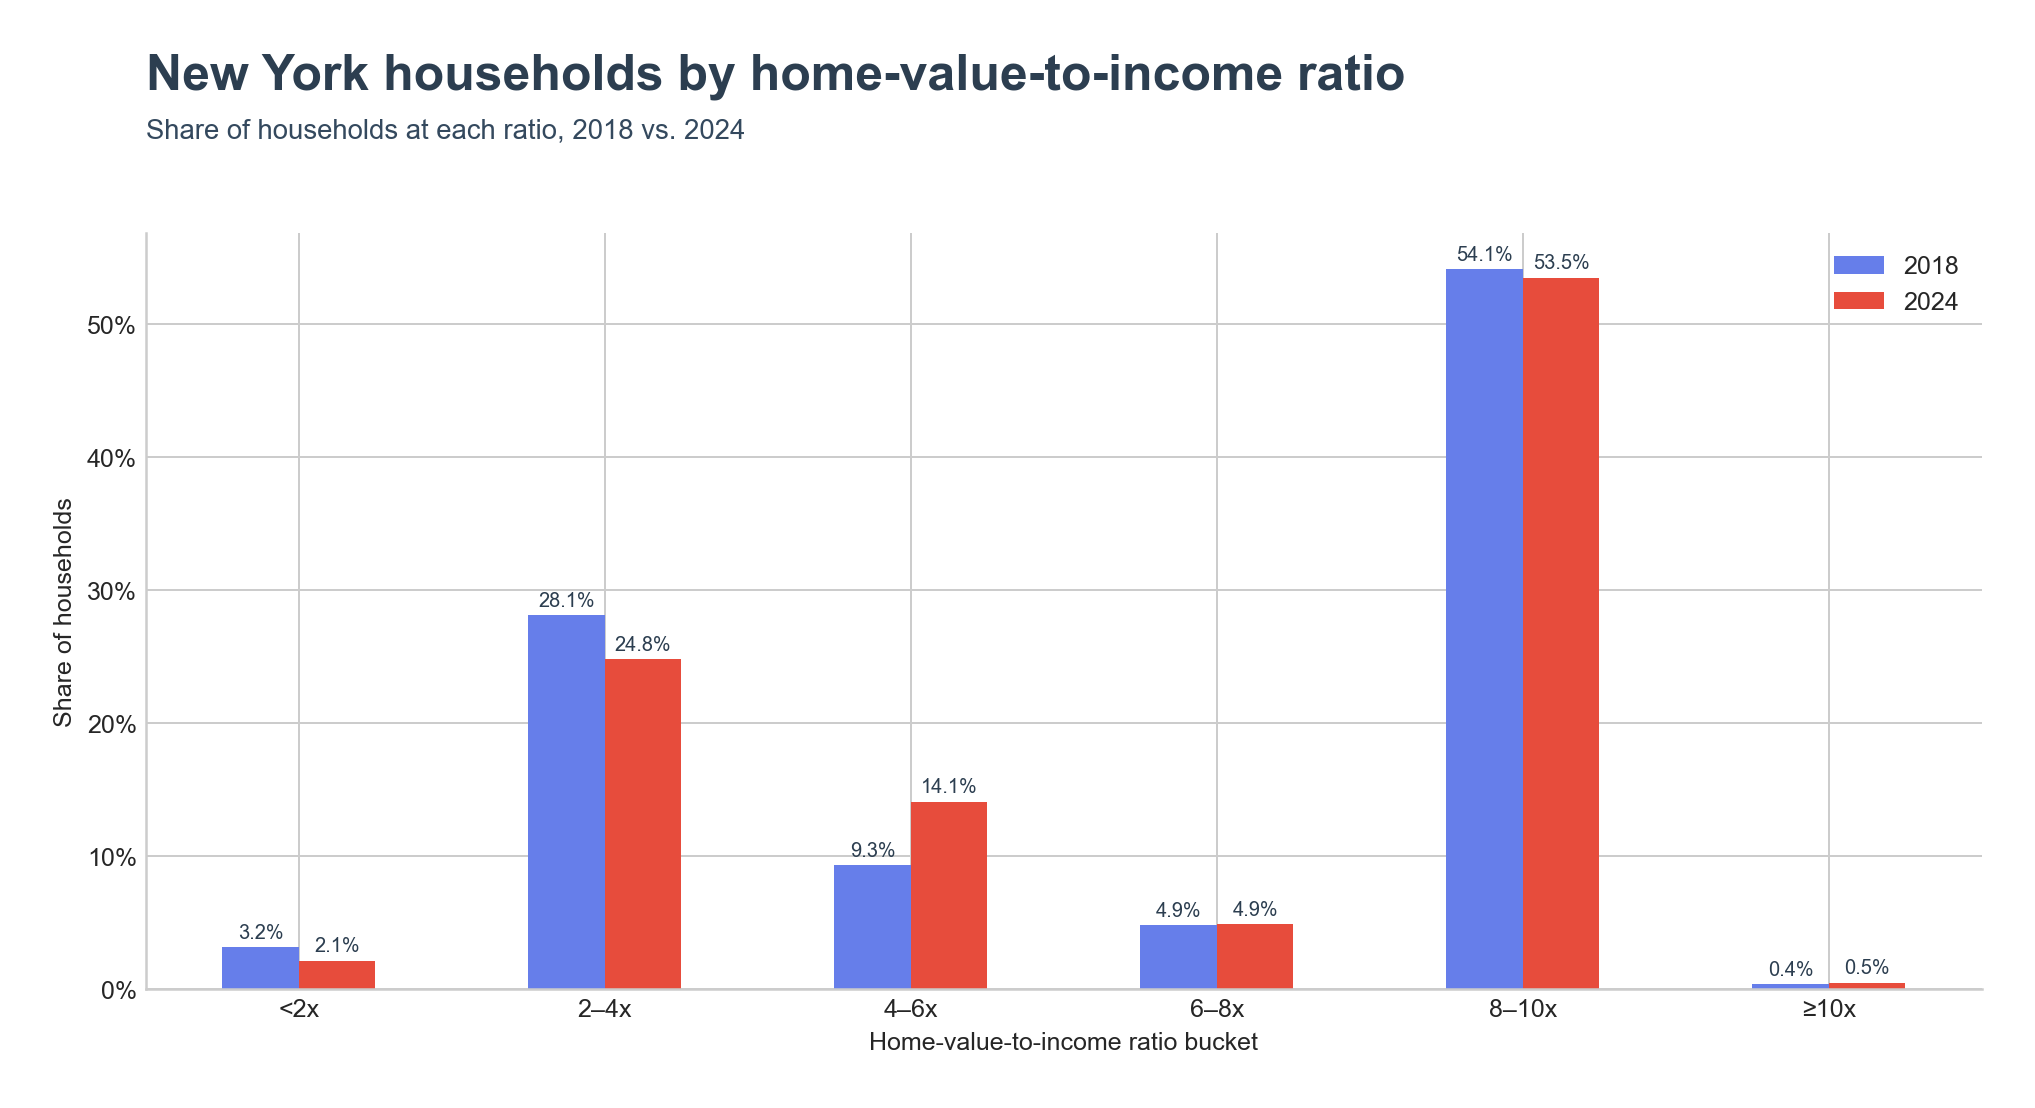
More than half of New Yorkers live in places at 8x or higher.
The distribution is unusually top-heavy. In 2024, 53.5% of New York households lived in places at the 8–10x ratio — a share driven by New York City's enormous household count sitting at high ratios. That share barely moved from 54.1% in 2018. The real movement happened underneath it: the 2–4x bucket fell from 28.1% to 24.8% and the <2x bucket fell from 3.2% to 2.1%, while the 4–6x bucket grew from 9.3% to 14.1%. Households drained out of the cheapest ranges and into the middle.
High ratios concentrate downstate; the entire upstate runs low.
The county map splits cleanly. Every one of New York City's five boroughs leads the state. Kings County (Brooklyn) tops it at 11.28x on a $905,000 median home value against an $80,263 median household income, with Bronx County right behind at 10.88x. The Bronx reaches that level differently — a moderate $529,500 median home value sitting on the state's lowest borough income of $48,676. New York County (Manhattan) at 10.49x is the inverse: a $1,090,500 median home value carried by a six-figure $103,931 income. Queens County at 8.40x and Richmond County (Staten Island) at 6.87x complete the top five.
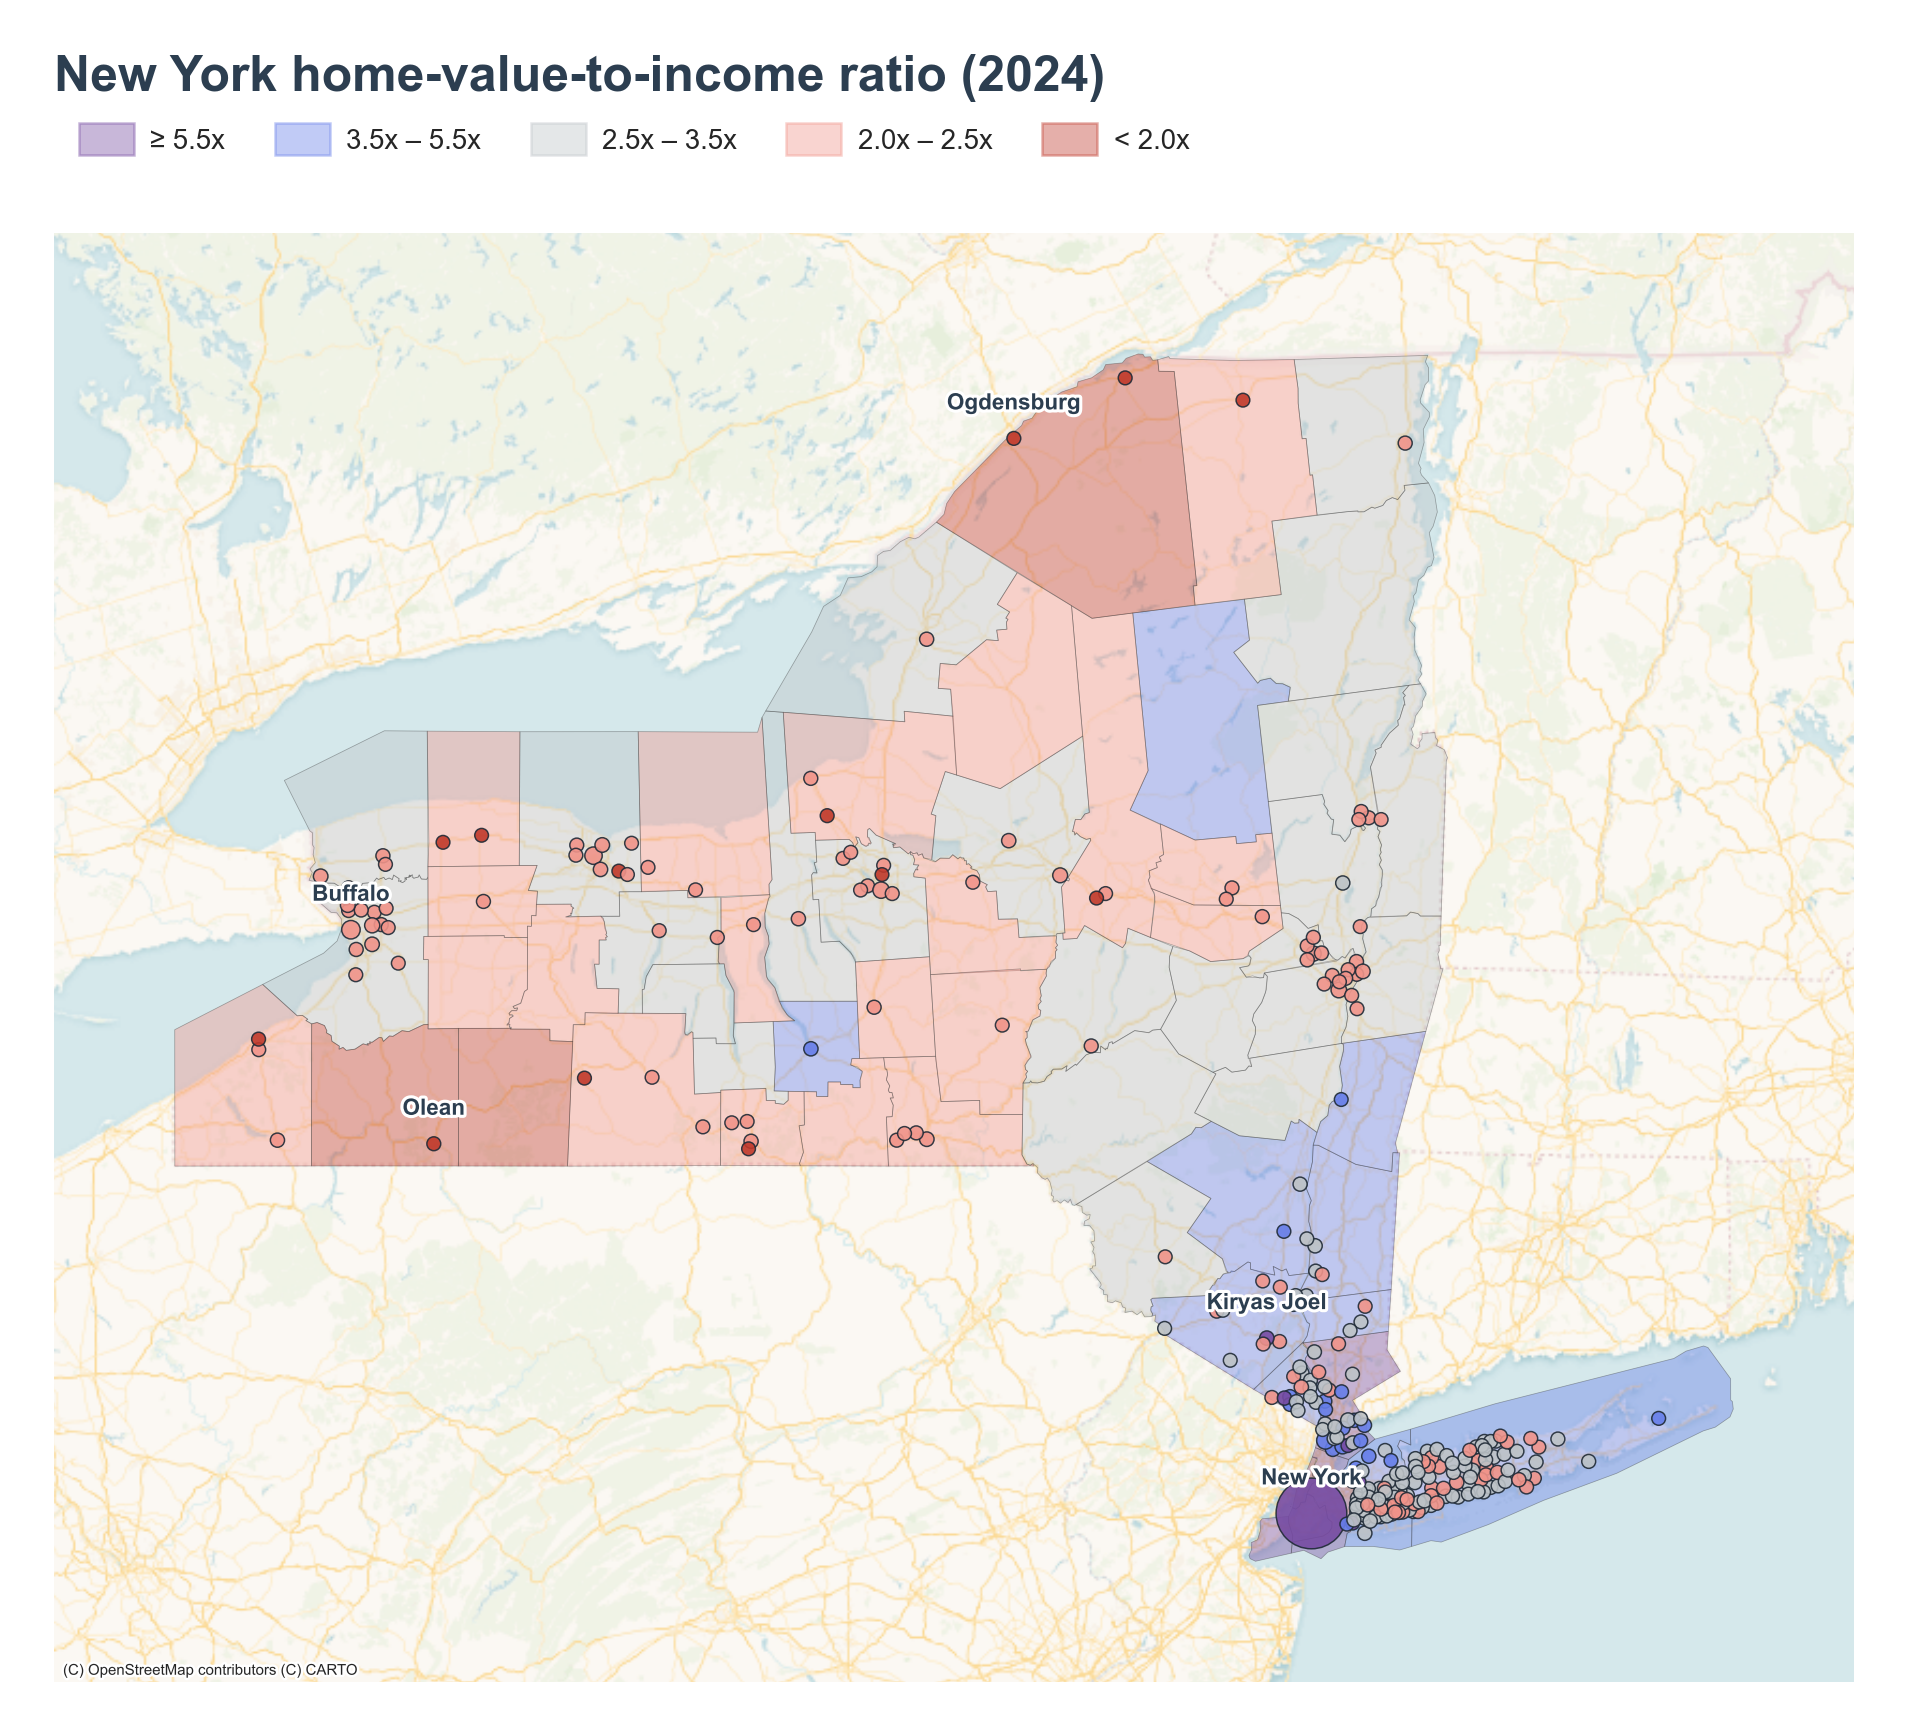
The bottom of the county distribution is the western counties, the Southern Tier, and the North Country. Allegany County sits lowest at 1.62x, followed by Cattaraugus County at 1.90x — both in the state's southwestern corner near the Pennsylvania line. St. Lawrence County at 1.94x anchors the North Country along the Canadian border, while Steuben County at 2.09x and Orleans County at 2.13x round out the bottom five across the Southern Tier and the Lake Ontario plain.
Place ratios run from Hasidic villages and Westchester wealth at the top to older industrial cities at the bottom.
The two highest places in the state are Hasidic communities where large, single-income households report low median income against substantial home values. Monsey leads at 19.34x — a $921,000 median home value on a $47,629 median household income in Rockland County's lower Hudson Valley, the largest center of Hasidic Judaism outside New York City. Kiryas Joel at 15.17x is the same pattern in Orange County, a Satmar village where roughly four in five households include children and most families subsist on a single salary. Larchmont at 9.76x is a different mechanism entirely: a wealthy Westchester commuter suburb where a $1,635,500 median home value outpaces even a $167,536 median household income. The city of New York at 9.66x and Cedarhurst at 8.49x, one of Long Island's Five Towns in Nassau County, fill out the top five.
The bottom five are older upstate manufacturing cities where modest home values sit against steady working incomes. Ogdensburg sits lowest at 1.38x — an $85,400 median home value in the North Country border city on the St. Lawrence River, where the port and rail economy has substantially diminished and population has fallen since the 1970s. Olean at 1.68x sits in the Southern Tier, with Southport at 1.72x, Ilion at 1.73x, and Dunkirk at 1.78x completing a set of upstate cities whose housing stock never inflated the way the downstate market did.
Key Takeaways
- New York's home-value-to-income ratio reached 4.93x in 2024, 0.81x above the U.S. 4.12x.
- The state rose only +0.30x since 2018 while the U.S. rose +0.72x, narrowing a gap that stood at 1.23x in 2018.
- Median home value grew from $302,200 to $423,800 while median household income grew from $65,323 to $85,974, with the two splitting after 2021.
- 53.5% of New York households live in places at the 8–10x ratio, while the cheapest buckets shrank and the 4–6x share rose from 9.3% to 14.1%.
- High ratios concentrate downstate — all five New York City boroughs lead, topped by Brooklyn at 11.28x — alongside extreme place ratios in Hasidic villages (Monsey 19.34x, Kiryas Joel 15.17x) and Westchester wealth (Larchmont 9.76x).
- Low ratios cover the entire upstate, from the southwestern and Southern Tier counties (Allegany 1.62x, Cattaraugus 1.90x) to the North Country (St. Lawrence 1.94x), with the lowest place ratios in older manufacturing cities (Ogdensburg 1.38x, Olean 1.68x).