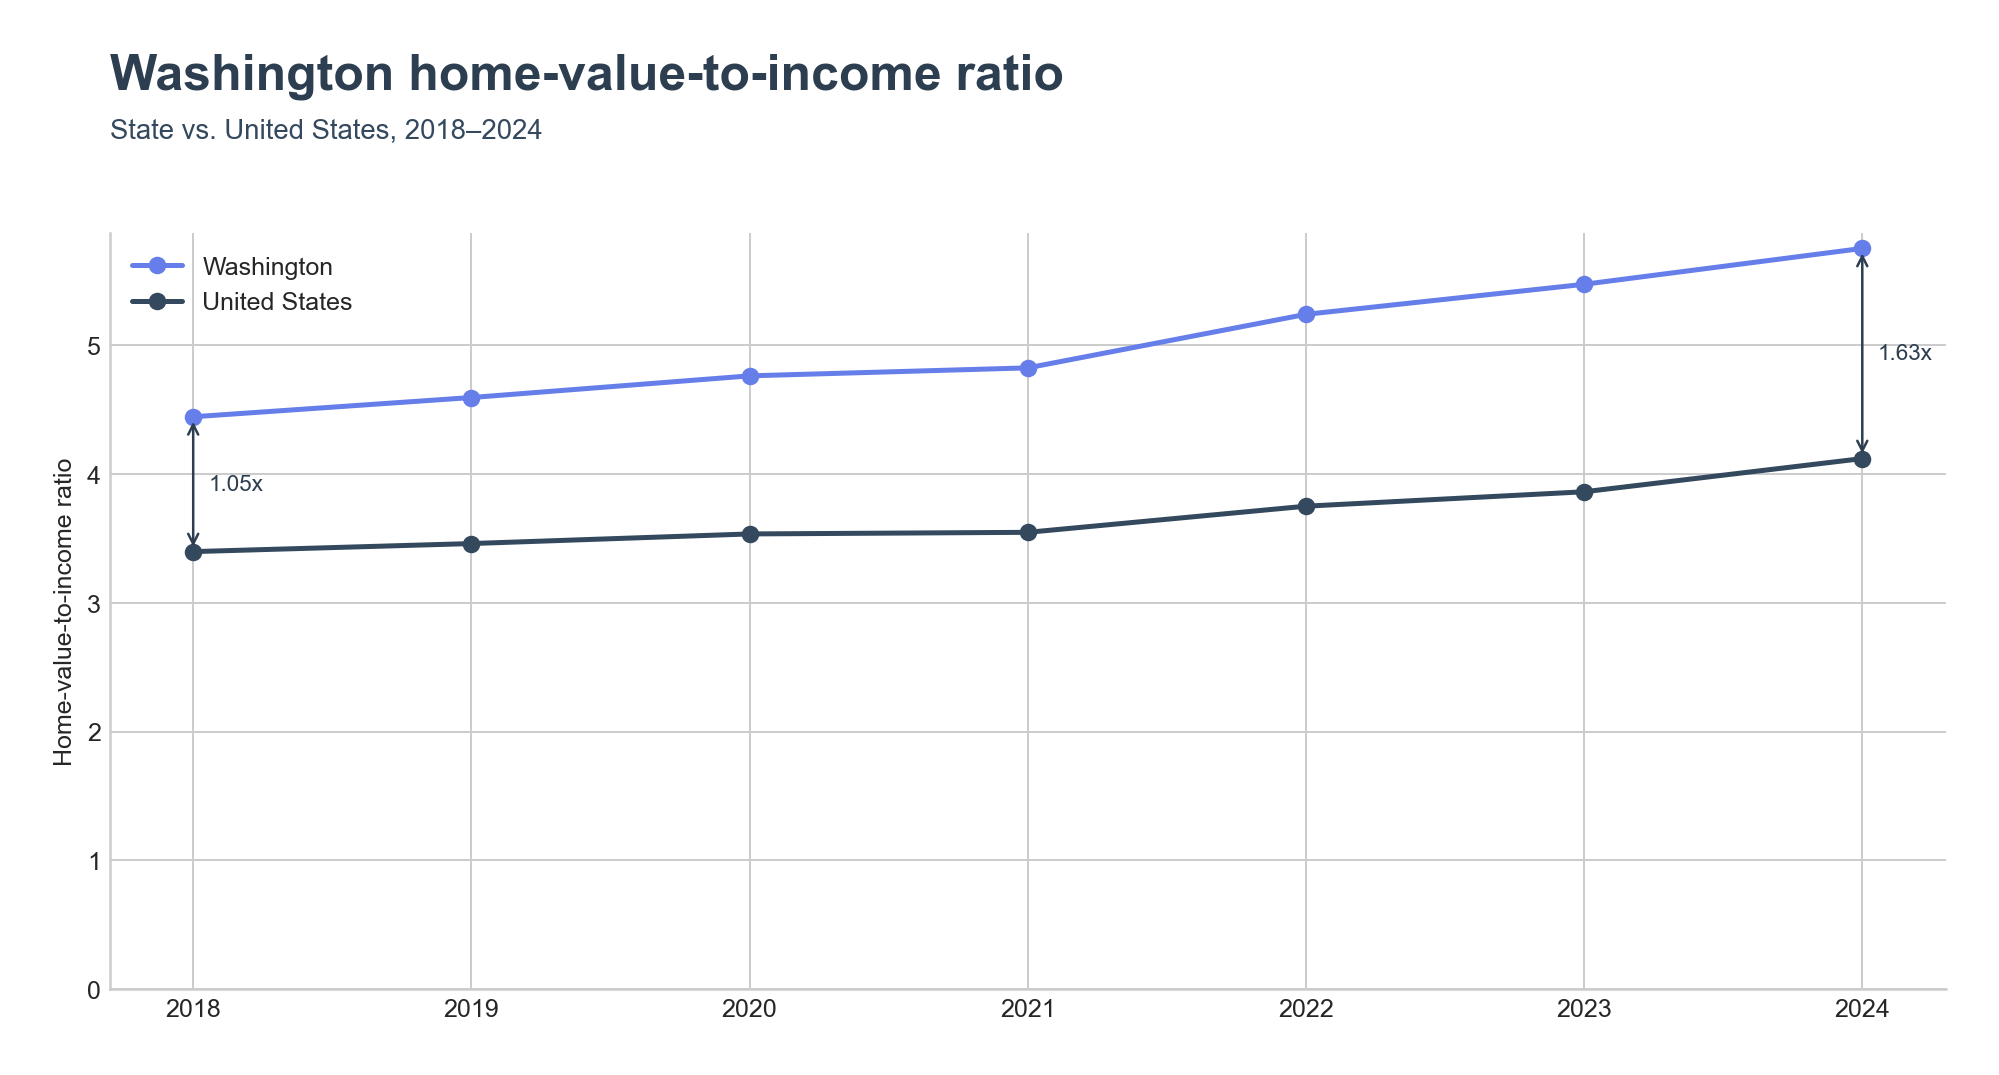
Washington's statewide home-value-to-income ratio reached 5.75x in 2024, up from 4.45x in 2018. The United States moved from 3.40x to 4.12x over the same window. Washington sat 1.05x above the national ratio in 2018 and ends the period 1.63x above it — a divergence, not a convergence.
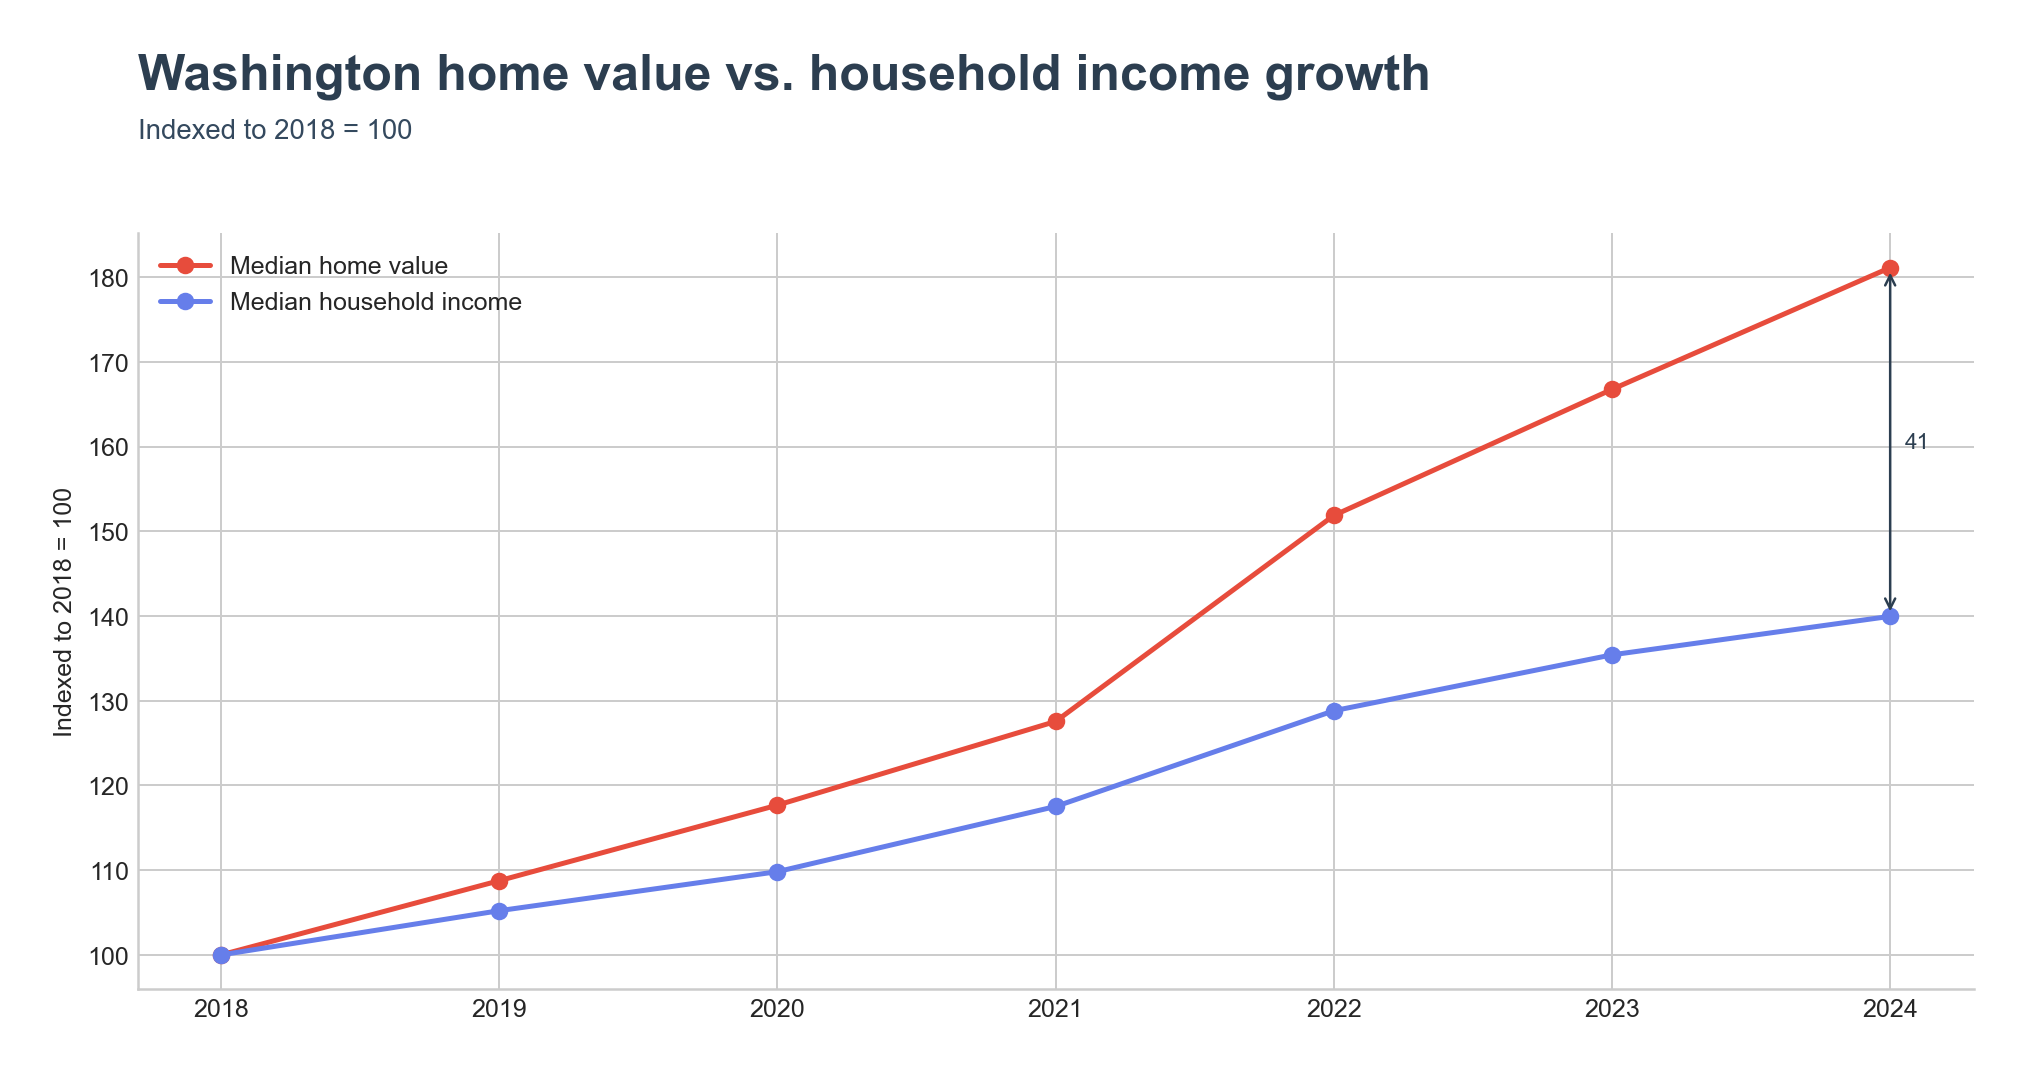
Indexed to 2018 = 100, Washington's median home value reached 181 by 2024 while median household income reached 140 — a 41-point gap. The typical Washington home went from $311,700 to $564,600 while median household income rose from $70,116 to $98,141. The two series tracked each other through 2020 and split decisively after 2021.
Where the ratio is highest
The county map splits the state cleanly west-vs-east. San Juan County tops the state at 9.42x — an island county in the Salish Sea where the median home value is $799,200 against a median household income of $84,800, the ratio reflecting demand from remote workers and second-home buyers on the islands. Jefferson County at 7.23x and Whatcom County at 7.16x follow the same northwestern-coast pattern. King County , the state's economic core, comes in at 6.89x despite the highest median household income among the top counties ($124,746) — because the median home reaches $859,900. Kittitas County at 6.74x is the lone interior county in the top group.
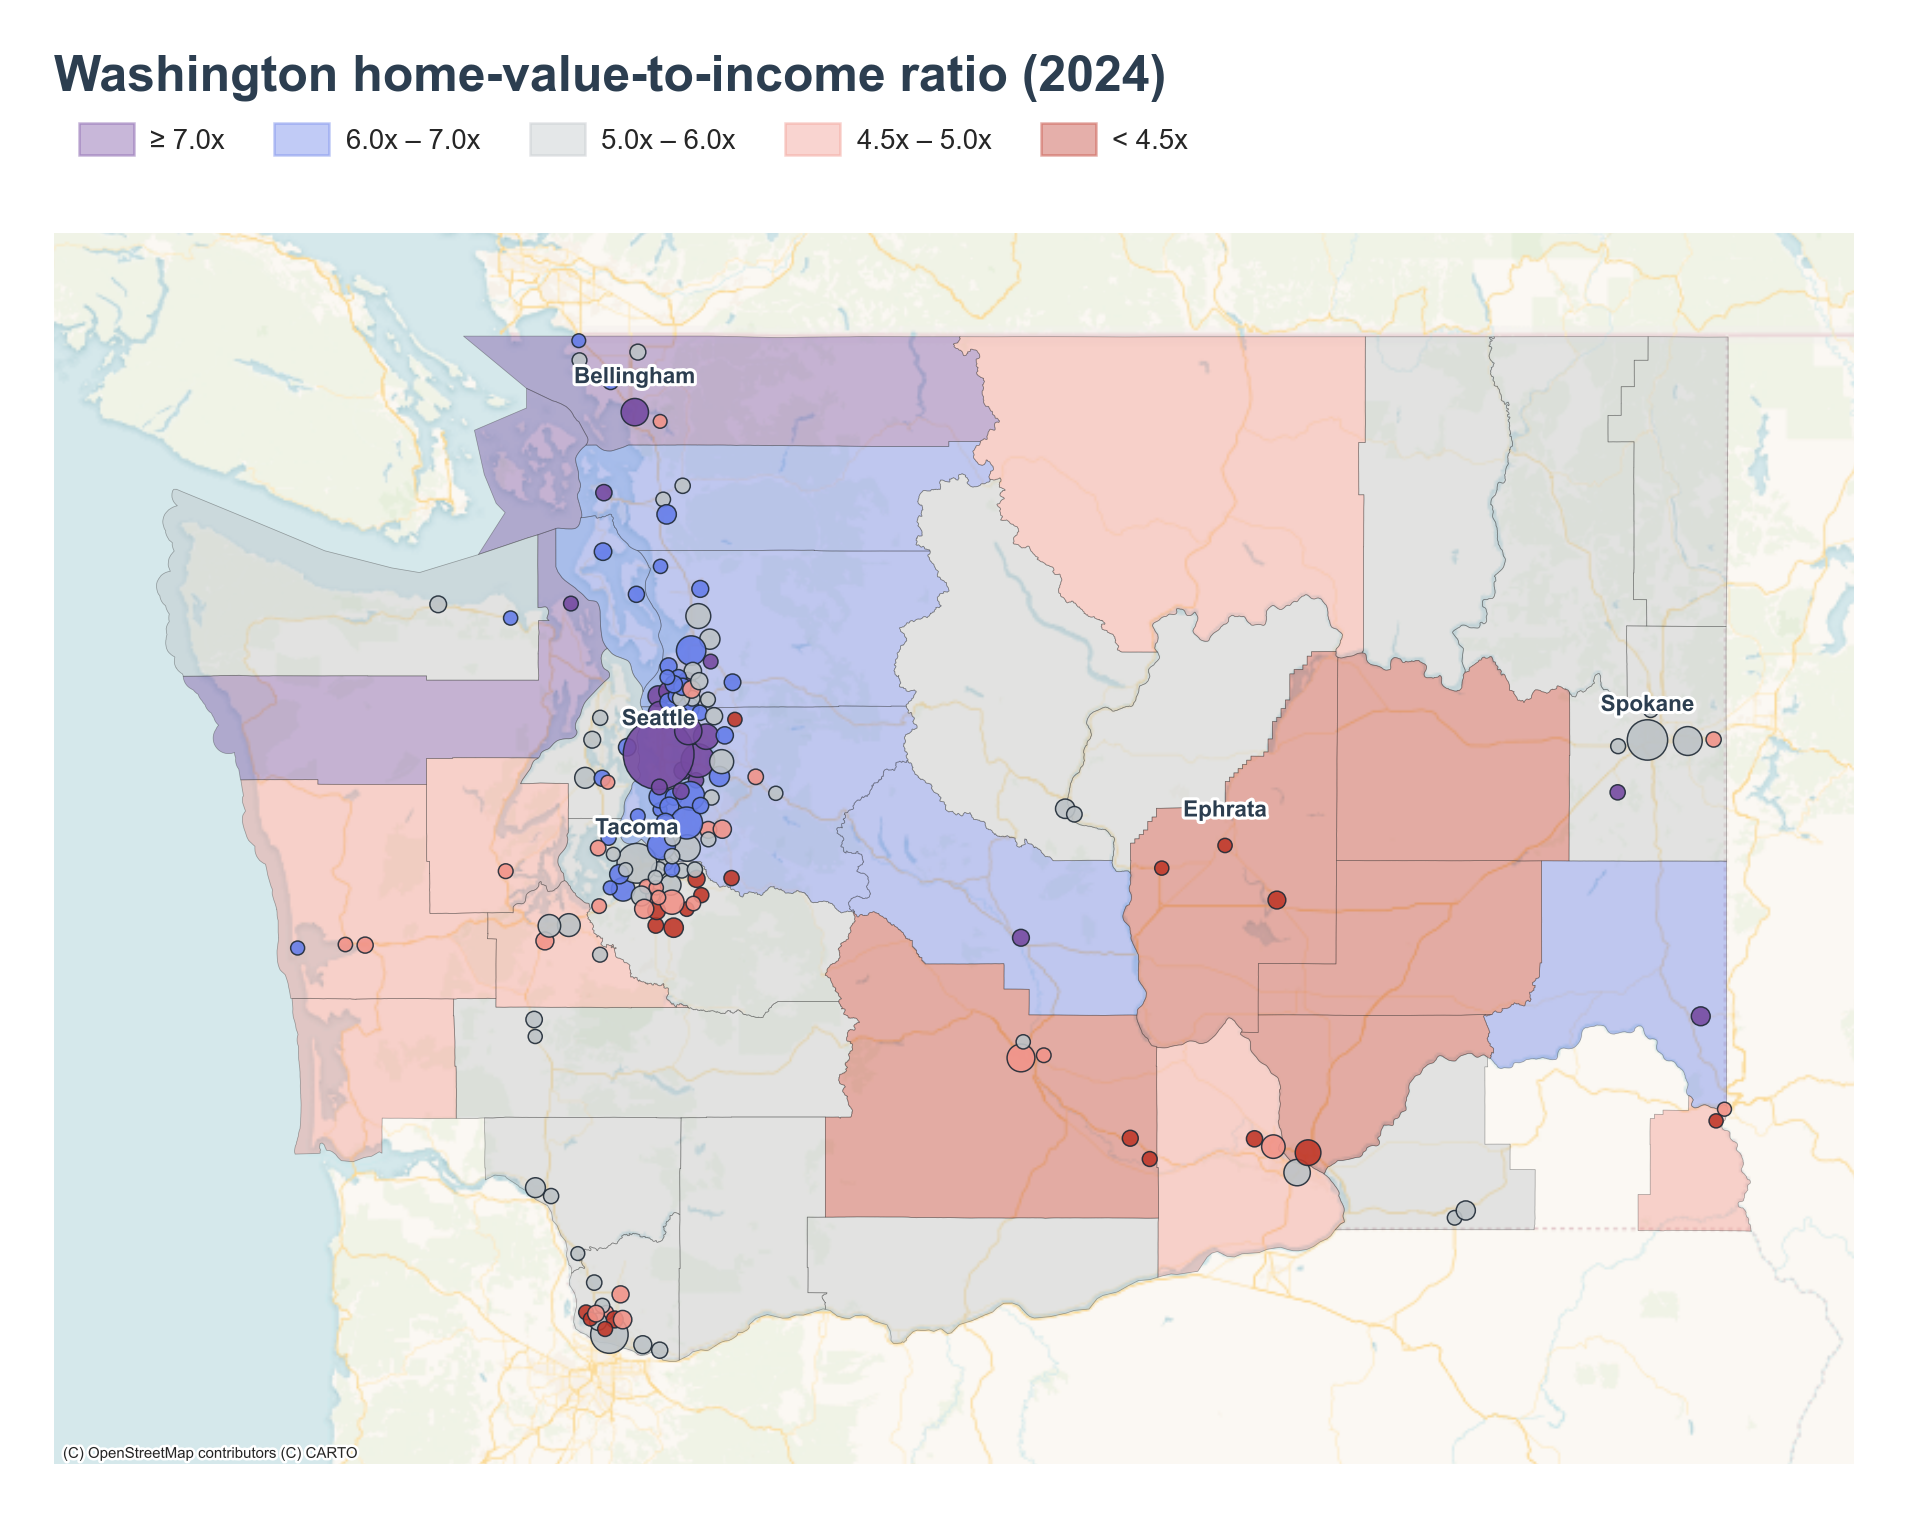
Among places, the leaderboard is a mix of college towns, an affluent island, and coastal amenity towns. Bellingham leads at 9.40x — a median home value of $627,500 against a median household income of $66,755, the income denominator compressed by Western Washington University 's student population. Mercer Island sits at 9.13x with a median household income of $219,069 but a median home value at the ACS top-code ($2,000,001), consistent with its place among the 100 richest ZIP codes in the country . Pullman at 9.07x is the textbook college-town ratio — a $424,800 home against a $46,812 median income — driven by the flagship Washington State University campus . Lynnwood just north of Seattle reaches 8.84x ($686,900 / $77,704), and Port Townsend on the Olympic Peninsula closes the top five at 8.68x ($543,400 / $62,606).
Where the ratio is lowest
The bottom of the county distribution is the eastern agricultural belt. Grant County at 4.09x, Lincoln County at 4.09x, Adams County at 4.13x, Franklin County at 4.37x, and Yakima County at 4.39x form a band across the Columbia Basin and Yakima Valley where home values have stayed between $273,300 and $379,300 alongside working incomes. Every one sits within 0.3x of the national 4.12x.
The lowest-ratio places track the same geography, but income is doing more of the work than cheap homes. Ephrata , the Grant County seat, posts the state's lowest place-level ratio at 3.62x ($252,000 / $69,551). Orting , southeast of Tacoma, sits at 3.71x with a $493,100 home and a $132,877 household income — the home is not cheap, the household just earns enough to absorb it. West Richland in the Tri-Cities reaches 3.74x on a $119,892 income. Clarkston Heights-Vineland in the state's southeastern corner posts 3.81x, and Quincy — the Grant County town that has hosted large Microsoft, Yahoo!, Dell, and Intuit data centers since 2007 — comes in at 3.83x ($336,800 / $87,902).
How the distribution moved
In 2018, 62.0% of Washington households lived in places where the home-value-to-income ratio sat between 3x and 5x. By 2024 that combined share is 18.1%.
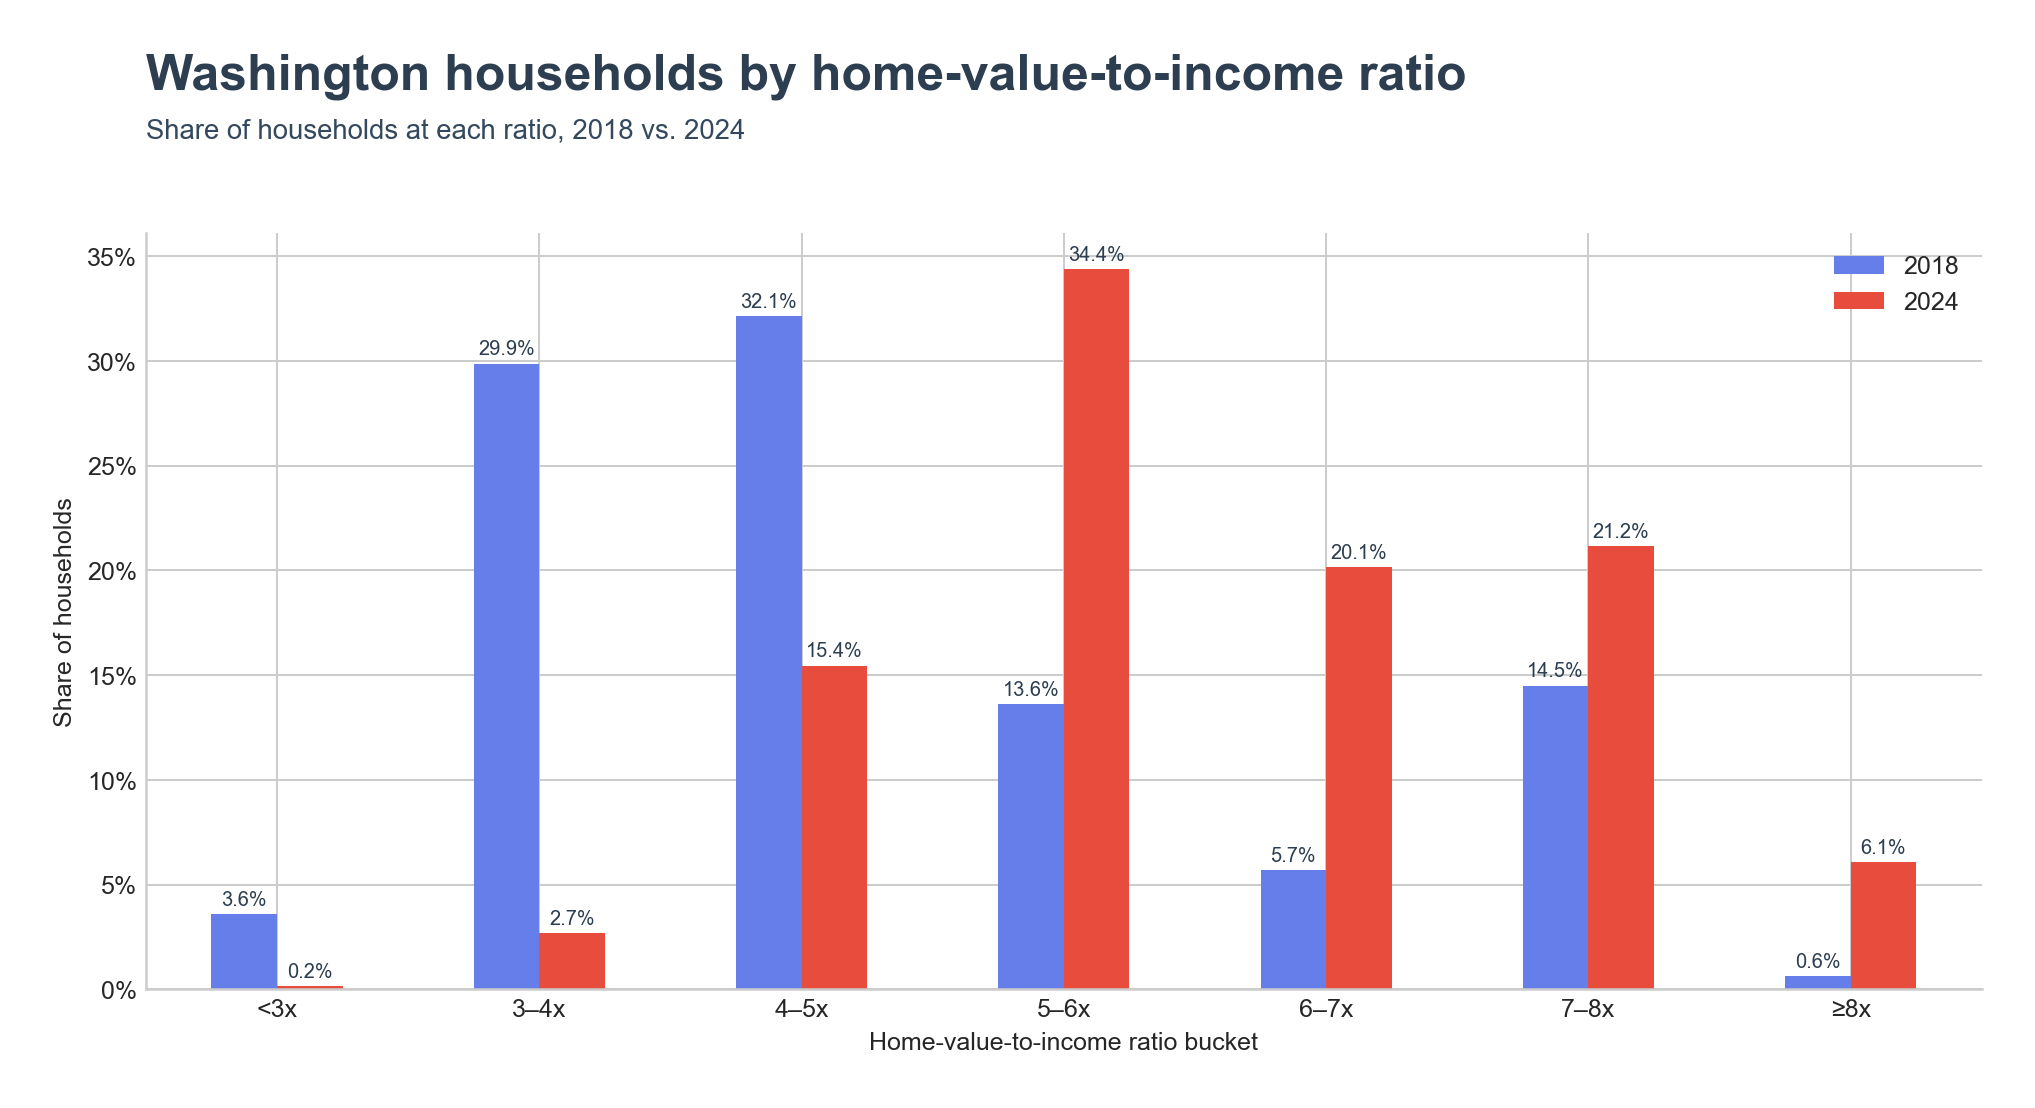
The 3–4x bucket collapsed from 29.9% of households to 2.7%. The 5–6x range grew from 13.6% to 34.4% and is now the modal bucket. The 6–7x range jumped from 5.7% to 20.1%. The 7–8x range expanded from 14.5% to 21.2%, and the share at 8x or above grew from 0.6% to 6.1%. The middle of the Washington housing market moved up by roughly one full turn of income.
Key Takeaways
- Washington's home-value-to-income ratio reached 5.75x in 2024 against the US figure of 4.12x — a 1.63x gap, up from 1.05x in 2018.
- Median home value outran median household income by 41 index points between 2018 and 2024.
- High-ratio geography is the northwestern coast, the San Juans, the Seattle metro, and college towns (Bellingham , Pullman ); low-ratio geography is the Columbia Basin and Yakima Valley farm counties.
- The share of Washington households in places between the 3x and 5x lines fell from 62.0% in 2018 to 18.1% in 2024.
- Ephrata at 3.62x is the most affordable place in the state; Bellingham at 9.40x is the least.