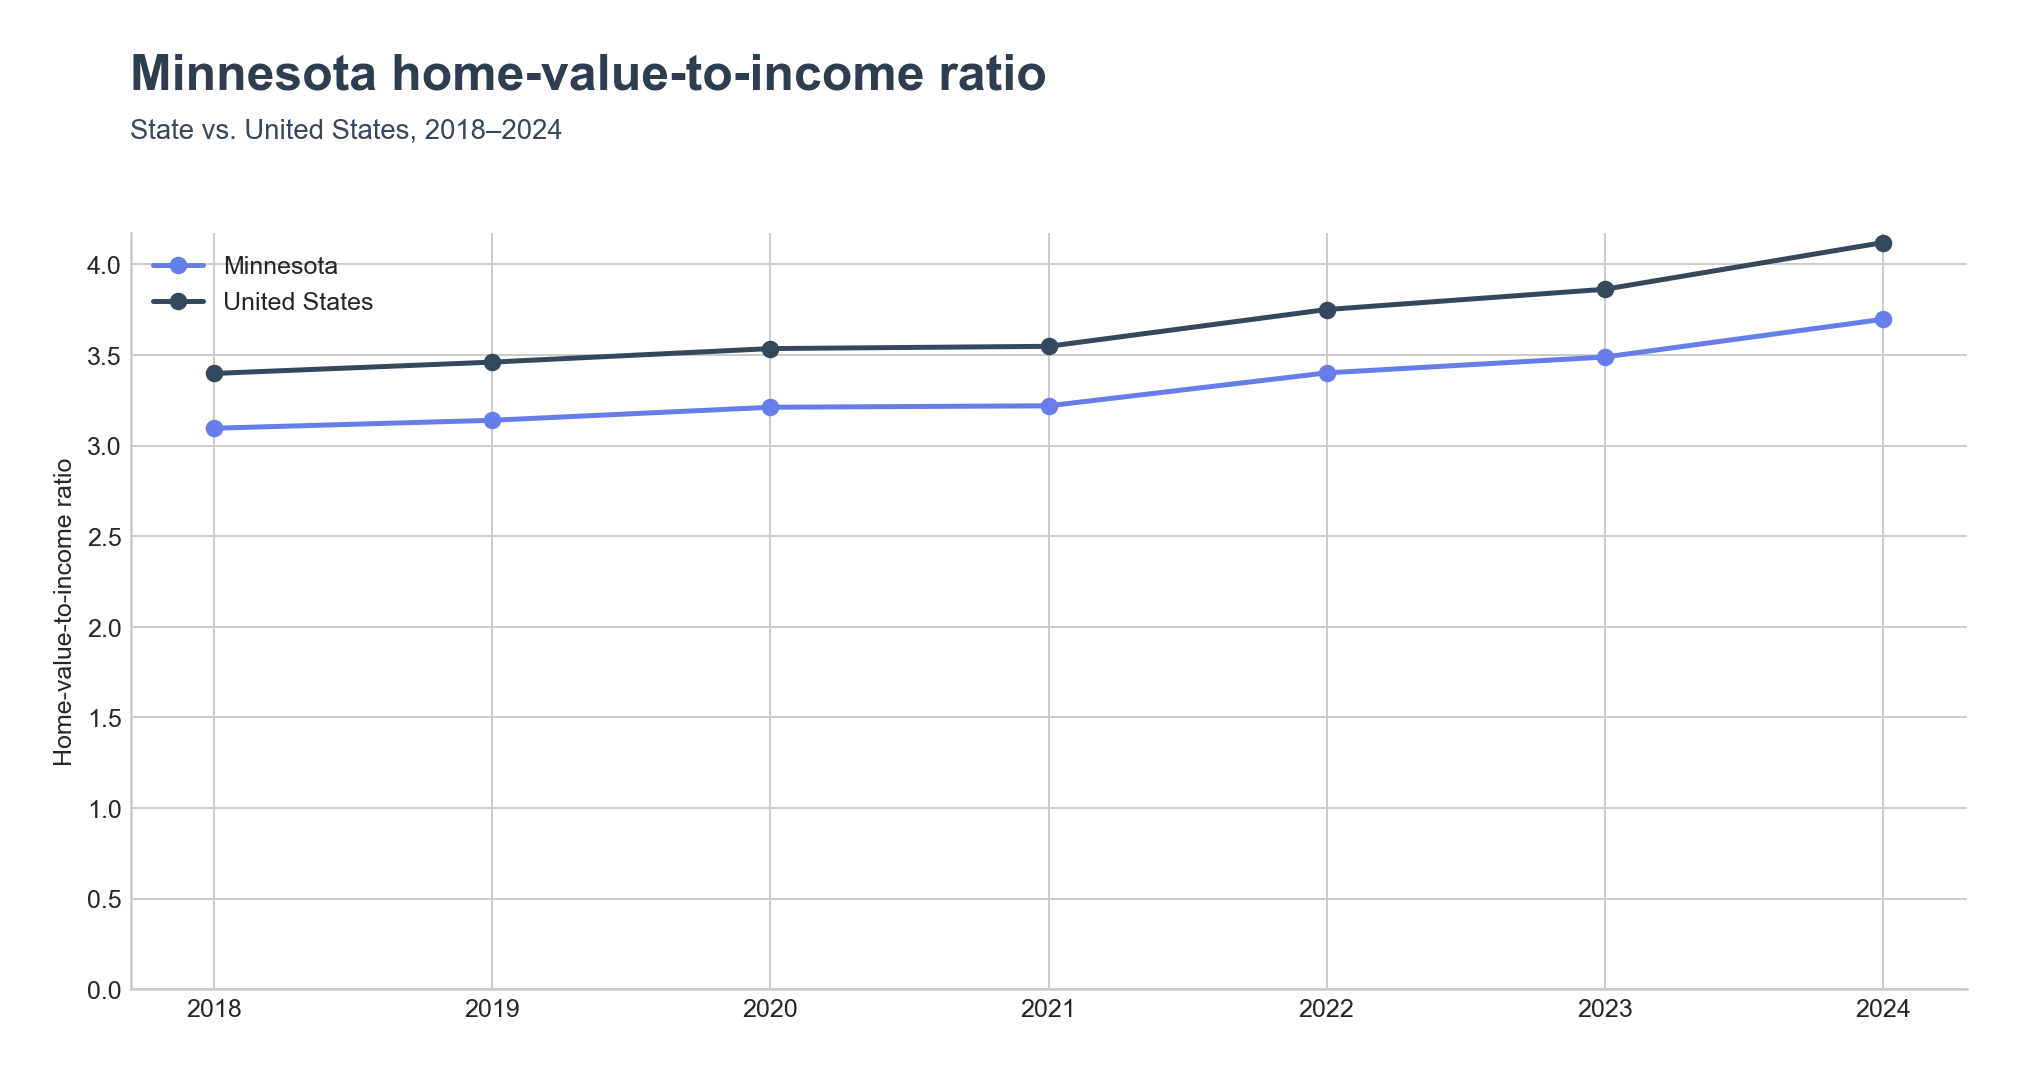
Minnesota's home-value-to-income ratio reached 3.70x in 2024, up from 3.10x in 2018. The state still sits below the United States, which crossed 4.12x the same year. Minnesota tracks the national line in shape but consistently runs about half a turn lower.
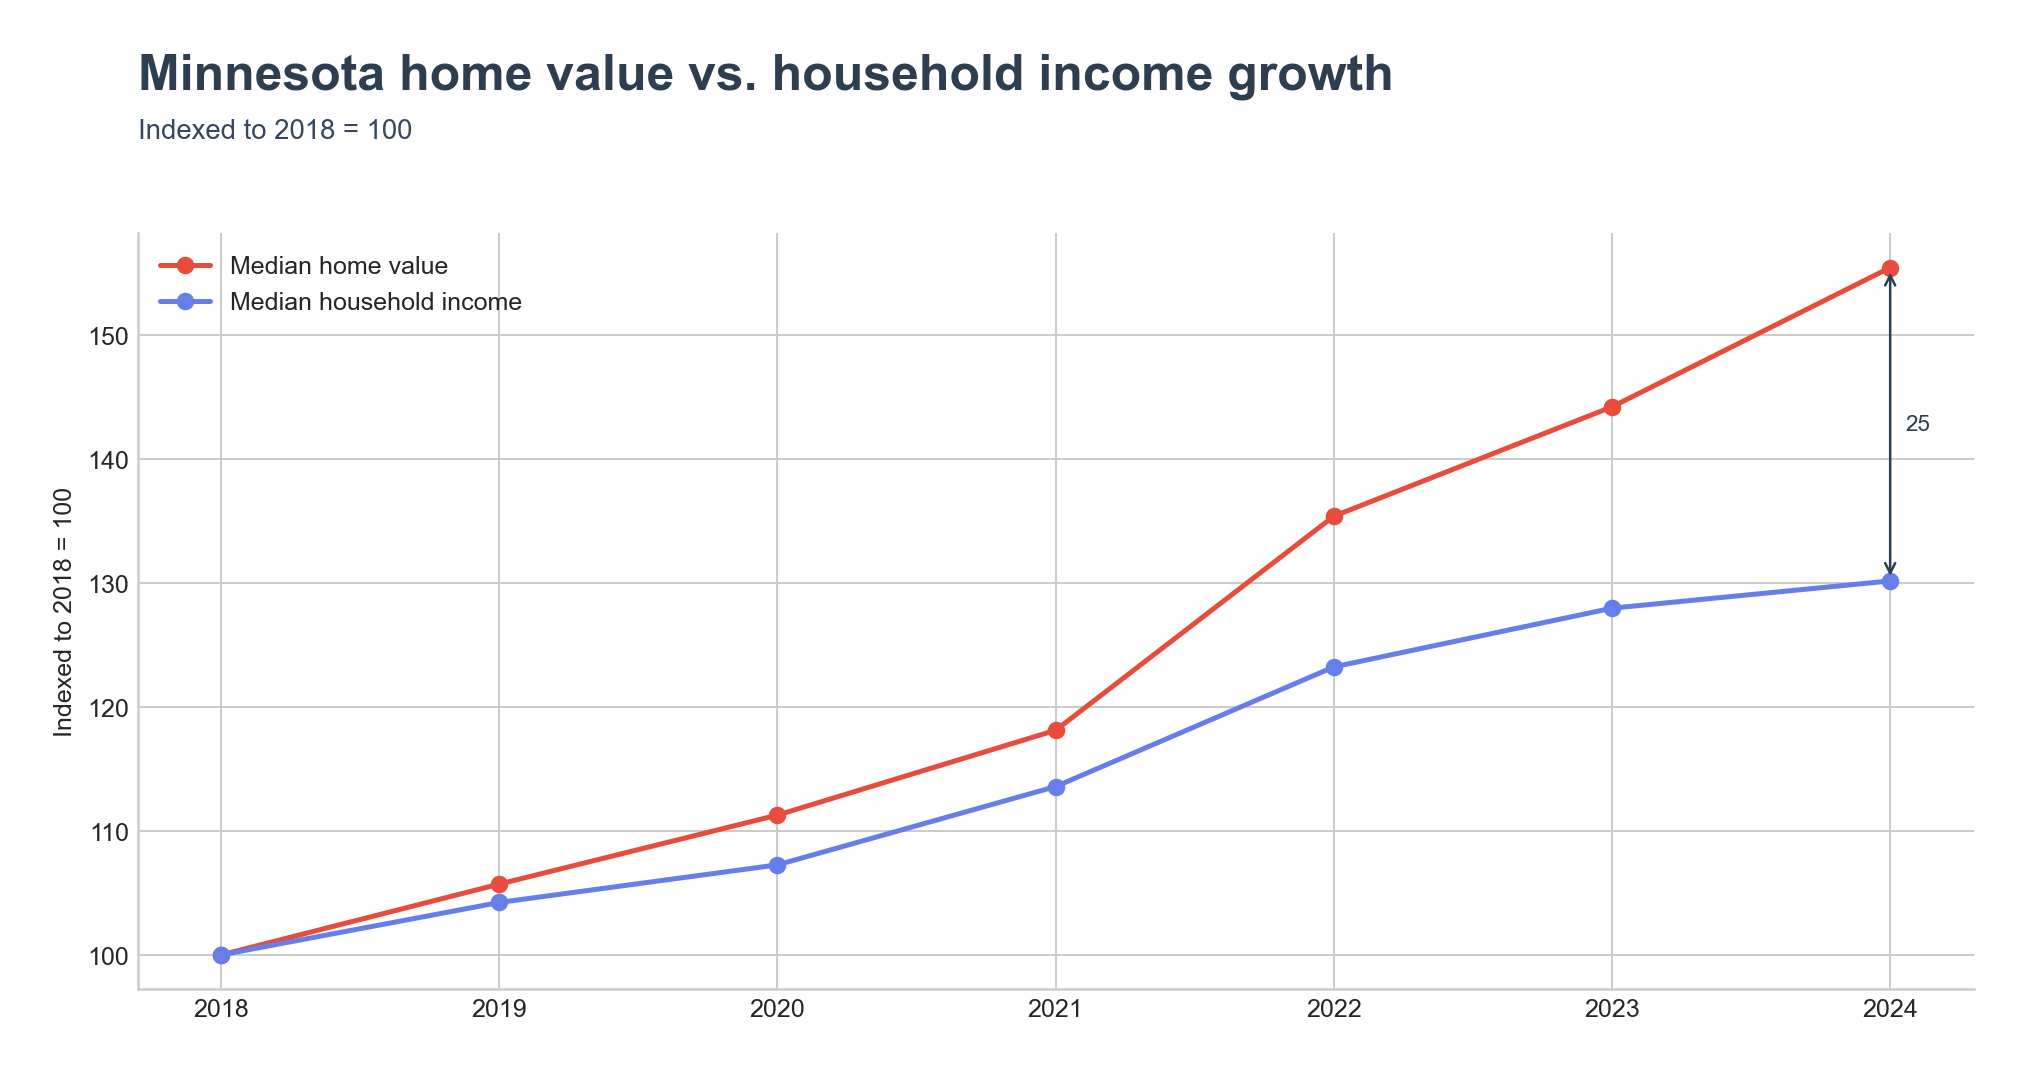
The widening came from prices outrunning wages. Indexed to 2018, median home value reached 155 by 2024 while median household income reached 130 — a 25-point gap that opened sharply between 2021 and 2022.
Where the ratio runs hottest
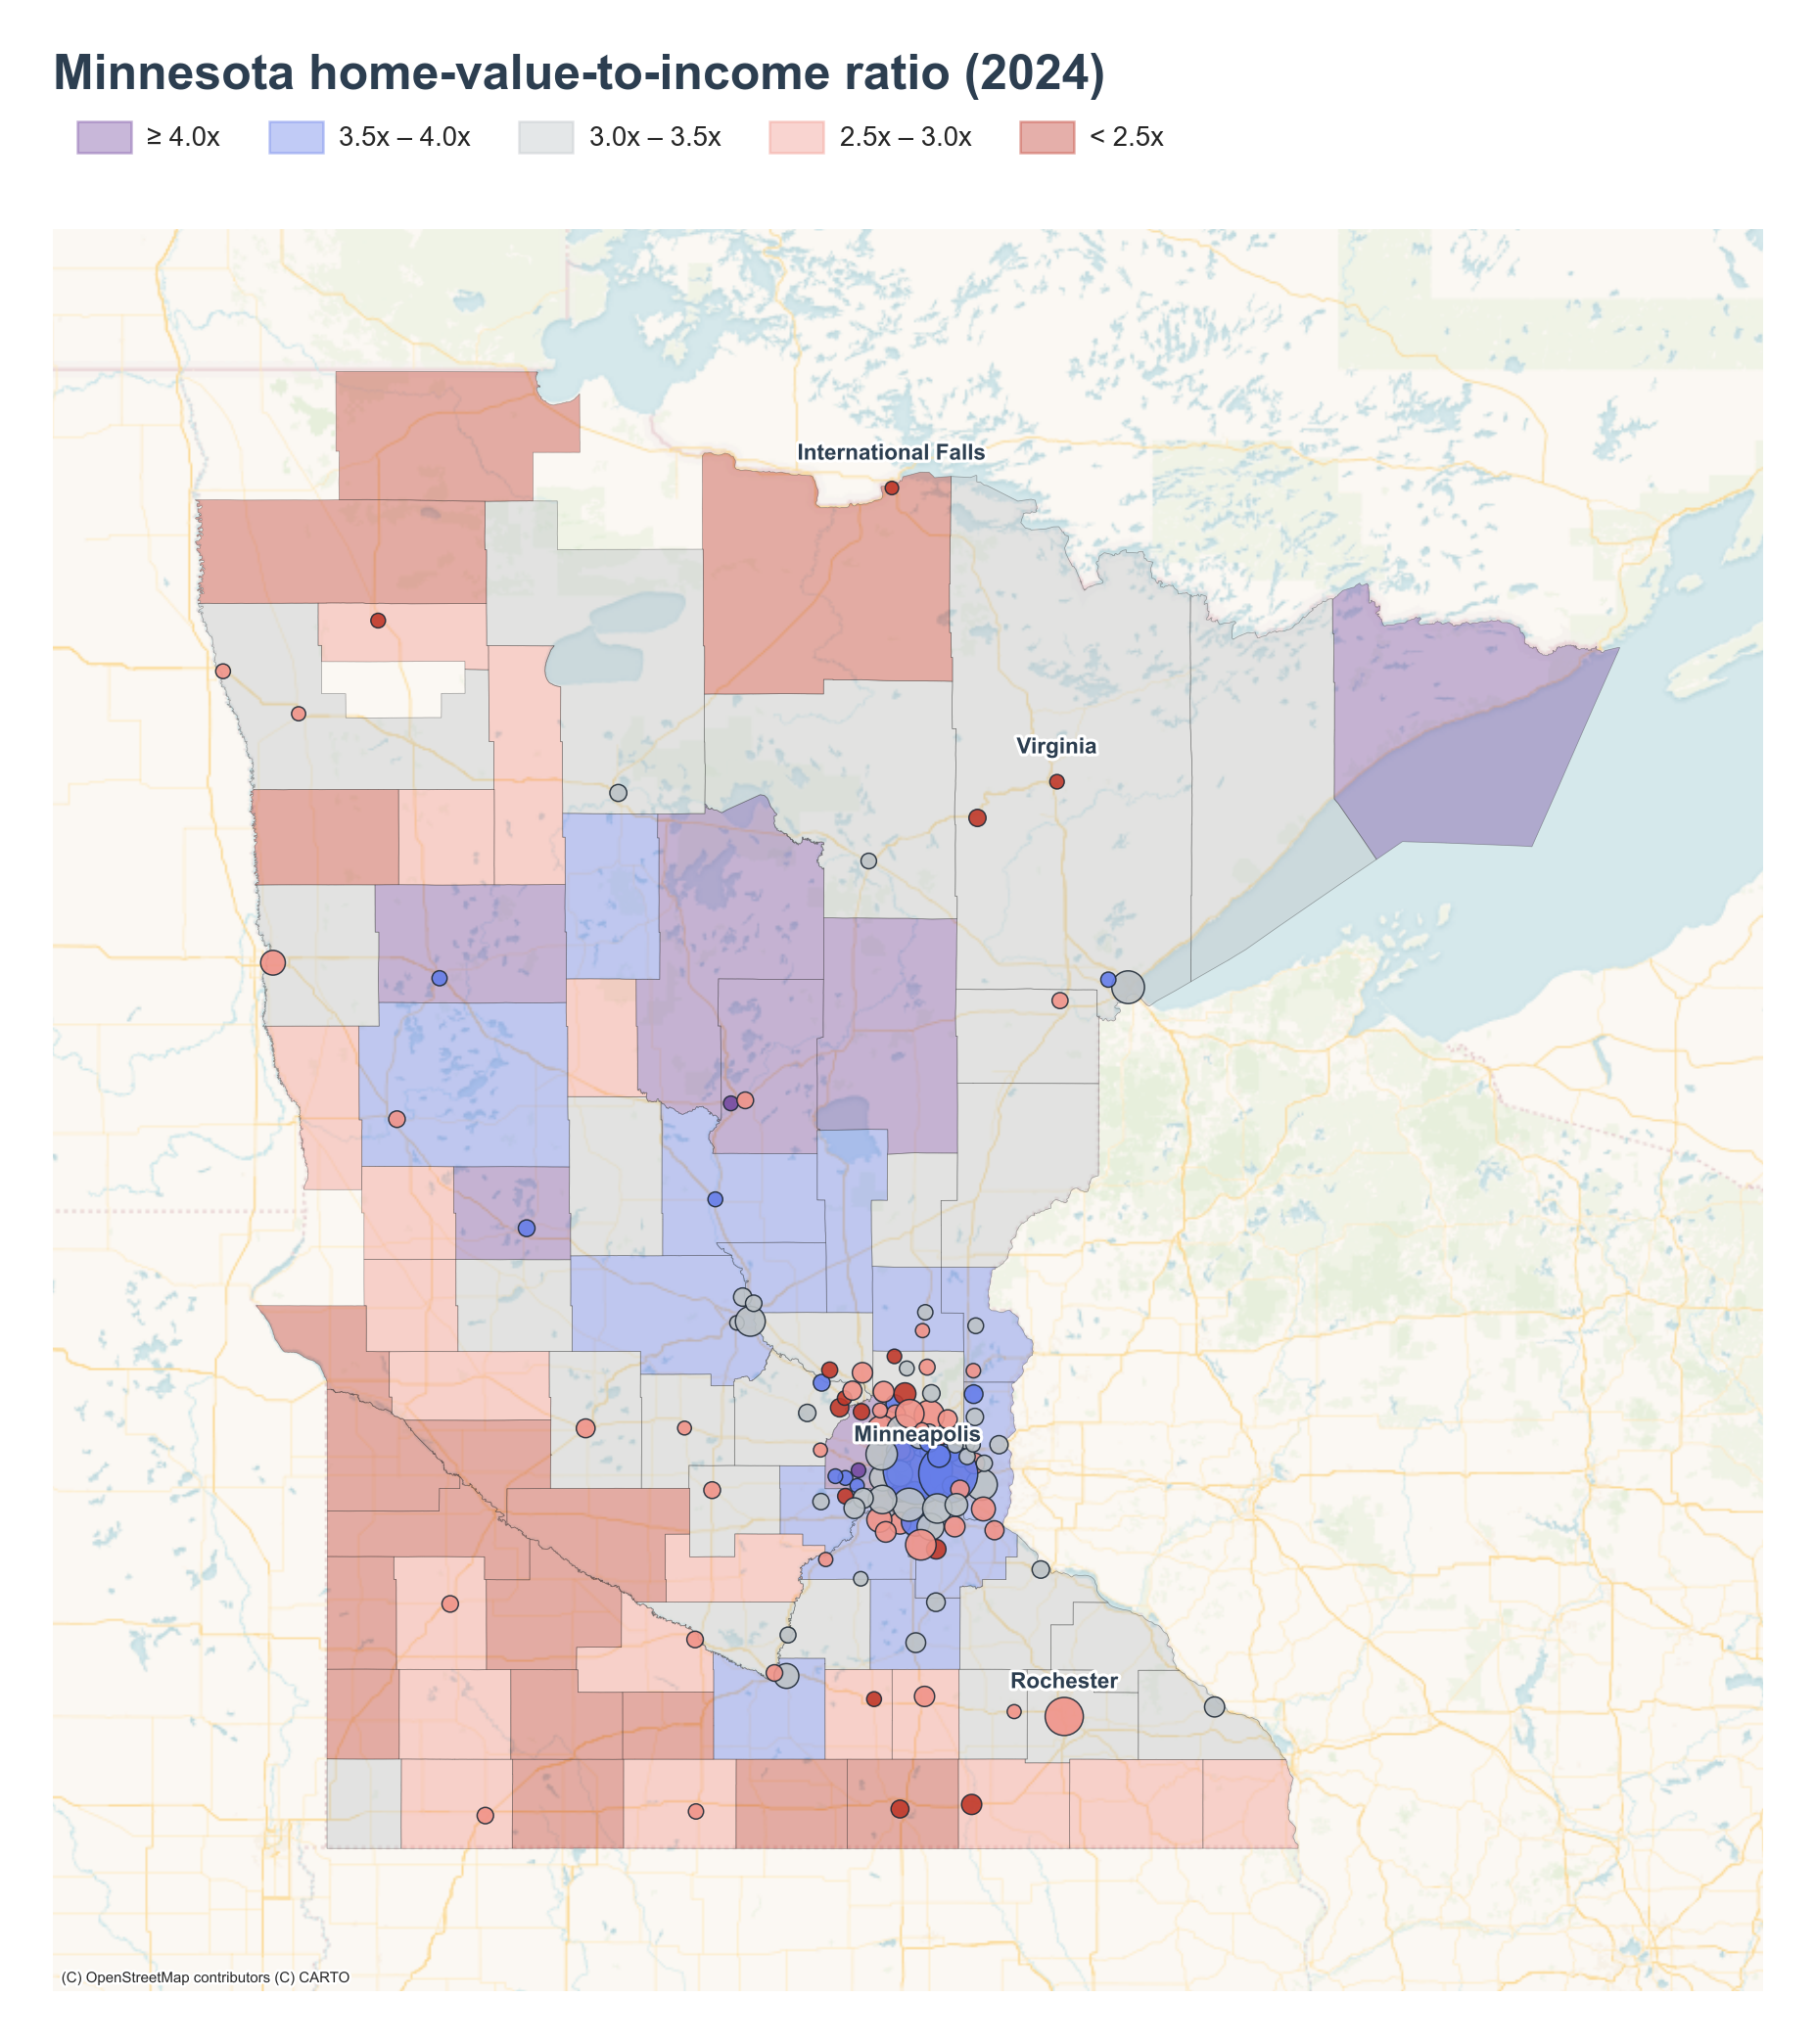
At the place level, the top of the table is the western Twin Cities suburbs. Orono , on the north shore of Lake Minnetonka, posts 5.79x on a median home value of $1,004,500. Edina follows at 5.02x and Hopkins at 4.99x — both inner-ring suburbs immediately west of Minneapolis on the map.
The other two top places sit in central Minnesota's lake country. Baxter reaches 4.58x and Alexandria 4.49x, both anchored to resort and second-home markets where home values outrun local wage bases.
The county map carries the same shape. The highest county ratio is Cook County at 4.63x, the Arrowhead tip on Lake Superior bordering the Boundary Waters . It is followed by a north-central lakes cluster — Crow Wing at 4.23x, Aitkin at 4.20x, Cass at 4.19x, and Becker at 4.08x — the Brainerd Lakes and surrounding resort country.
Where it runs coldest
The bottom of the place ranking pulls from two regions. International Falls , the border city on the Canadian line, sits at 2.09x. Virginia at 2.33x and Hibbing at 2.33x are both on the Mesabi Iron Range in the northeast, where wages tied to mining and forestry hold up against modest housing markets. Austin at 2.41x and Albert Lea at 2.44x are southern-tier cities near the Iowa border with industrial employment bases.
The bottom counties are an agricultural belt in southwestern and western Minnesota: Pipestone at 2.01x, Faribault at 2.02x, Norman at 2.04x, Jackson at 2.07x, and Yellow Medicine at 2.09x.
How the distribution moved
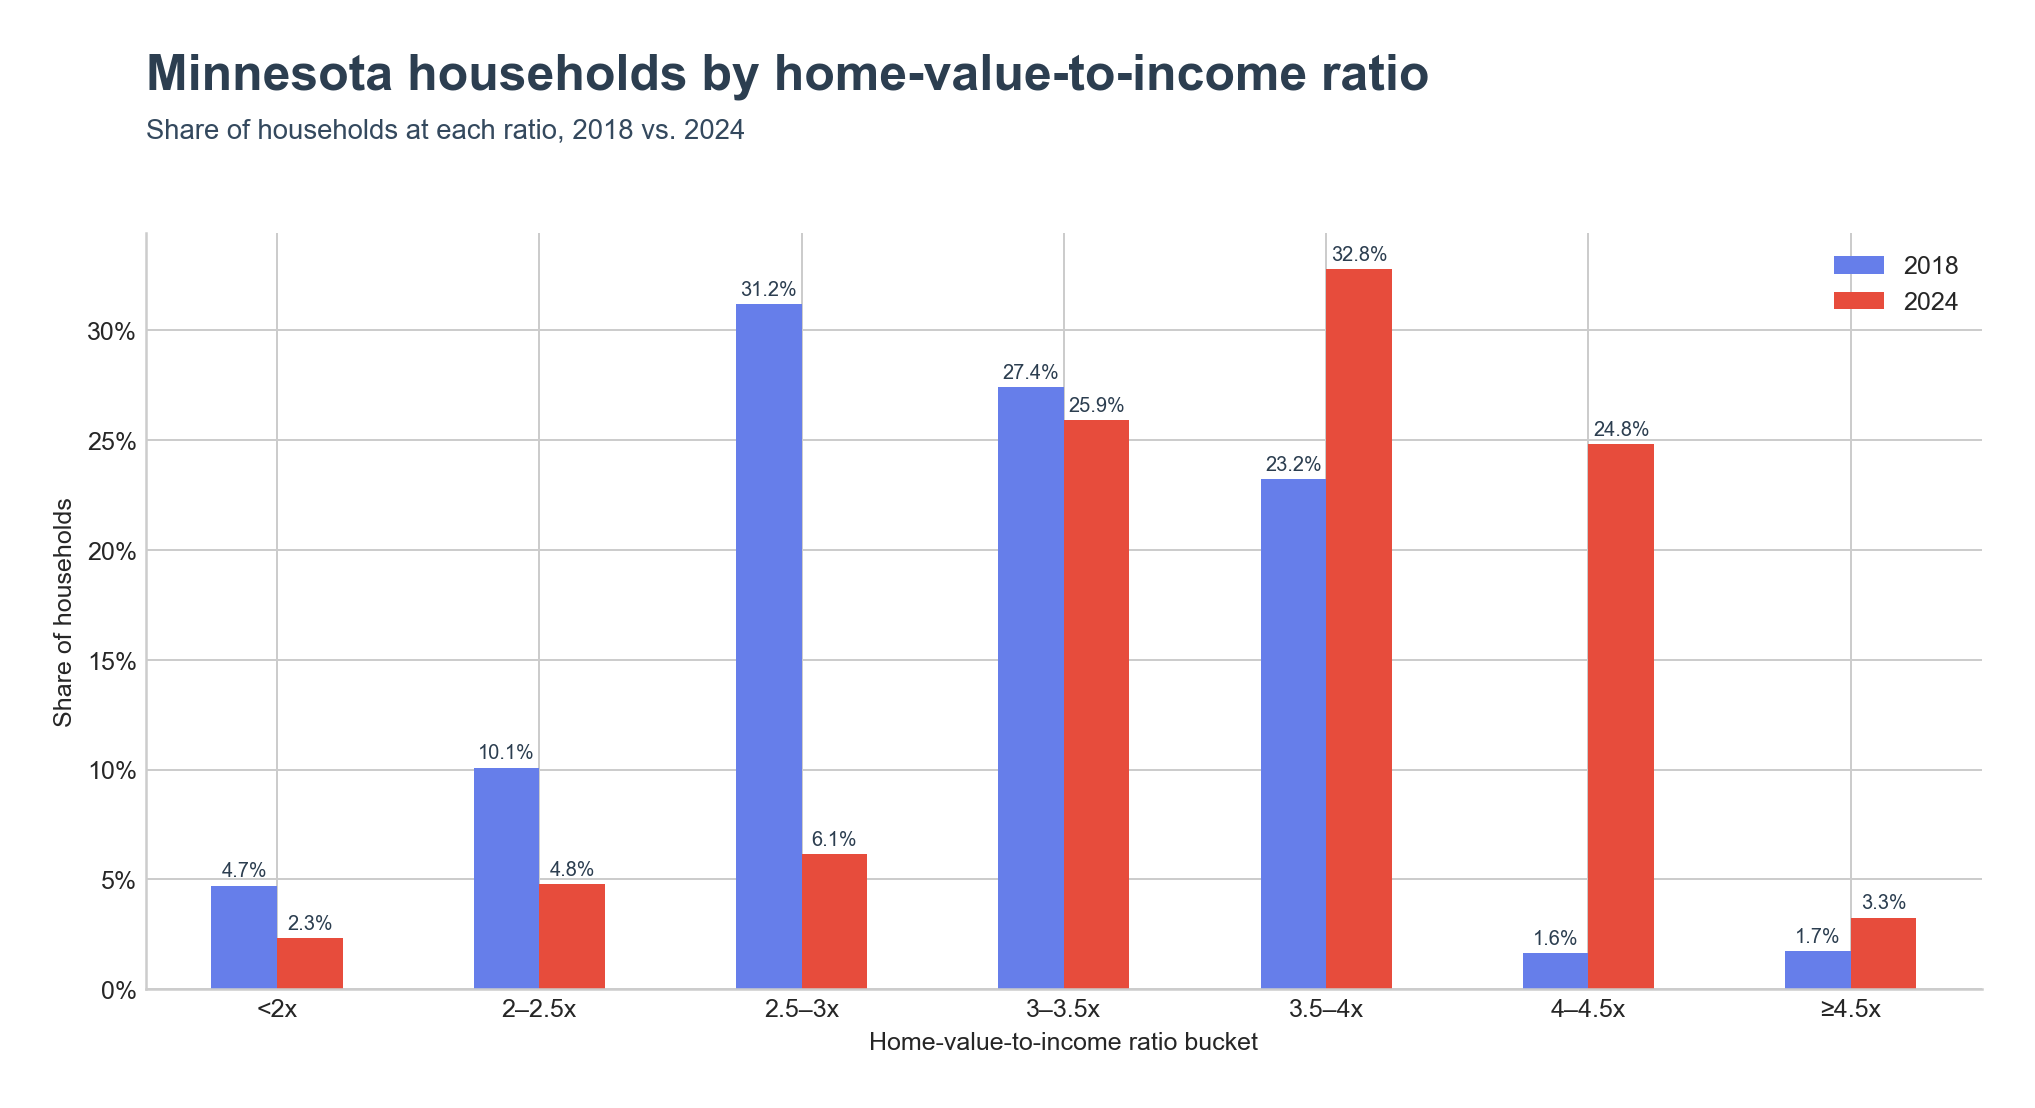
The shift across households is sharp. In 2018, 31.2% of households lived in places with ratios between 2.5x and 3x, and only 1.6% lived in places at 4.0x–4.5x. By 2024, the 2.5x–3x bucket had collapsed to 6.1% and the 4.0x–4.5x bucket had grown to 24.8%. The 3.5x–4x bucket also expanded from 23.2% to 32.8%. The share of households in places at 4.5x or above rose from 1.7% to 3.3%.
Key Takeaways
- Minnesota's home-value-to-income ratio rose from 3.10x in 2018 to 3.70x in 2024, still below the United States at 4.12x.
- Median home value grew to 155 (2018=100) while median household income reached 130, a 25-point gap that opened mostly after 2021.
- The hottest places are western Twin Cities suburbs — Orono at 5.79x, Edina at 5.02x, Hopkins at 4.99x — alongside lake-country towns Baxter and Alexandria.
- The hottest counties form a north-central lakes belt led by Cook County at 4.63x.
- The lowest ratios sit in Iron Range cities, the southern border industrial towns, and the southwestern farm counties, all in the low 2x range.
- The 4.0–4.5x bucket grew from 1.6% to 24.8% and the ≥4.5x bucket from 1.7% to 3.3% between 2018 and 2024.