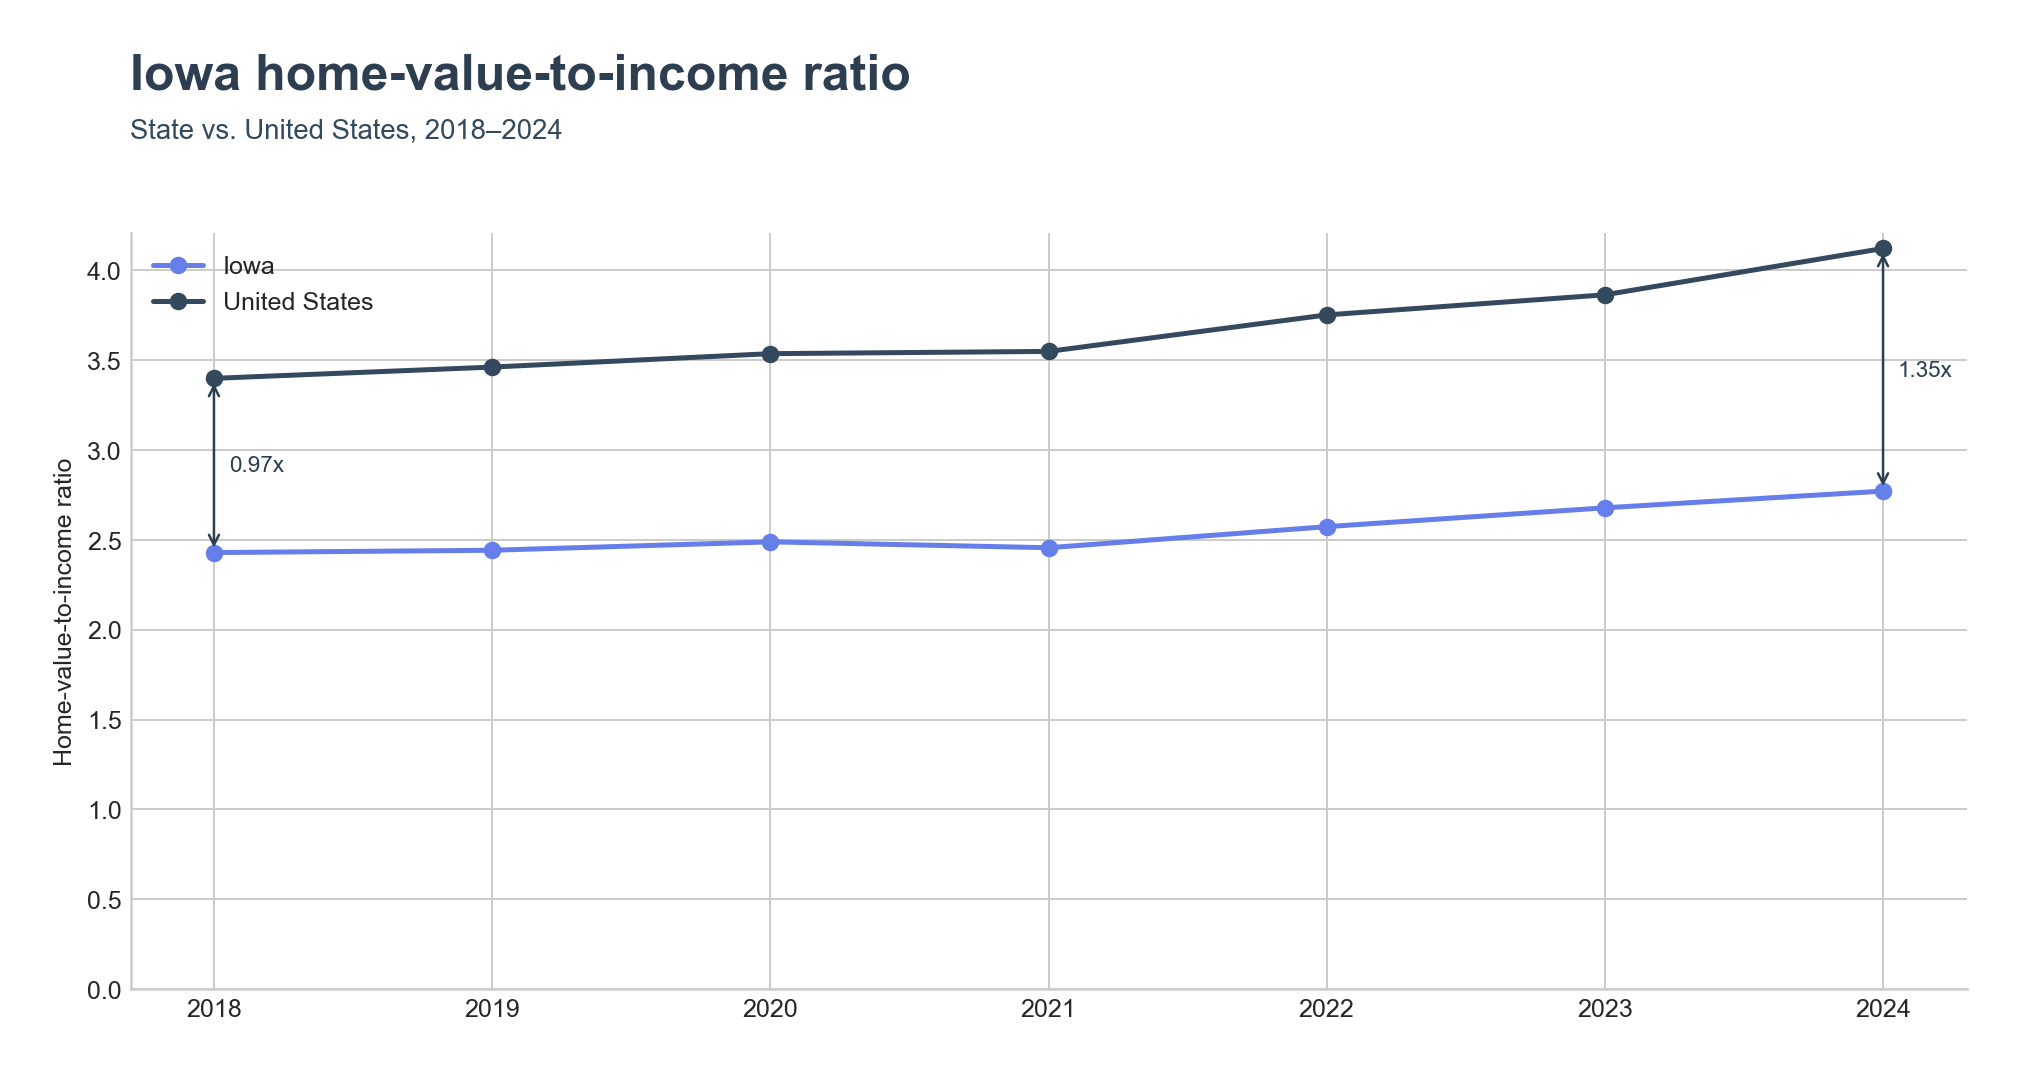
Iowa's statewide home-value-to-income ratio reached 2.77x in 2024, still well under the United States figure of 4.12x. The gap between Iowa and the country has widened: in 2018 Iowa trailed the US by 0.97x, and by 2024 that distance had grown to 1.35x.
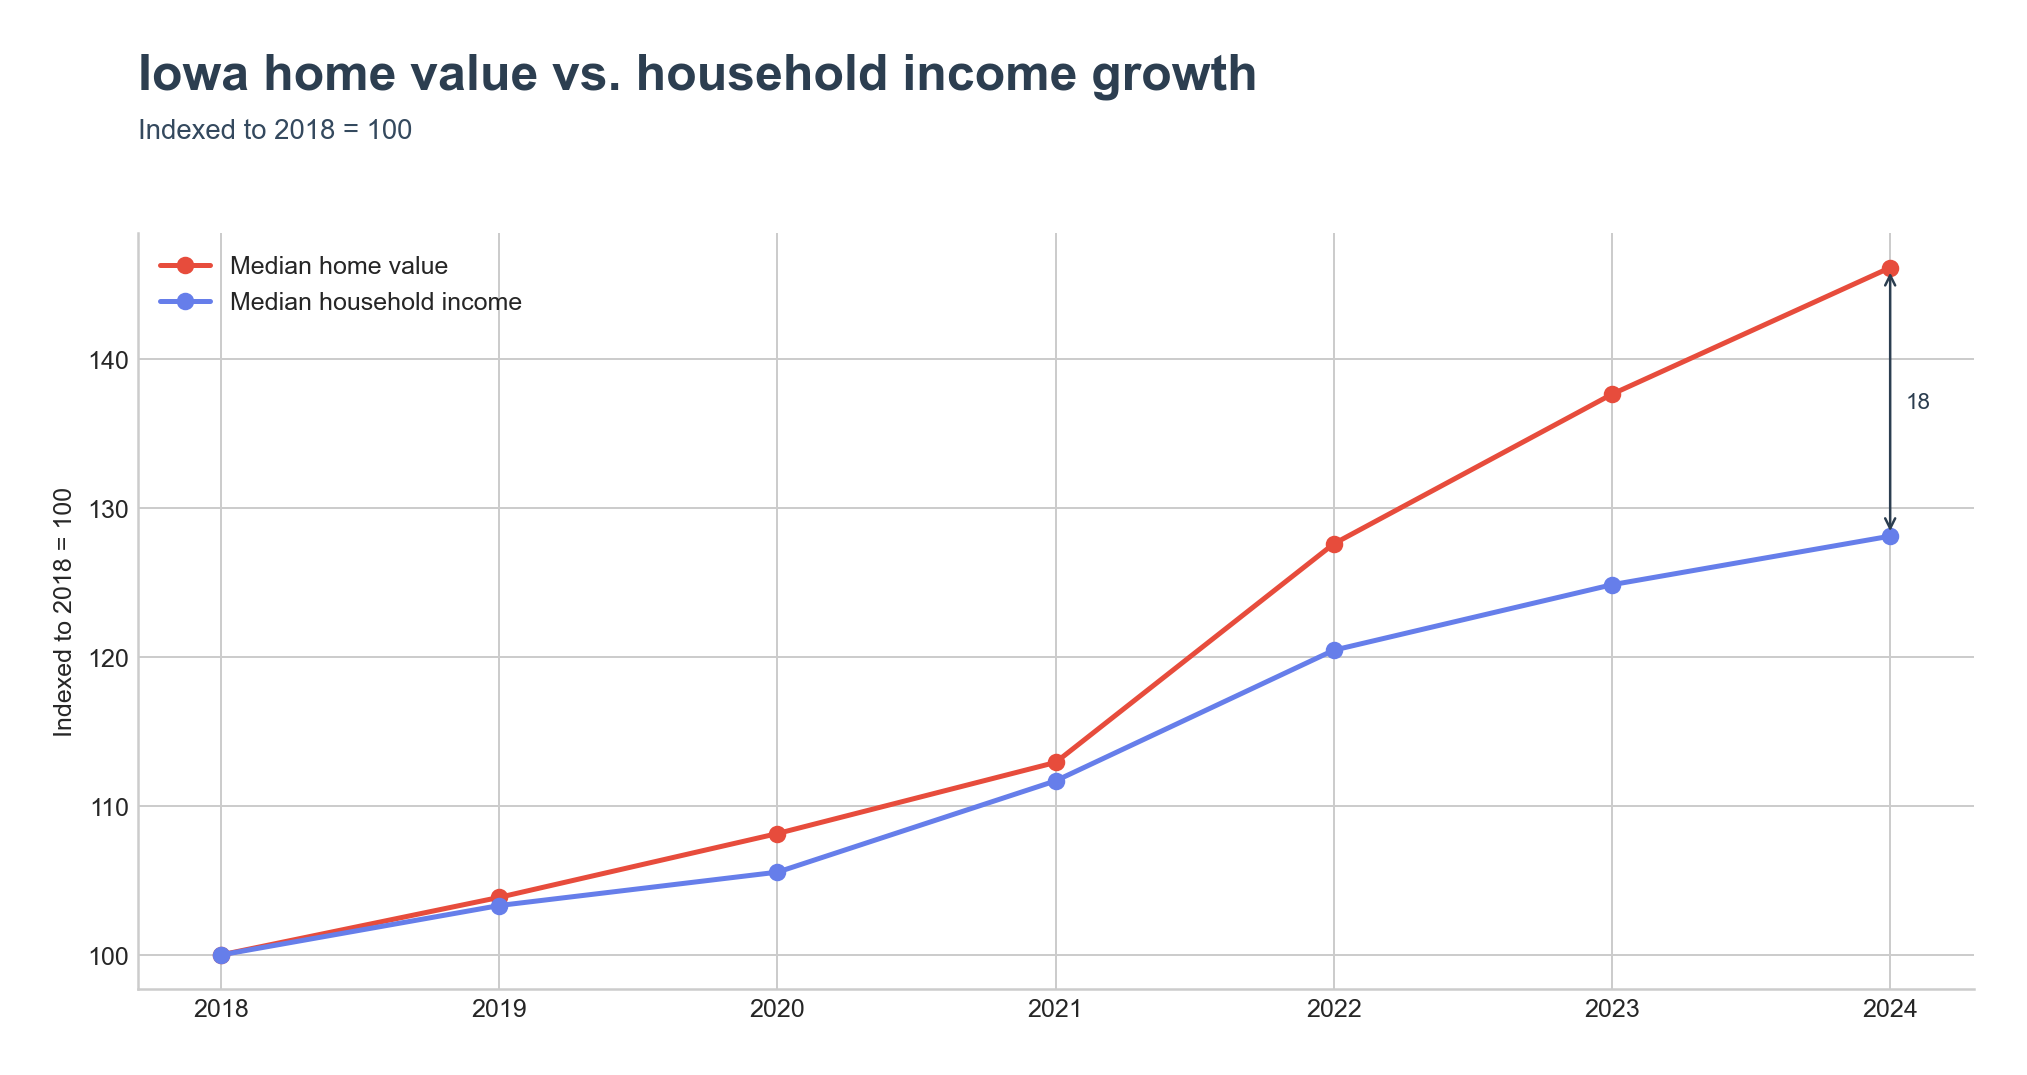
The widening reflects a split between the two components. Indexed to 2018, Iowa's median home value rose to 146 by 2024 while median household income reached only 128 — an 18-point gap that opened almost entirely after 2021.
Where the ratio runs highest
The five highest-ratio places in Iowa all anchor on a university or a Des Moines western suburb. Iowa City leads at 4.88x, with Coralville next door at 4.32x — the University of Iowa and its hospitals together dominate the local labor and housing markets. Ames follows at 4.55x, where Iowa State University is the largest single employer and roughly half the city's population is enrolled there. Decorah , home to Luther College, sits at 3.80x, and West Des Moines at 3.57x caps the list as the highest-value Des Moines suburb in the ranking.
The county map echoes the same geography. Johnson County (Iowa City) tops the counties at 4.12x — matching the national figure exactly. Story County (Ames) is next at 3.71x. Dickinson County in the northwest lakes region — home to the Iowa Great Lakes vacation market — comes in at 3.59x. Dallas County , the fastest-growing county in Iowa from 2010 to 2020 and the western Des Moines suburb belt, posts 3.47x. Winneshiek County , which contains Decorah, rounds out the top five at 3.28x.
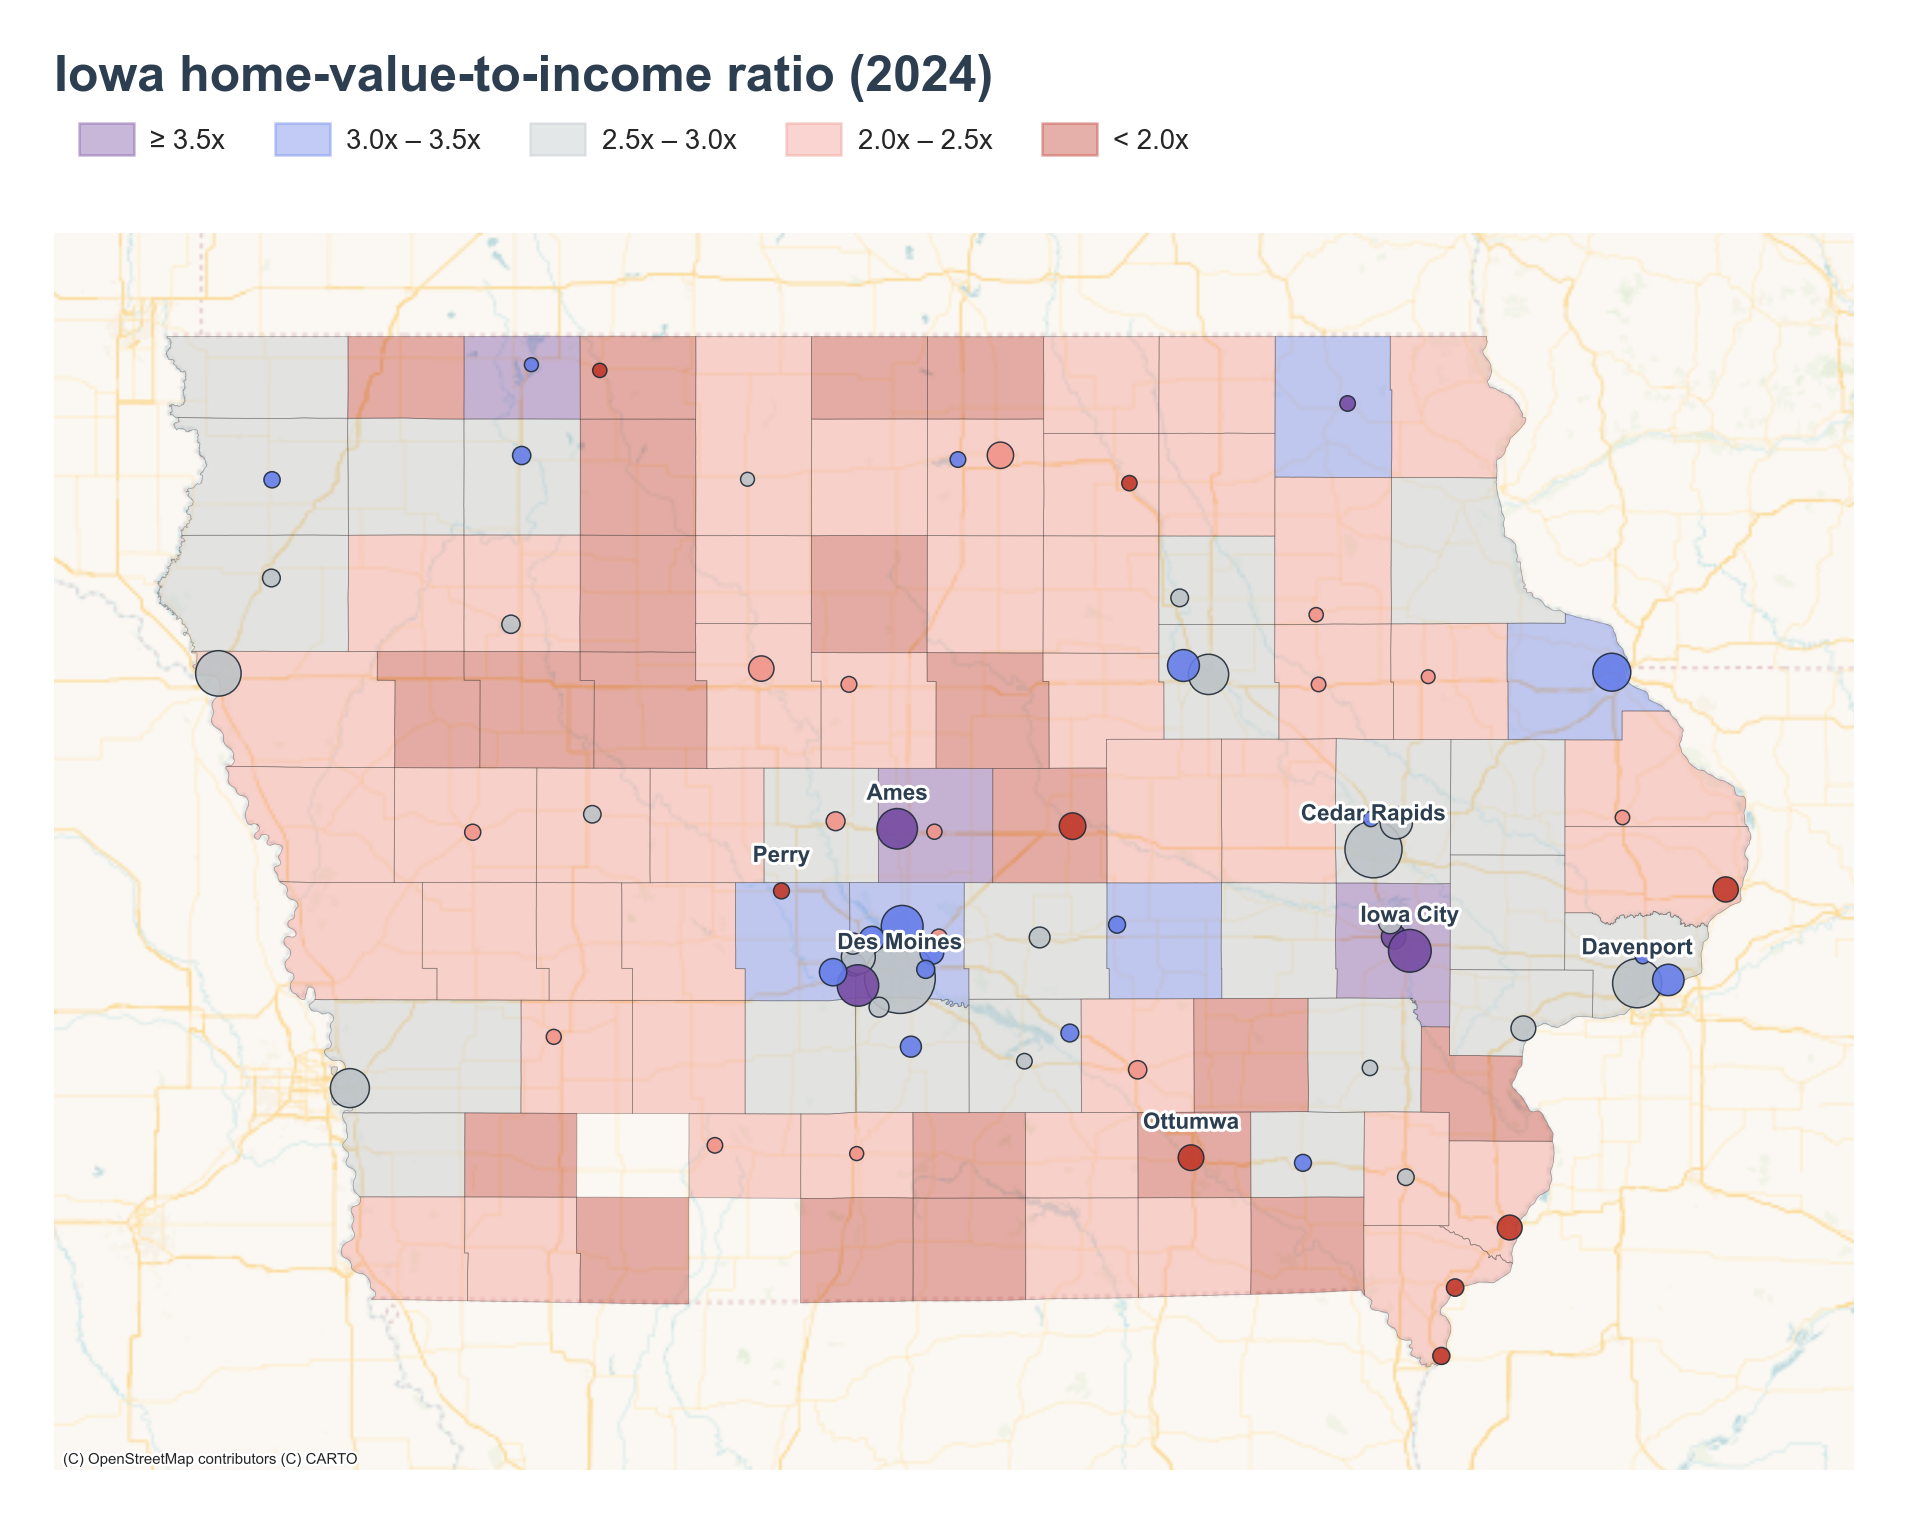
Where it runs lowest
The lowest-ratio places trace the older industrial centers of southern and central Iowa. Ottumwa sits at 1.74x, with a meatpacking and farm-equipment base that has shrunk since its mid-century peak. Fort Madison in the southeast posts 1.86x, and Marshalltown in central Iowa 1.85x. Perry (1.76x) and Estherville (1.87x) round out the bottom five — small cities where home values have stayed below $130,000 while incomes track close to the state median.
The lowest-ratio counties are concentrated in the rural northwest — Pocahontas (1.59x), Palo Alto (1.69x), Ida (1.73x), and Osceola (1.77x) — with Taylor County (1.73x) on the southwest border. All five sit well outside any metro pull and combine sub-$125,000 median home values with incomes that closely match the state.
How the household distribution shifted
The center of gravity moved up one bucket between 2018 and 2024. The largest share of Iowa households used to live in places with a 2–2.5x ratio (44.7% in 2018); that bucket dropped to 15.8% by 2024. The 2.5–3x bucket replaced it as the new mode, climbing from 23.5% to 40.9%. The 3–3.5x bucket nearly quadrupled from 4.3% to 17.7%.
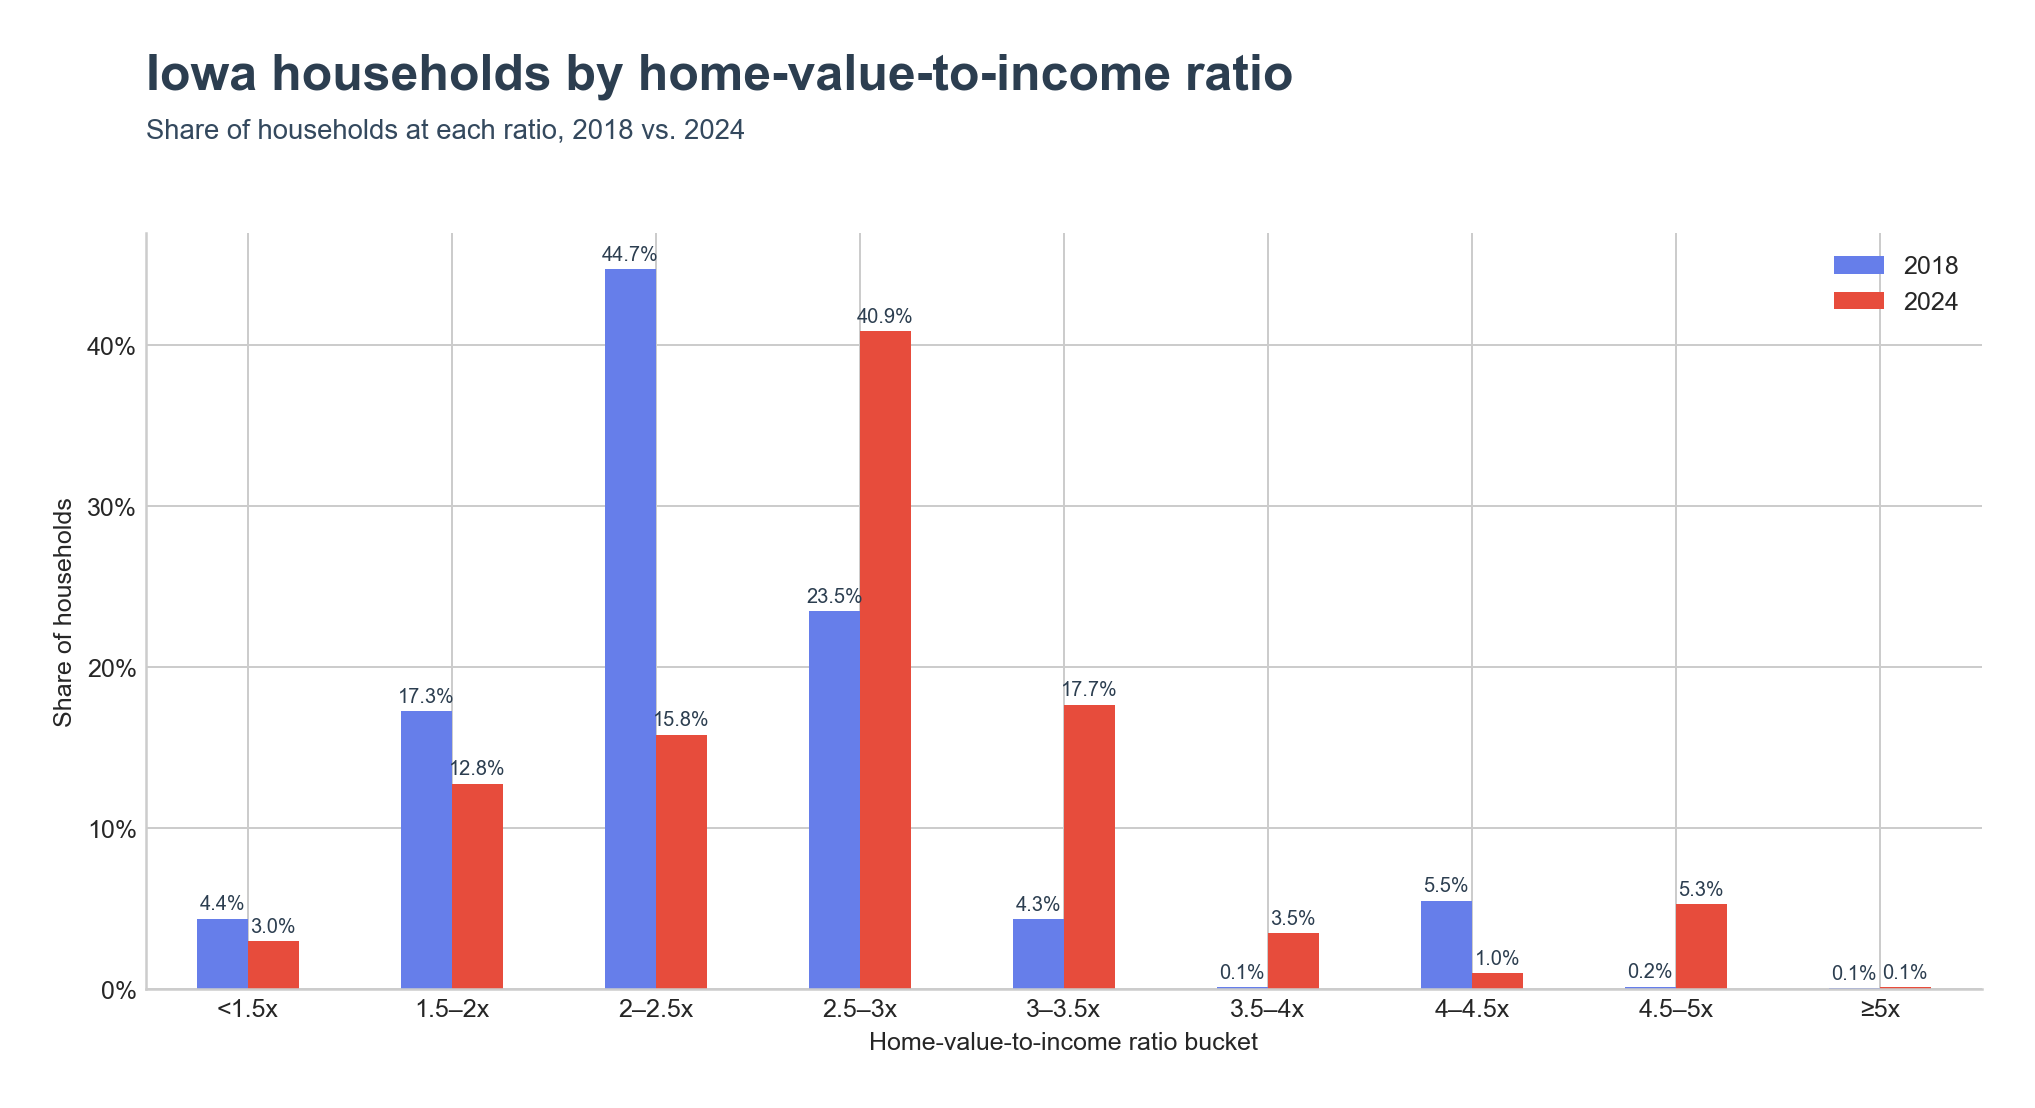
The upper buckets shifted as well: the 4–4.5x share fell from 5.5% to 1.0% while the 4.5–5x share rose from 0.2% to 5.3% — the same Iowa City–Coralville and Ames households moving up a notch as their home values outran local incomes.
Key Takeaways
- Iowa's statewide home-value-to-income ratio is 2.77x, 1.35x below the United States figure of 4.12x.
- The Iowa–US gap has widened by 0.38x since 2018, driven by home values rising 46% against income growth of 28%.
- The highest-ratio places are all university towns (Iowa City, Ames, Coralville, Decorah) or Des Moines western suburbs (West Des Moines, Dallas County).
- The lowest-ratio places are older industrial cities in southern and central Iowa (Ottumwa, Fort Madison, Marshalltown) and rural northwest farm counties.
- Iowa's modal household has shifted from the 2–2.5x bucket to the 2.5–3x bucket, and the 4.5–5x bucket grew from 0.2% of households to 5.3%.