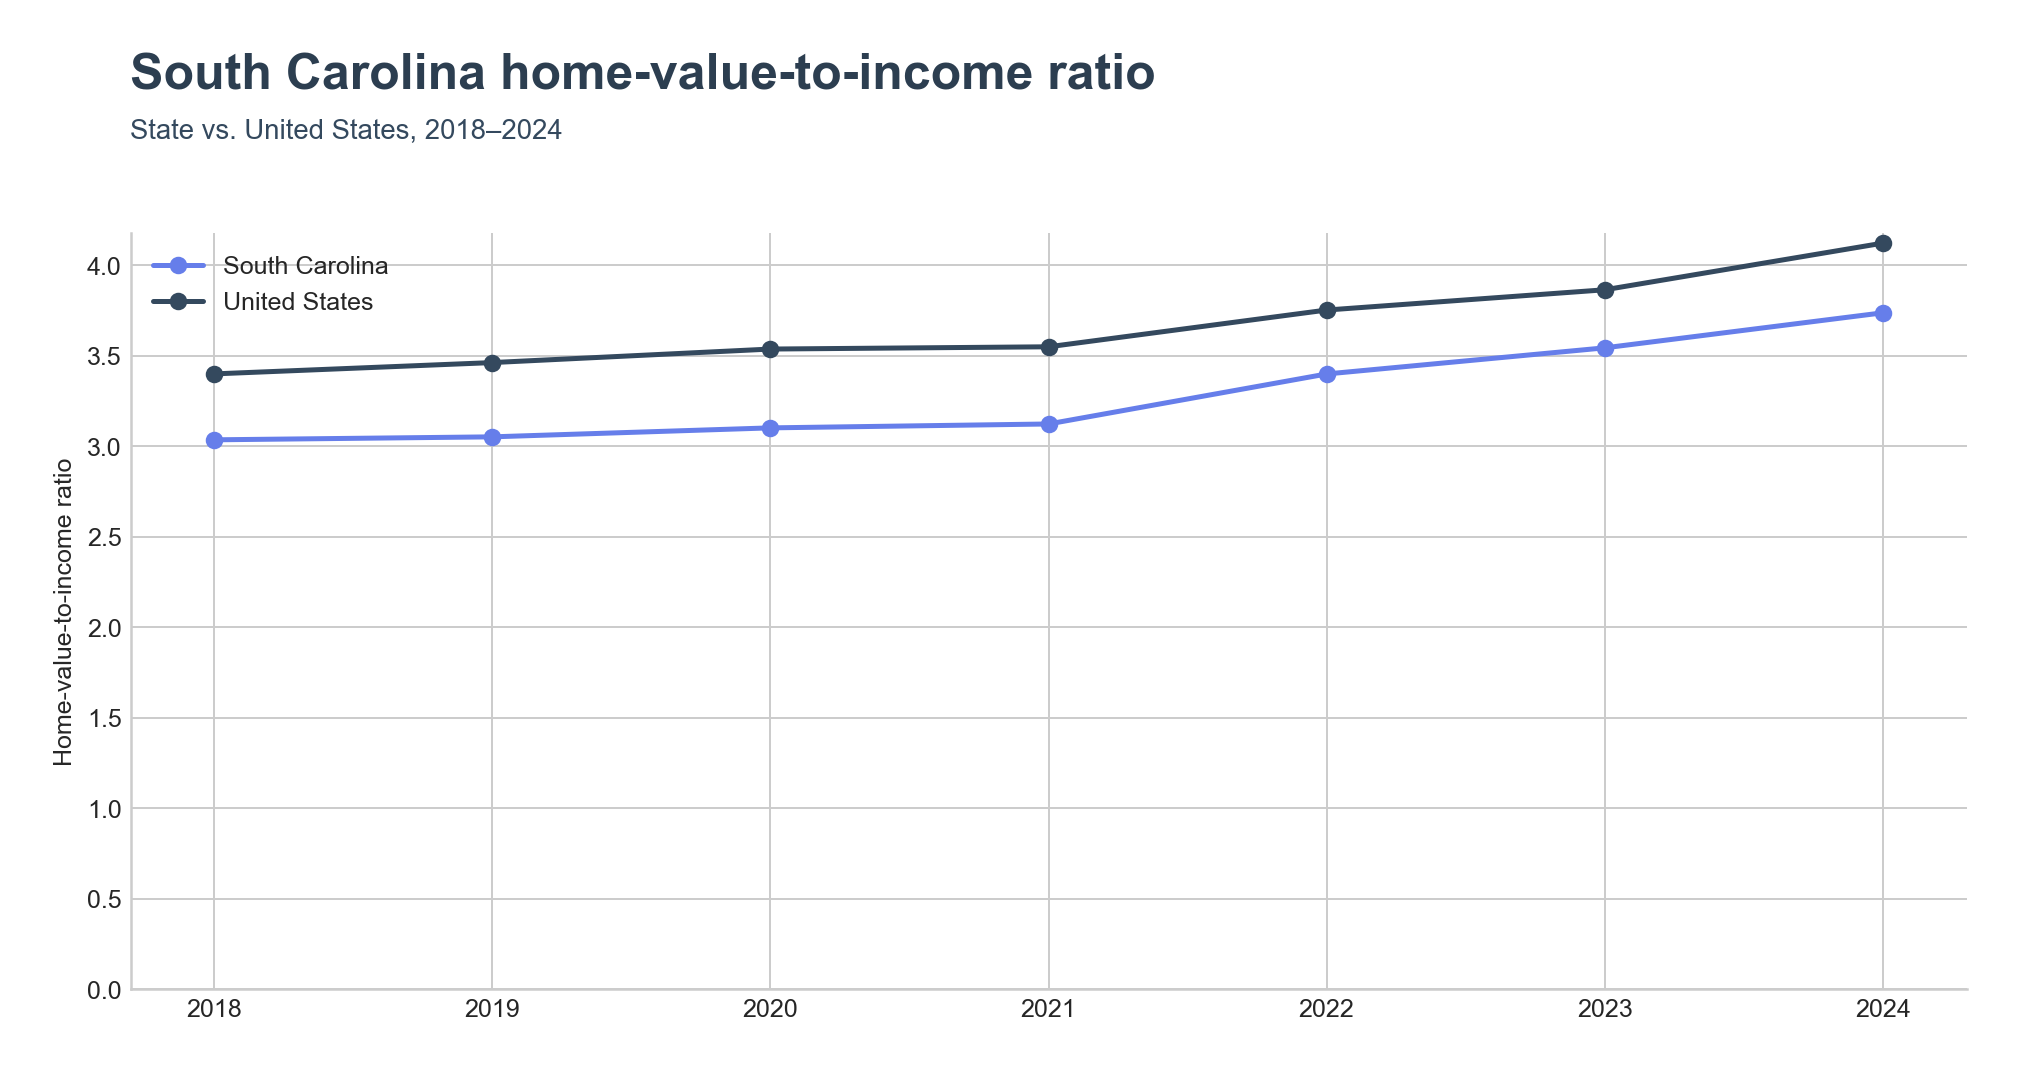
South Carolina's home-value-to-income ratio reached 3.74x in 2024, still below the US reference of 4.12x but climbing on the same slope. The state's ratio rose from 3.03x in 2018, driven by median home value moving from $154,800 to $259,000 while median household income moved from $51,015 to $69,324.
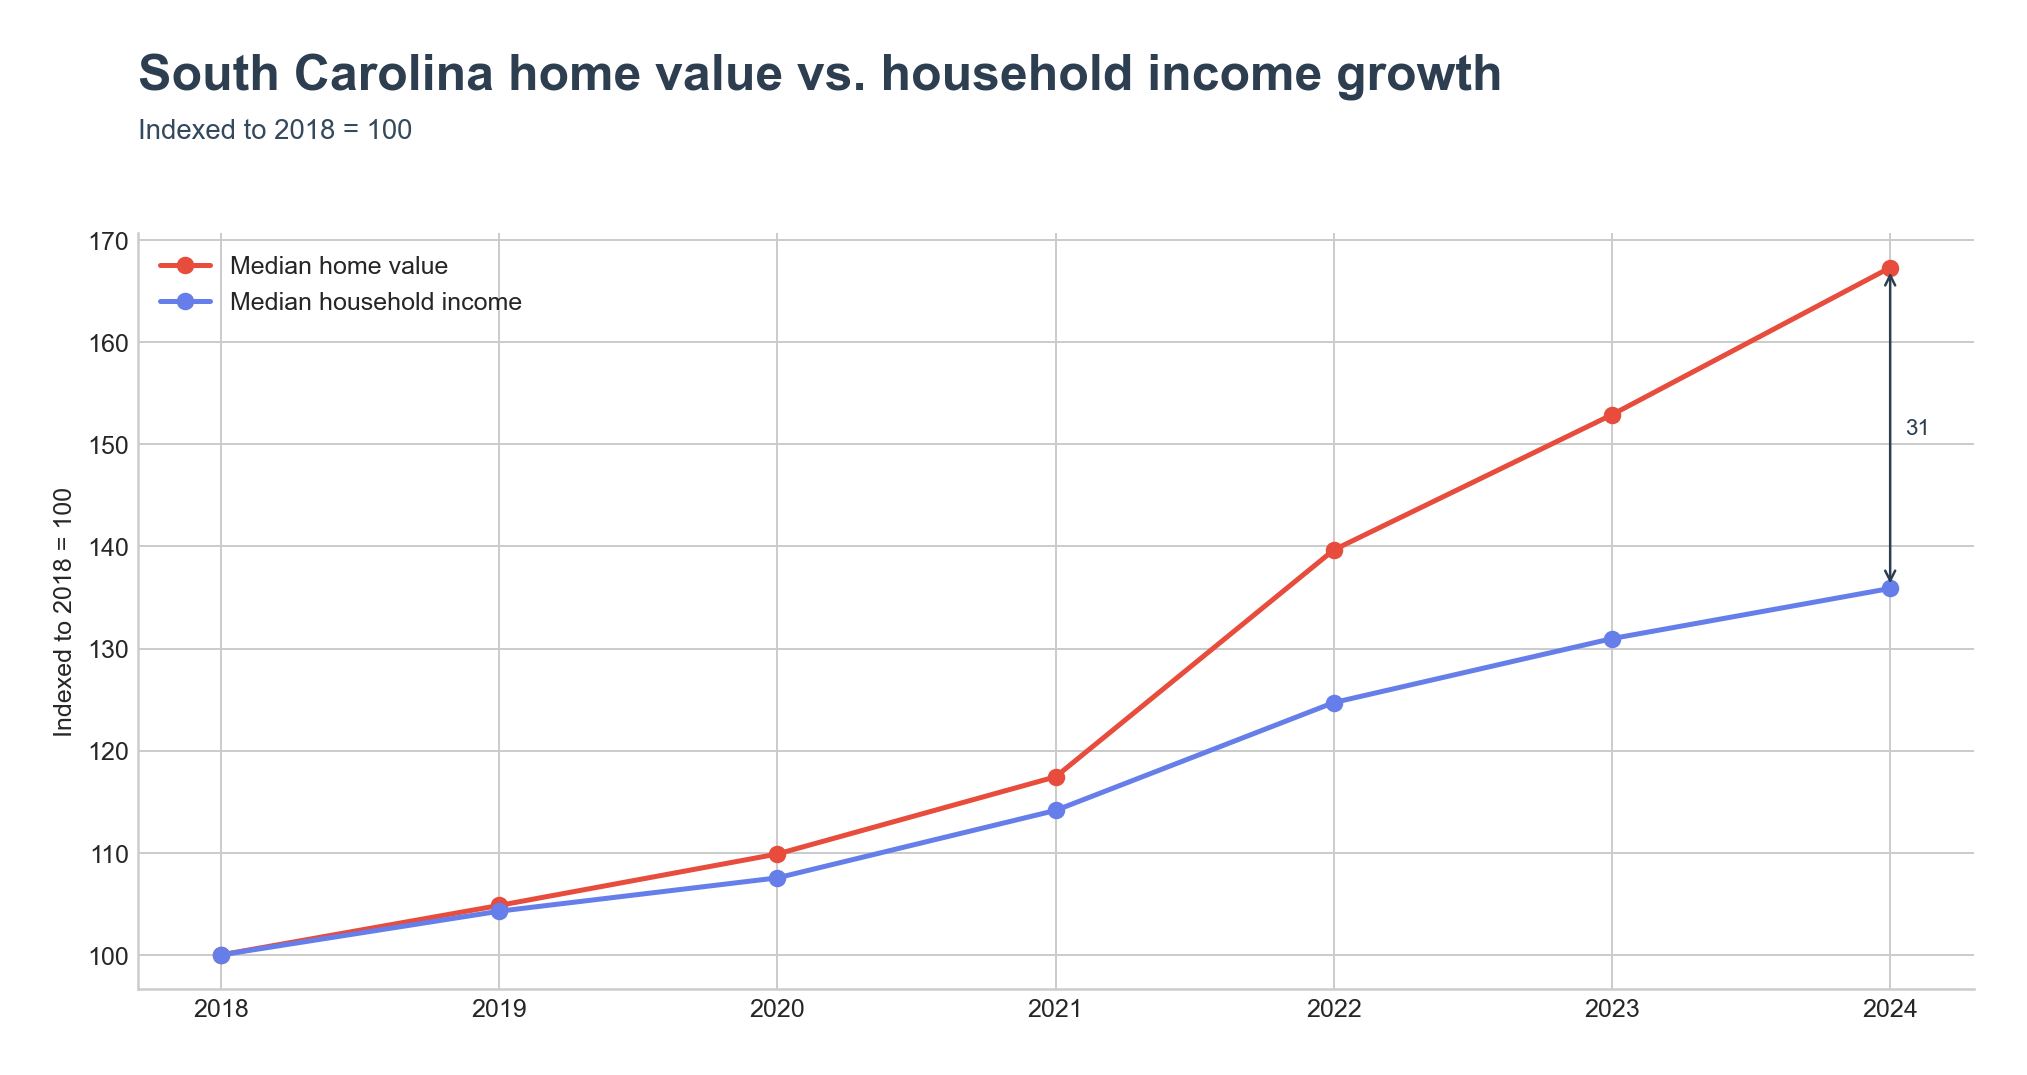
The indexed components map shows home values pulling well ahead of household income after 2020.
Where the ratio runs hottest
Clemson leads the state at 8.05x ($398,400 against $49,520), an Upstate university town where the Clemson University student population pulls down the income denominator against regional home values. Hilton Head Island follows at 7.26x on a $687,400 median home — the highest absolute home value in the top five — reflecting the island's status as a Lowcountry resort destination in Beaufort County . Greenville reaches 6.82x in the Upstate, Myrtle Beach posts 6.44x on the Grand Strand , and Hardeeville , just inland of Hilton Head, sits at 6.24x.
At the county level the pattern is almost entirely coastal. Charleston County leads at 5.53x ($489,100 / $88,494), followed by Beaufort County at 5.26x, Jasper County at 4.96x, Horry County — anchored by Myrtle Beach — at 4.30x, and Georgetown County at 4.21x. Every county above the state ratio sits on the coast.
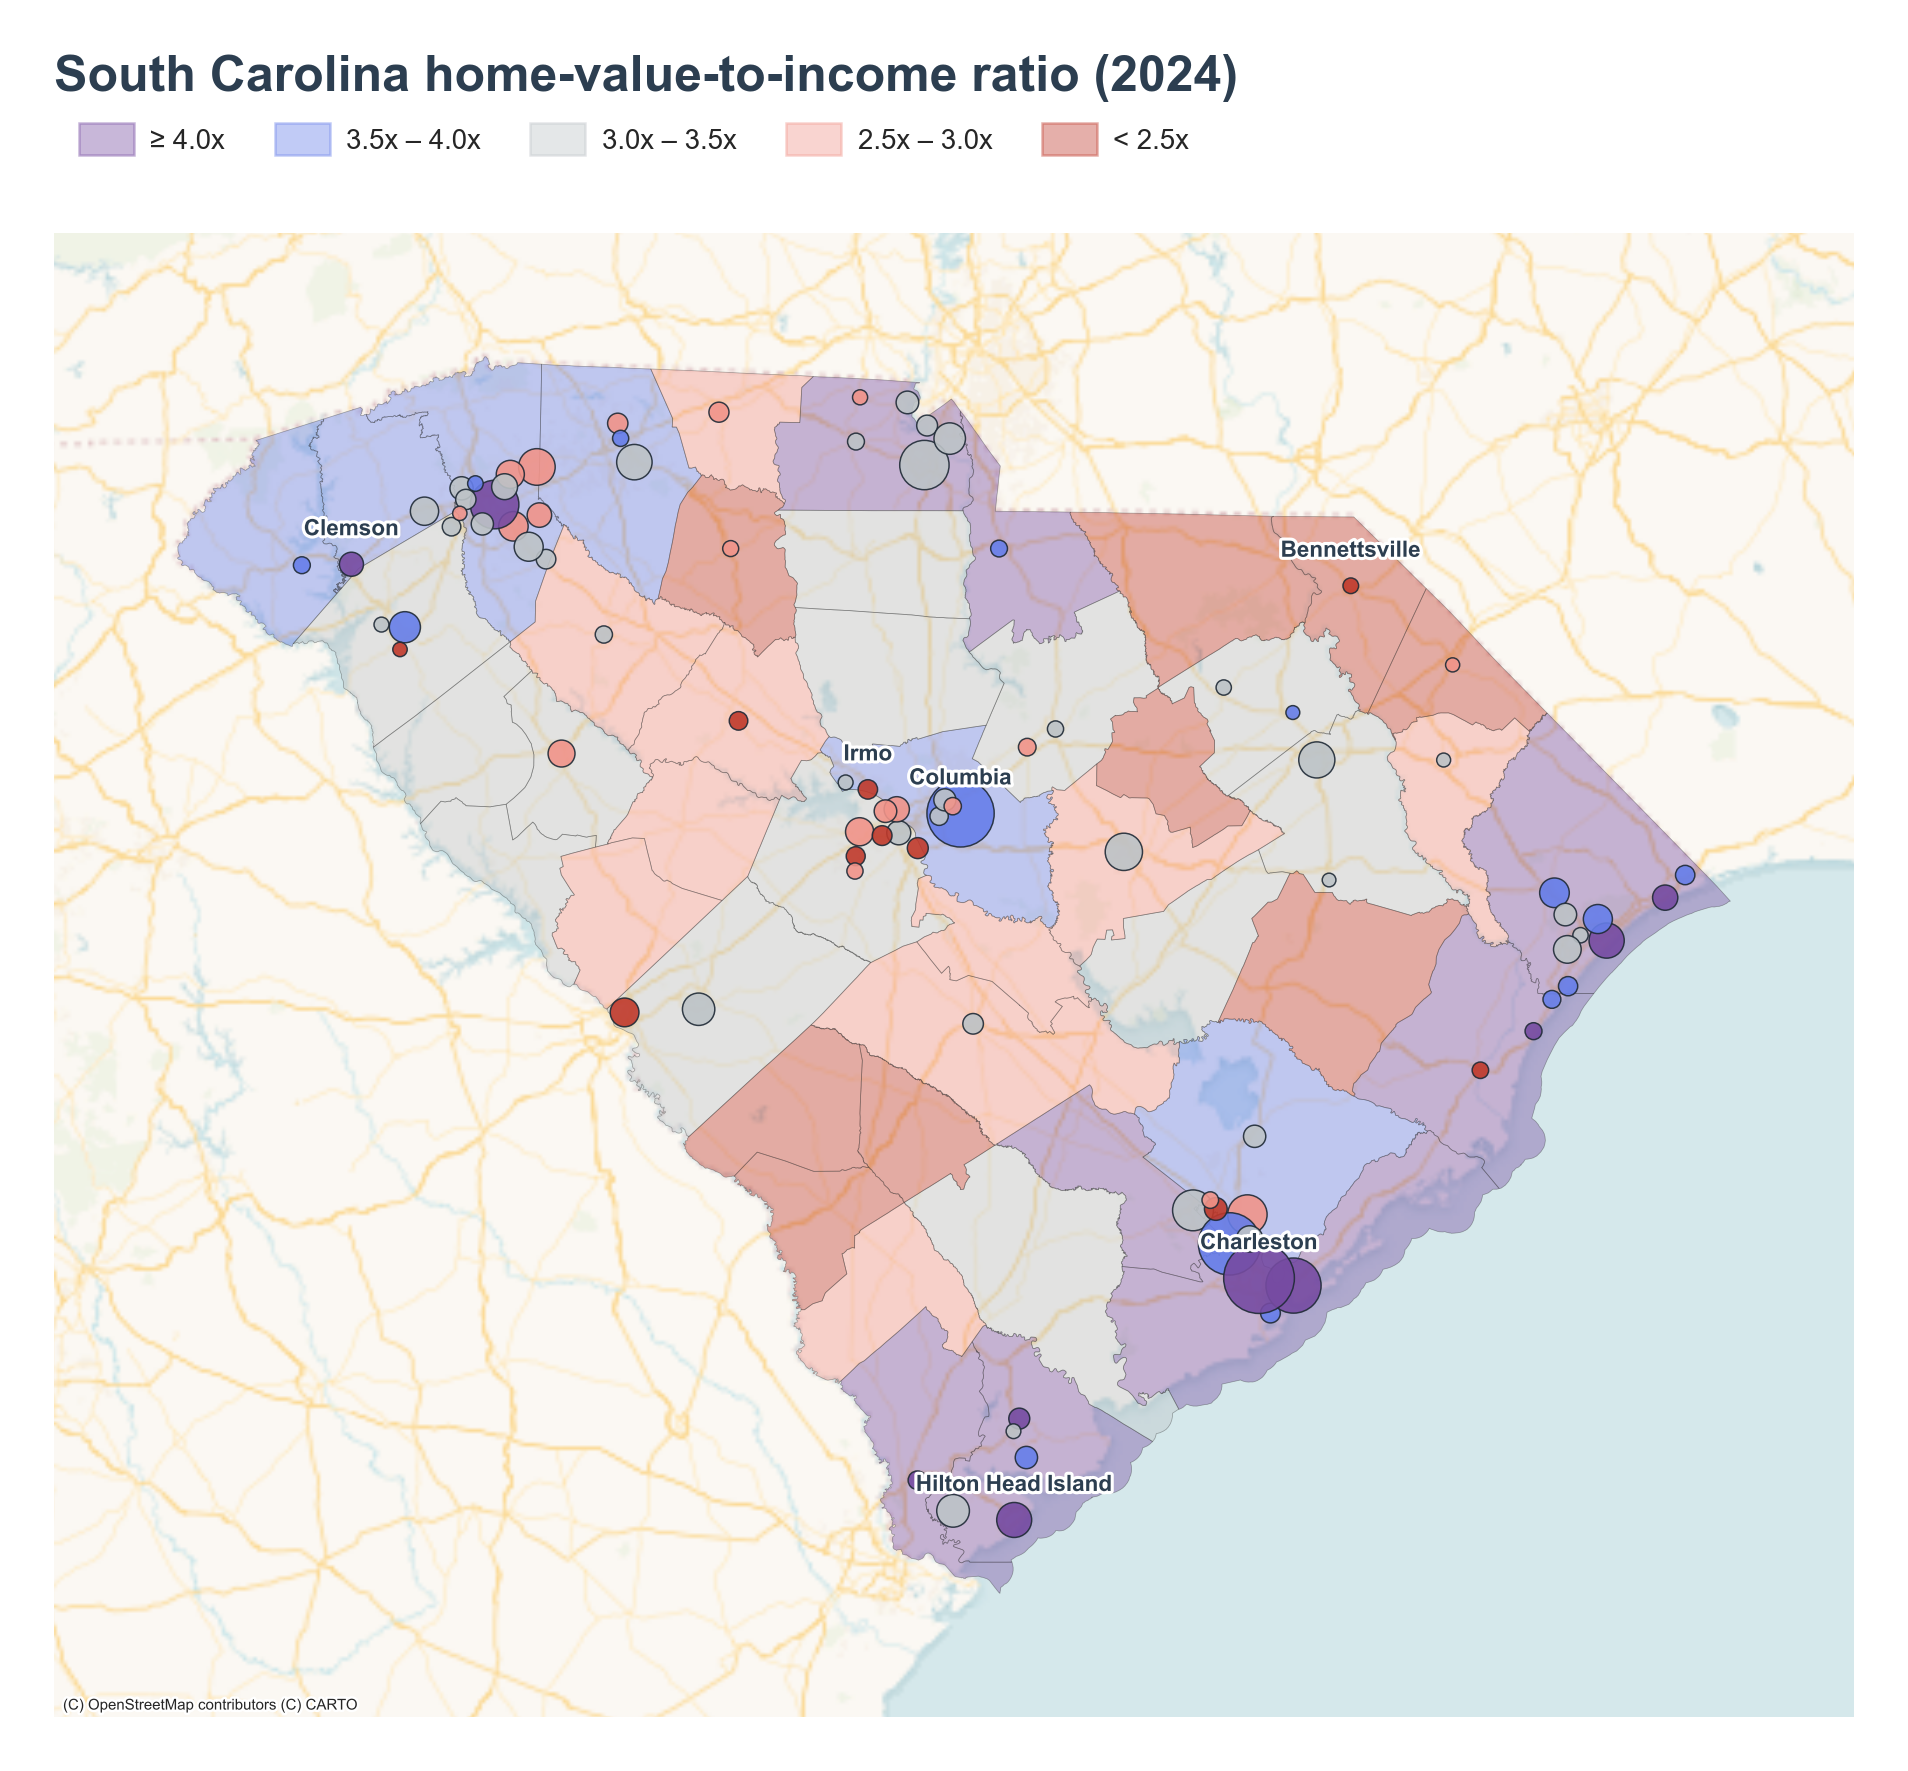
Where it runs coldest
The lowest-ratio places sit in the old textile, tobacco, and Midlands suburbs. Bennettsville , the seat of Marlboro County on the North Carolina border, bottoms the state at 2.48x ($92,100 / $37,115). Irmo , a Columbia suburb, posts 2.53x — but for the opposite reason, a $203,400 home value against an $80,489 income. Homeland Park near Anderson sits at 2.58x, Cayce just west of Columbia at 2.69x, and North Augusta on the Georgia border at 2.71x.
At the county level the bottom is rural and inland. Dillon County anchors the state at 1.83x ($85,400 / $46,605) in the Pee Dee region. Bamberg follows at 2.20x, Williamsburg at 2.26x, Barnwell at 2.27x, and Lee at 2.34x. These counties share low home values against modest incomes rather than affordability from high wages.
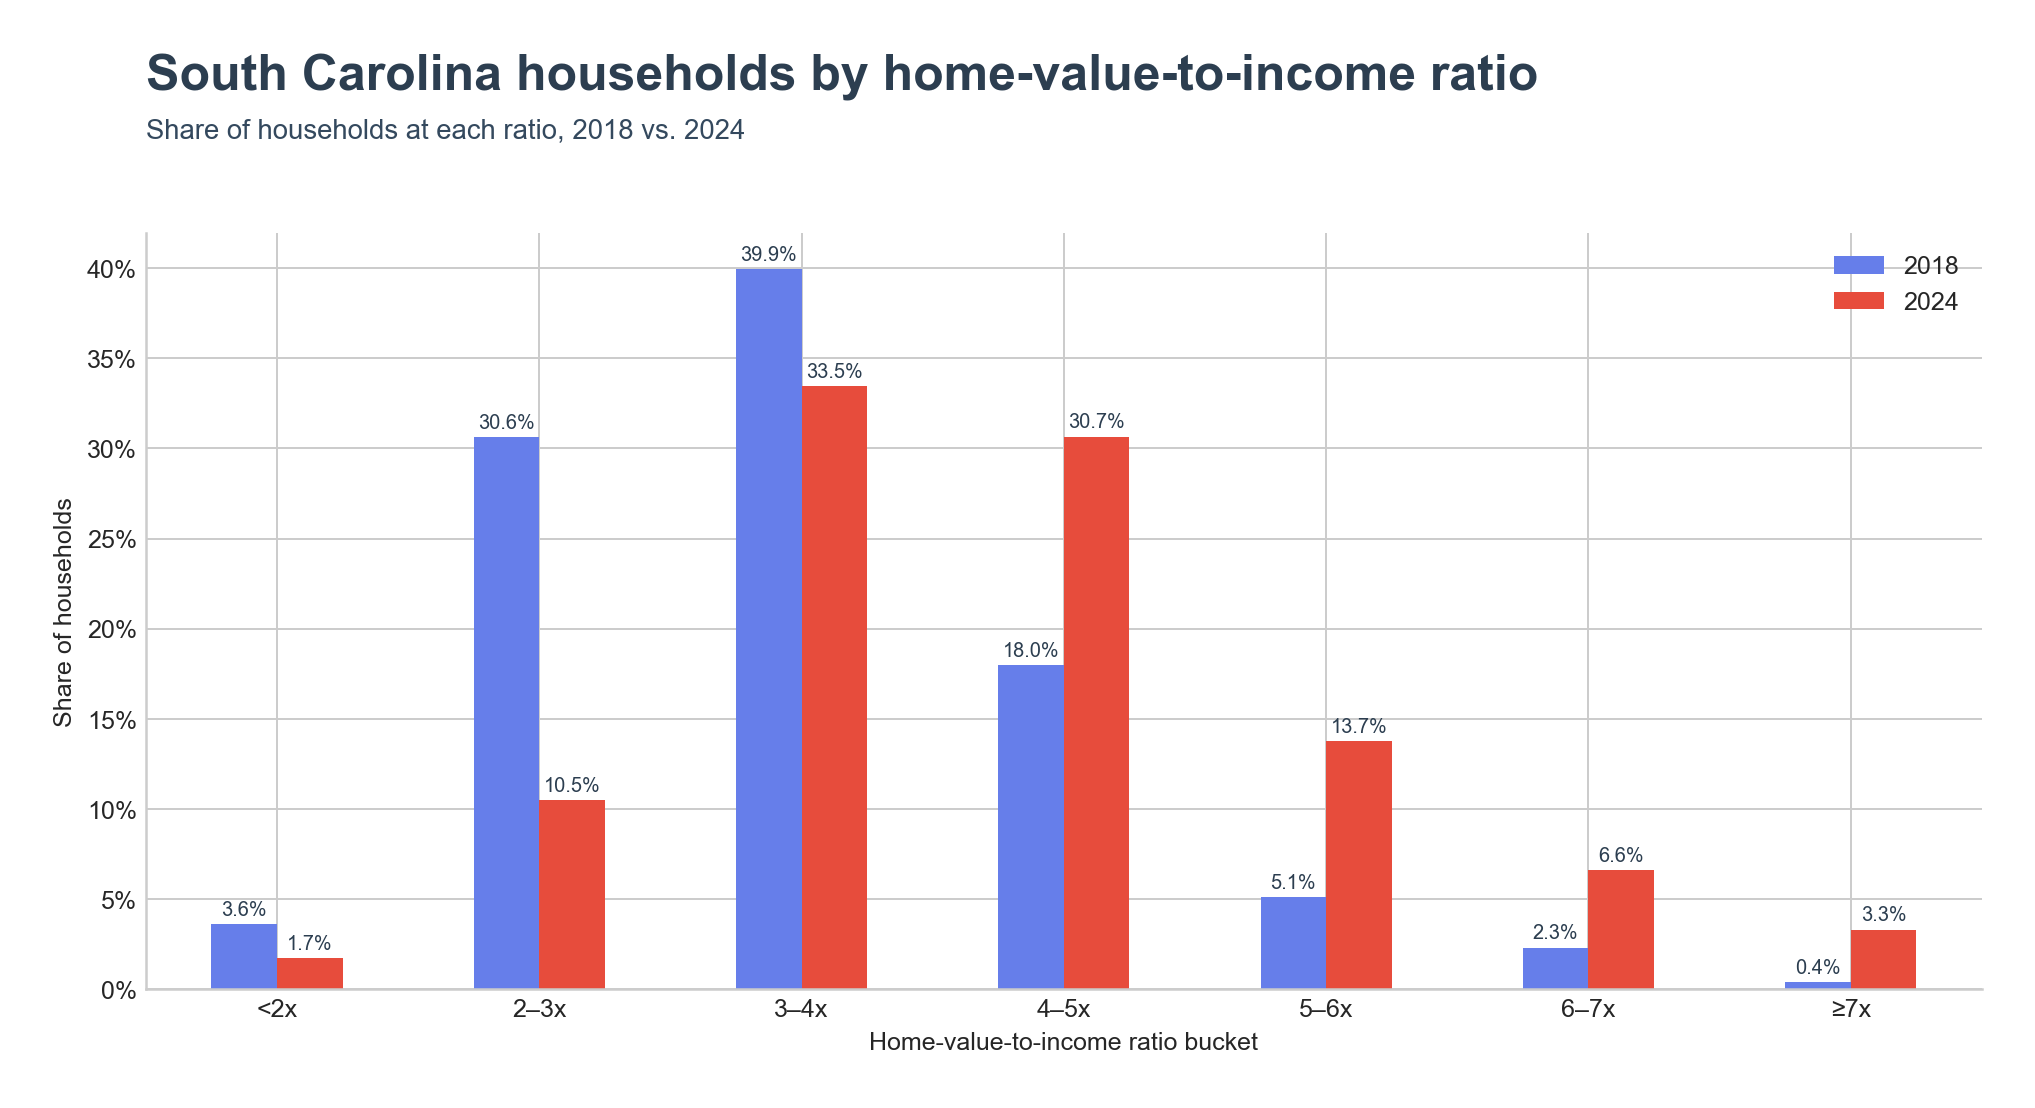
The distribution shift
The share of South Carolina households living in places at the 2–3x ratio fell from 30.6% in 2018 to 10.5% in 2024 — the single largest movement on the chart. The mass moved up: the 3–4x band edged from 39.9% to 33.5%, the 4–5x band grew from 18.0% to 30.7%, the 5–6x band more than doubled from 5.1% to 13.7%, the 6–7x band rose from 2.3% to 6.6%, and the ≥7x bucket grew from 0.4% to 3.3%. The <2x bucket shrank from 3.6% to 1.7%.
Key Takeaways
- South Carolina's home-value-to-income ratio rose from 3.03x in 2018 to 3.74x in 2024, against a US figure of 4.12x.
- Median home value moved from $154,800 to $259,000 while median household income moved from $51,015 to $69,324.
- Clemson tops the state at 8.05x, with university-town income compression against regional home values.
- Coastal counties — Charleston (5.53x), Beaufort (5.26x), Jasper (4.96x), Horry (4.30x), Georgetown (4.21x) — account for every county above the state ratio.
- Dillon County anchors the bottom at 1.83x, with the lowest-ratio places clustering in the Pee Dee and inland border counties.
- The 4–5x band grew from 18.0% of households in 2018 to 30.7% in 2024, the largest single band in the state today.