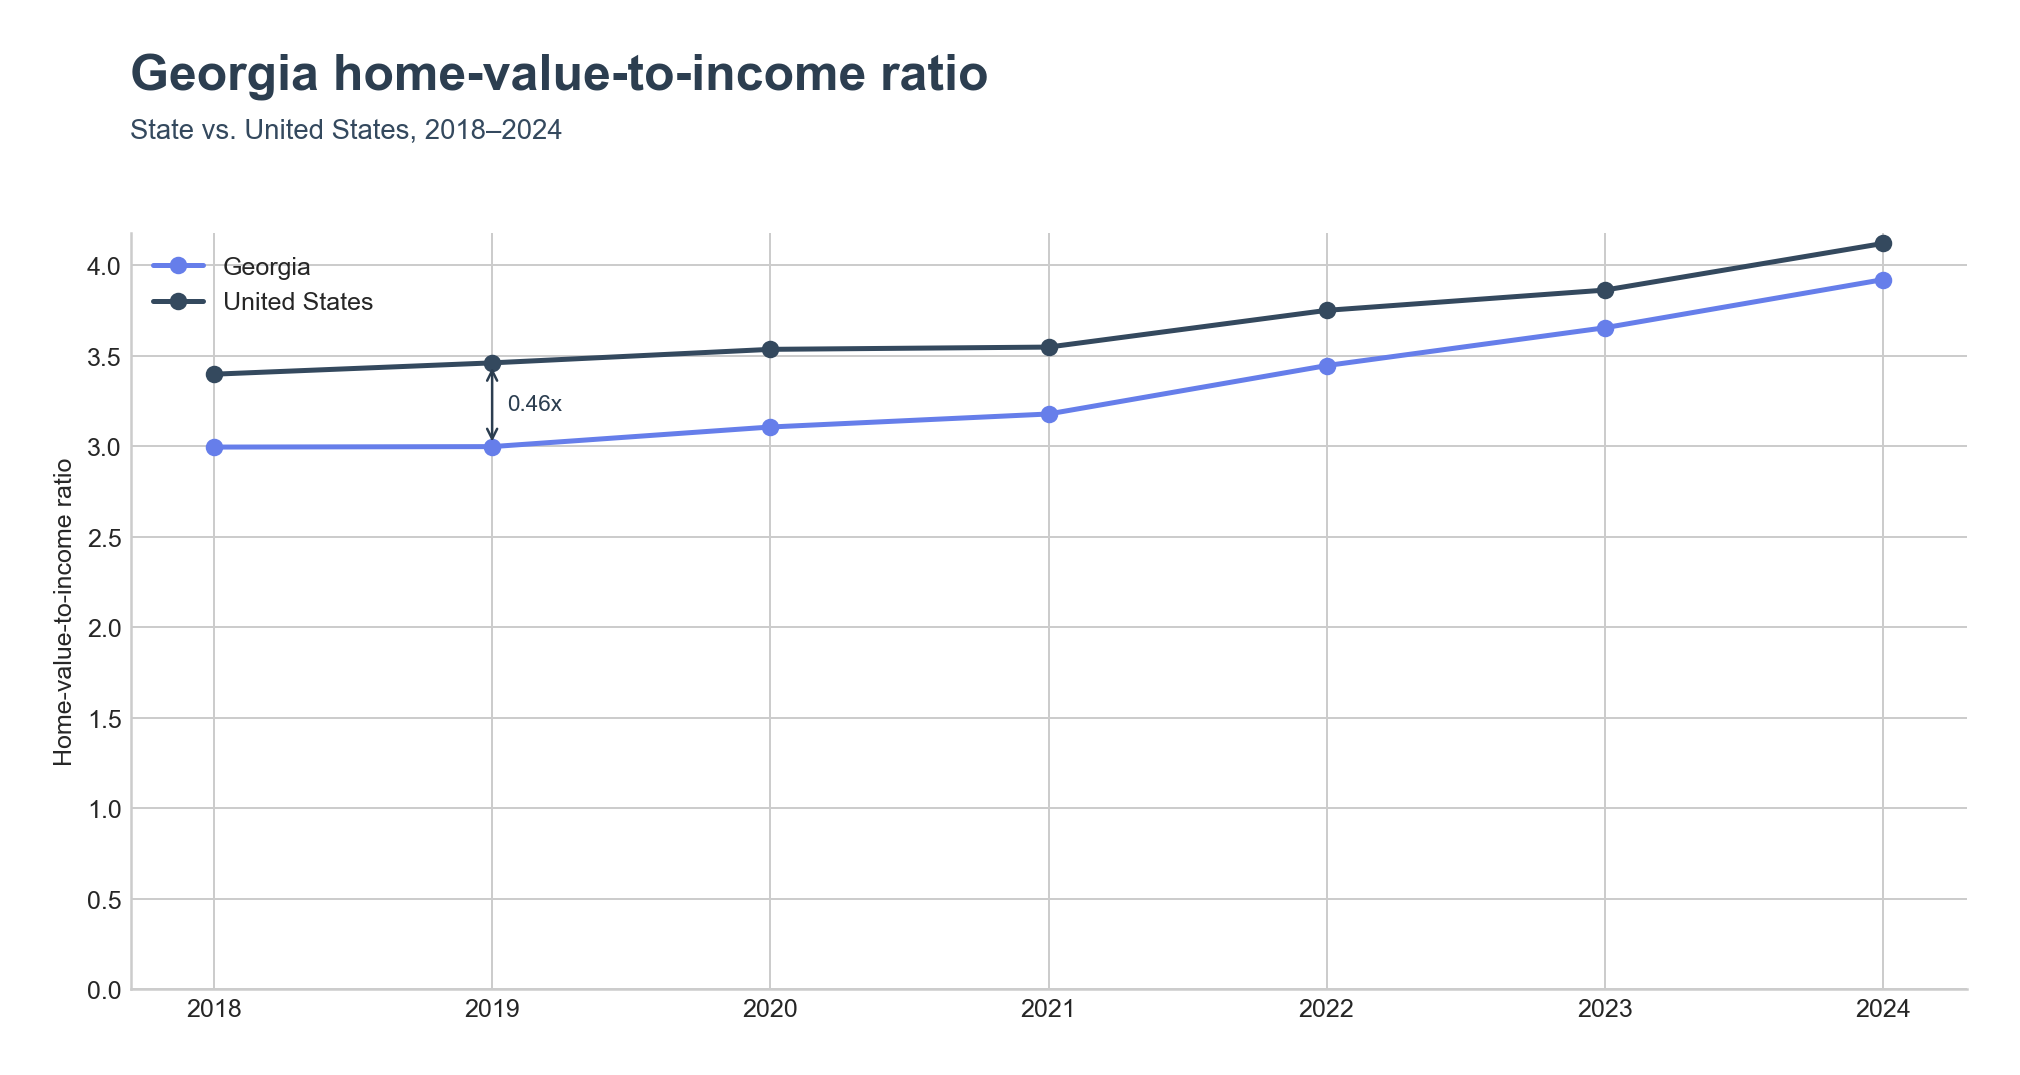
Georgia's home-value-to-income ratio reached 3.92x in 2024, still below the US reference of 4.12x but climbing on the same trajectory. The gap that stood at 0.46x in 2019 has narrowed as Georgia's ratio rose from 3.00x in 2018 — a six-year shift driven by median home value jumping from $166,800 to $303,300 while median household income moved from $55,679 to only $77,353.
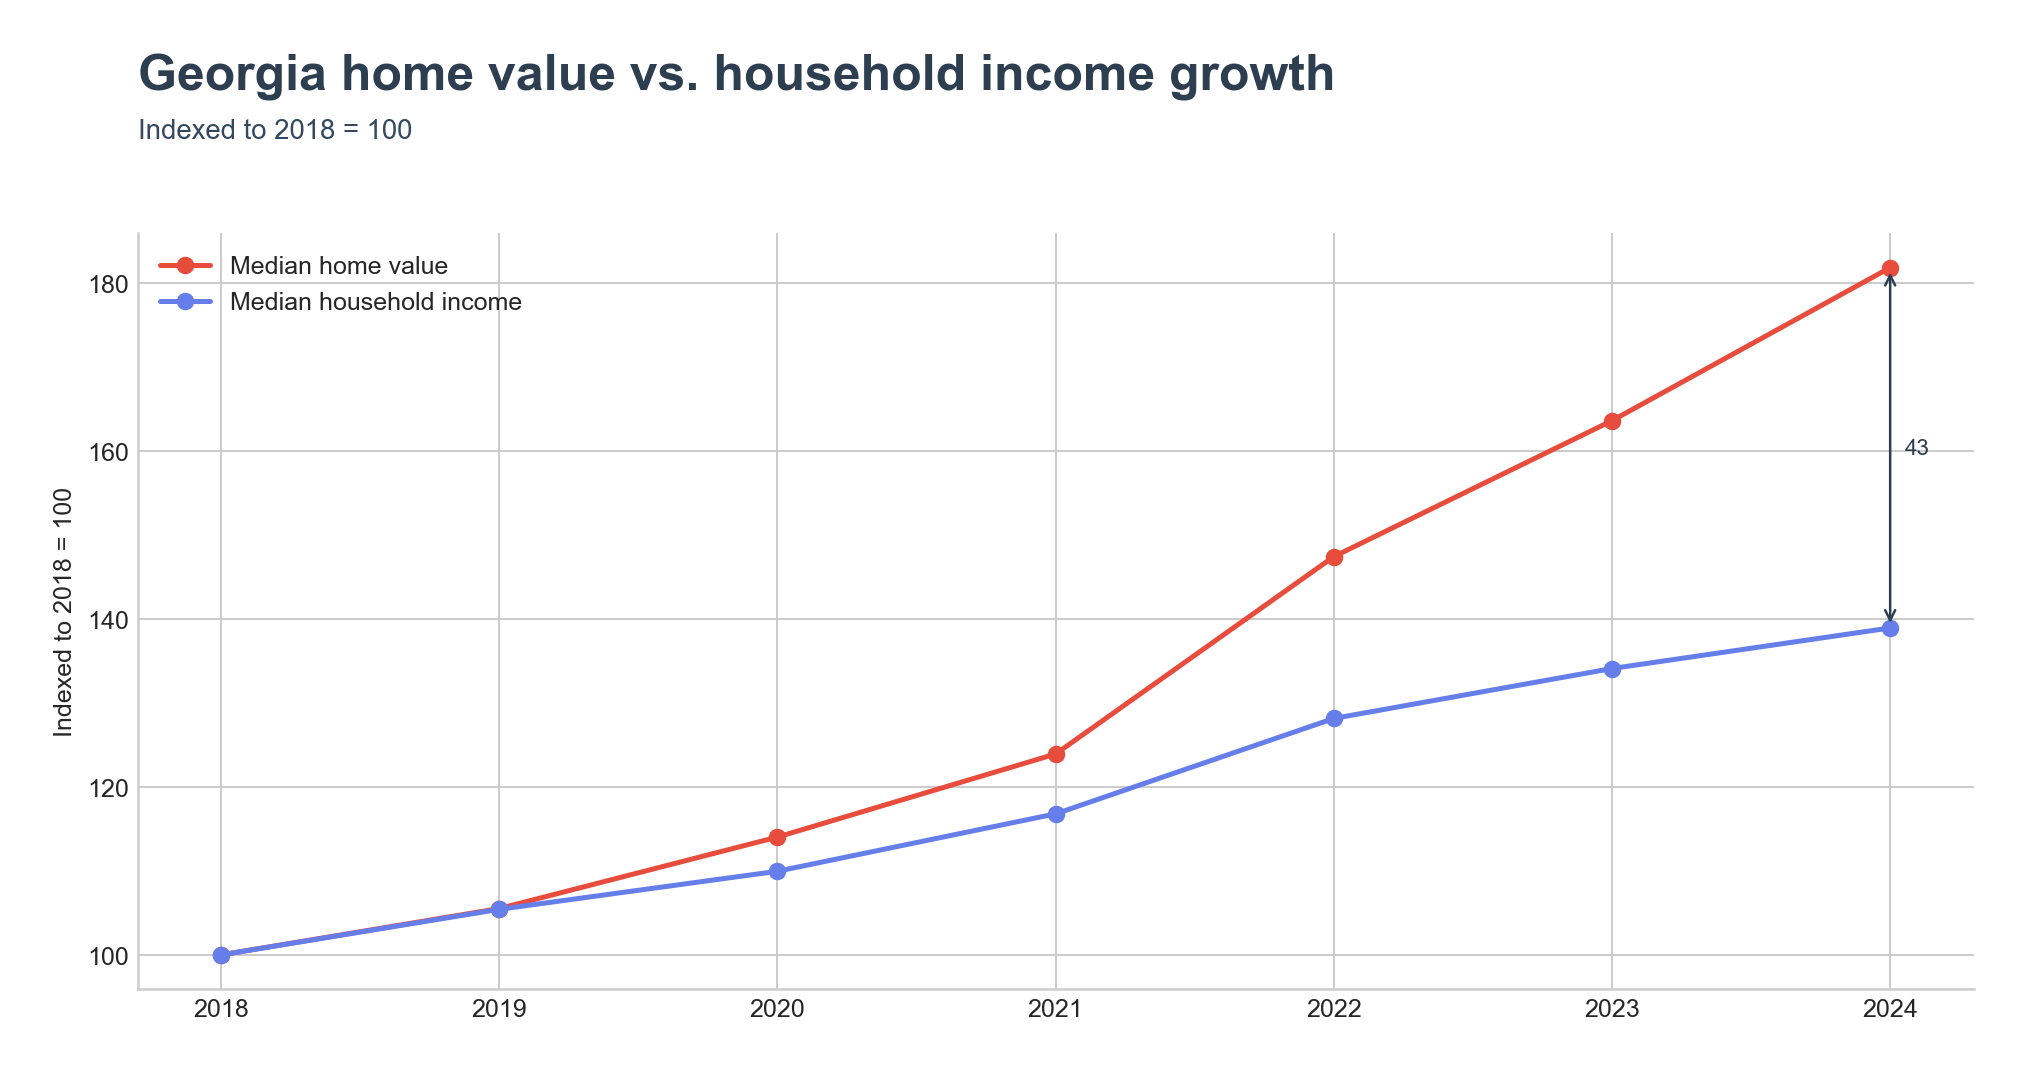
Indexed to 2018, Georgia home values reached 182 by 2024 while household income reached 139 — a 43-point spread that opened sharply after 2020.
Where the ratio runs hottest
Five places top the state, all inside metro Atlanta. Vinings leads at 6.37x ($604,600 against $94,982), an affluent Cobb County community just northwest of the city. College Park follows at 6.31x, where a $325,800 median home sits against a $51,635 median income — the ratio is driven more by lower incomes near Hartsfield-Jackson than by luxury pricing. Clarkston , a DeKalb County refugee-resettlement hub, posts 6.23x on $302,600 / $48,564. Marietta reaches 6.17x and Druid Hills — home to Emory University — hits 6.10x on a $793,200 median home.
At the county level the pattern splits. Clarke County (Athens, home to the University of Georgia) leads at 5.57x, where student-heavy renter incomes depress the denominator against a $298,900 median home. The next three — Fannin at 5.37x, Towns at 5.35x, and Union at 4.65x — sit along Georgia's northern Blue Ridge edge, where second-home and retirement demand pushes home values well above local wage income. Fulton County , the Atlanta core, comes in at 4.81x.
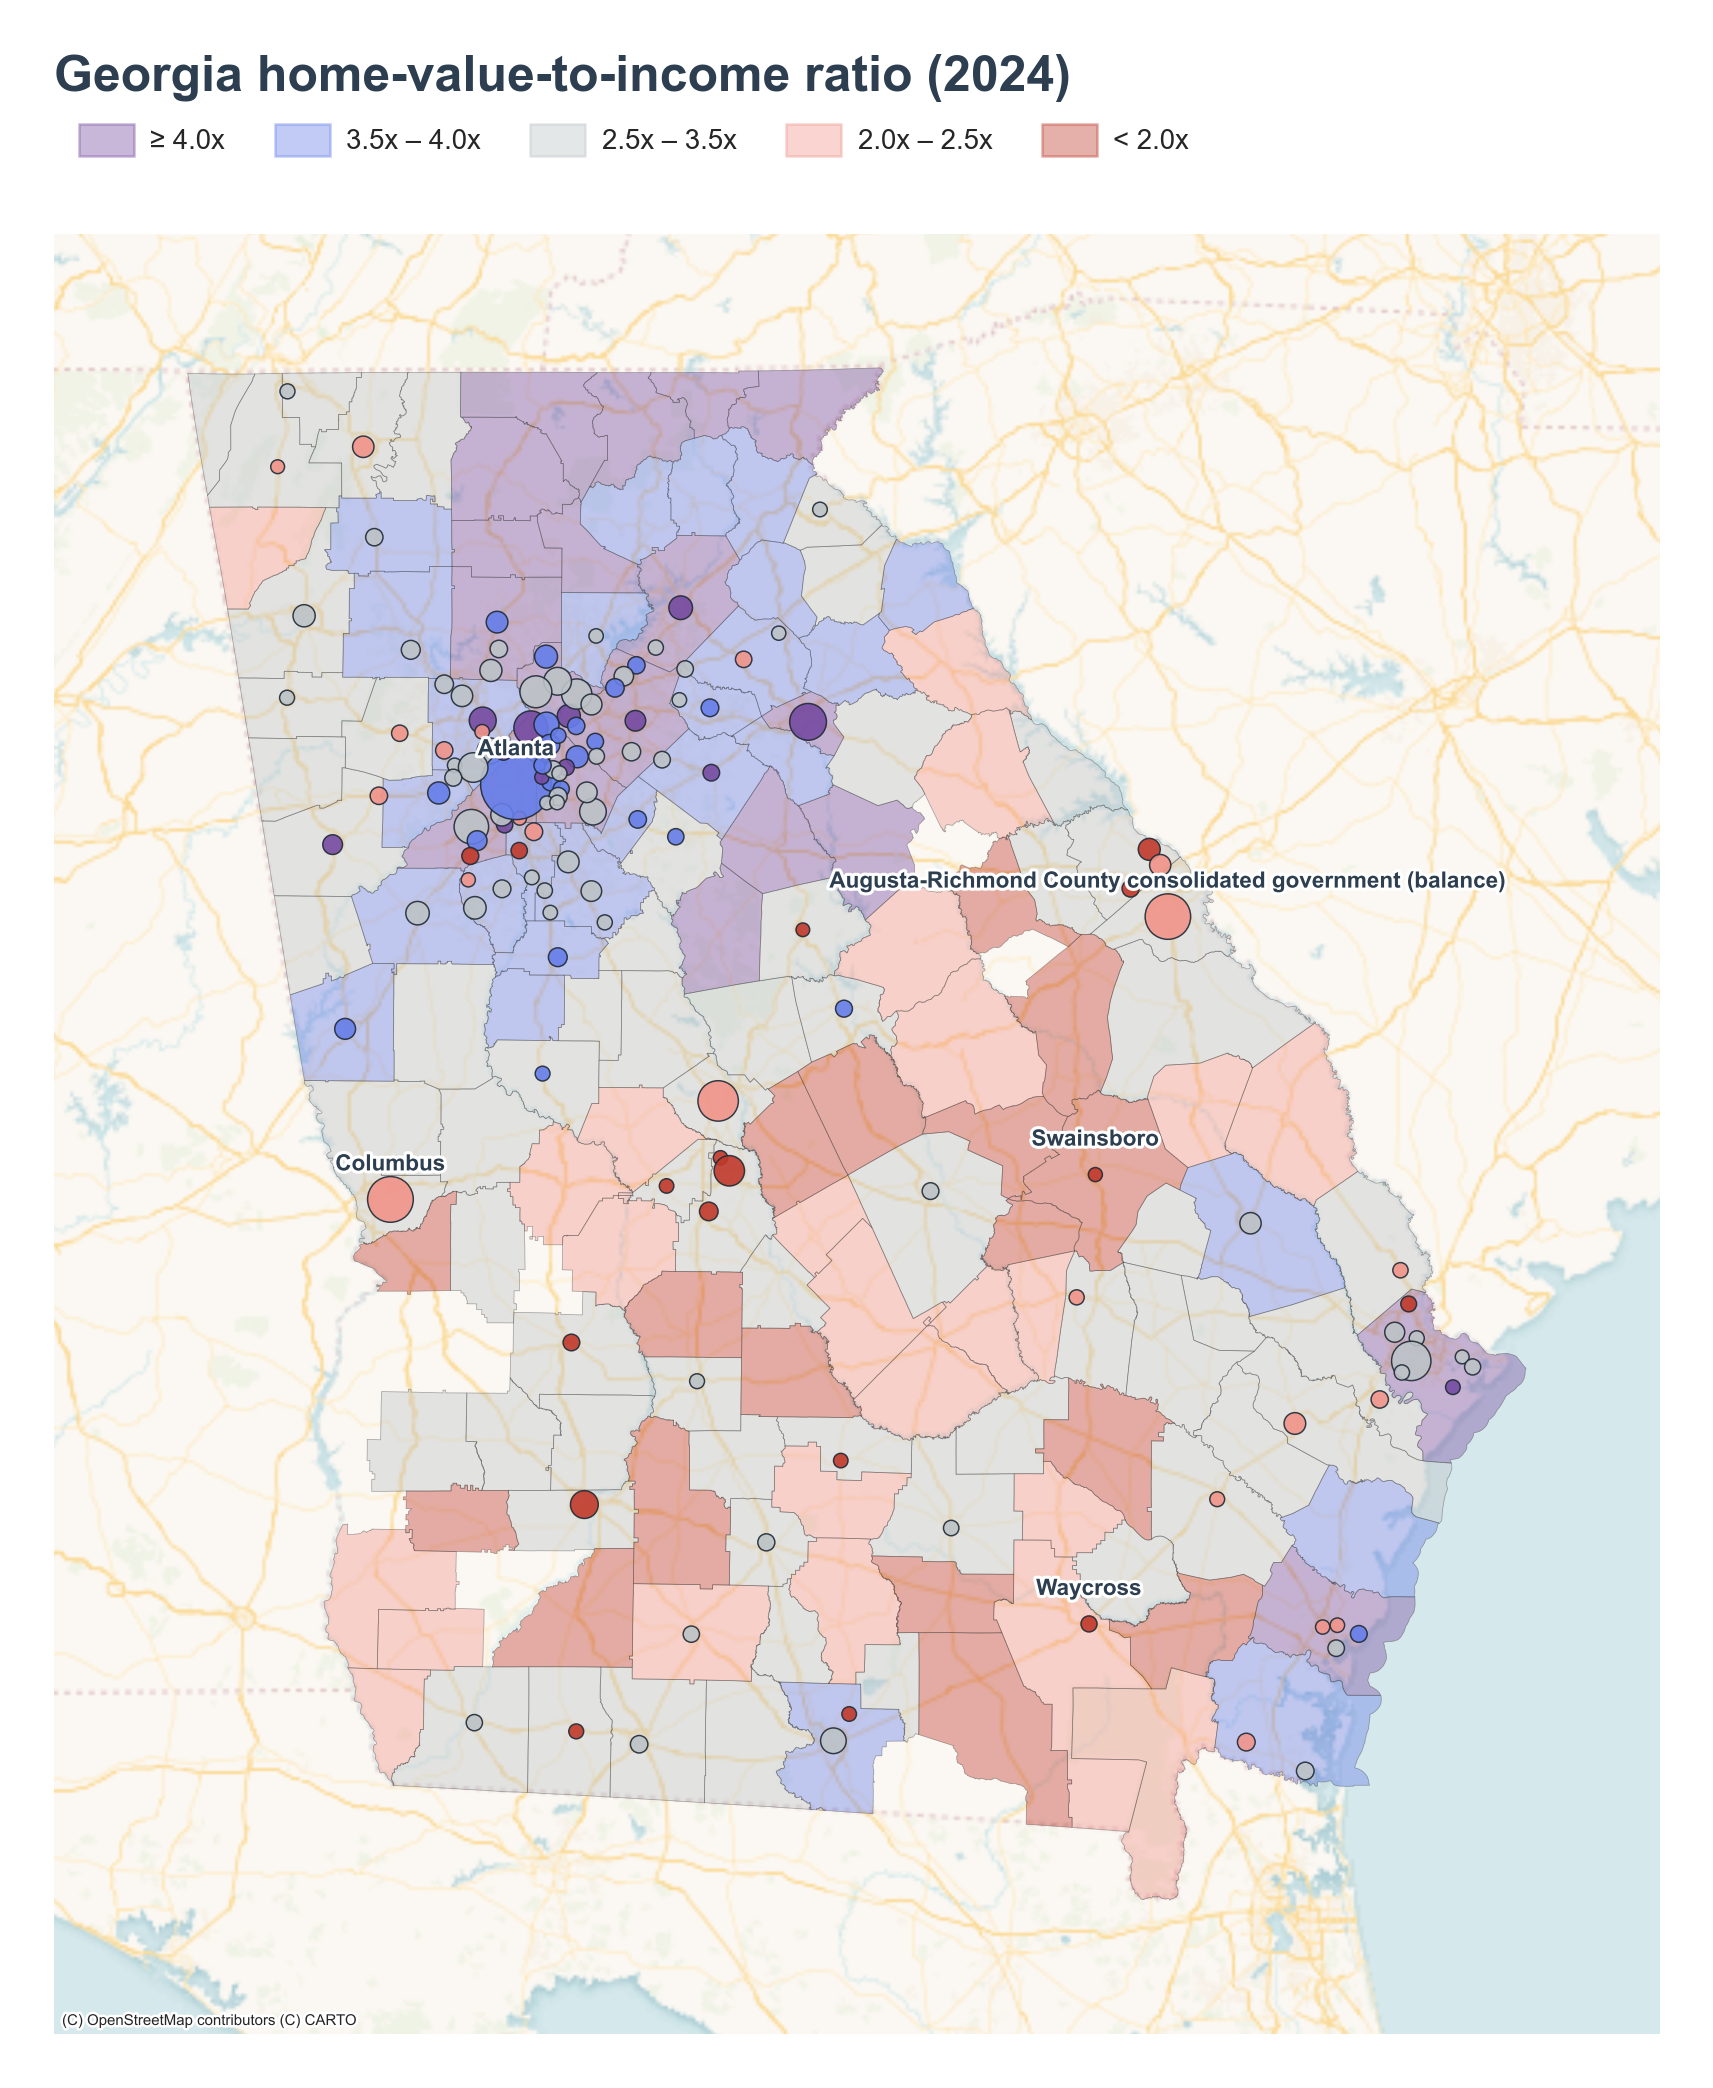
Where it runs coldest
The lowest-ratio places sit in rural south and east Georgia. Waycross in Ware County posts 2.20x on an $84,100 median home. Swainsboro , the Emanuel County seat, ties at 2.20x. Bemiss near Moody Air Force Base in Lowndes County registers 2.34x, Fort Valley 2.53x, and Albany — the largest city in southwest Georgia — 2.63x.
At the county level the bottom is even lower. Warren County in east-central Georgia bottoms the state at 1.52x ($67,100 / $44,289). Wilcox follows at 1.62x, Appling at 1.64x, Chattahoochee County — adjacent to Fort Moore — at 1.68x, and Brantley at 1.71x. These counties share low home values, not high incomes.
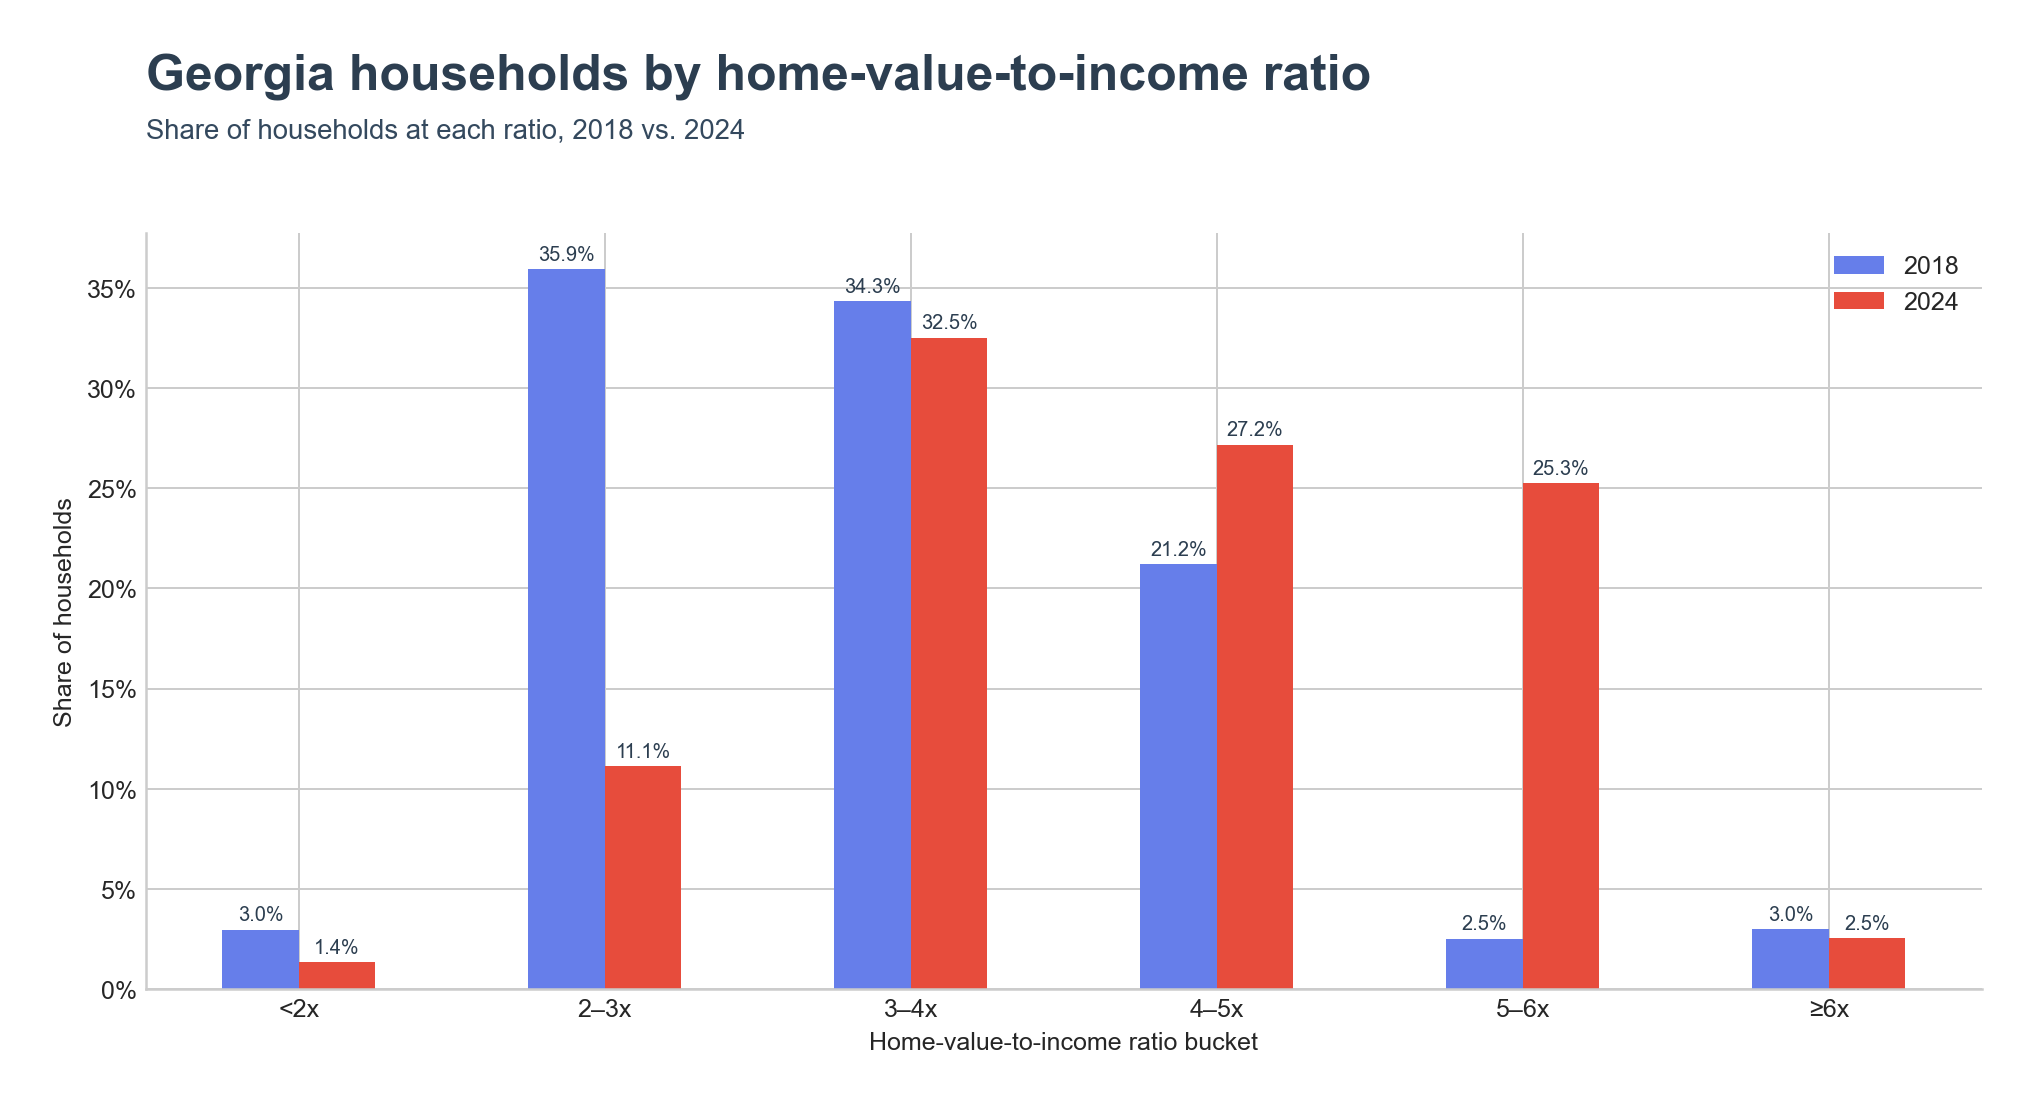
The distribution shift
The share of Georgia households living in places at the 2–3x ratio fell from 35.9% in 2018 to 11.1% in 2024. The mass moved up: the 3–4x band stayed near steady at 34.3% to 32.5%, the 4–5x band grew from 21.2% to 27.2%, and the 5–6x band — barely a sliver at 2.5% in 2018 — now holds 25.3% of households.
Key Takeaways
- Georgia's home-value-to-income ratio rose from 3.00x in 2018 to 3.92x in 2024, narrowing the gap to the US reference of 4.12x.
- Median home value grew 82% since 2018 while median household income grew only 39%, opening a 43-point indexed spread.
- The top of the state splits between metro Atlanta places (Vinings 6.37x, College Park 6.31x, Clarkston 6.23x) and north Georgia mountain counties (Fannin 5.37x, Towns 5.35x) where second-home demand outruns local wages.
- The bottom sits in rural south and east Georgia: Warren County hits 1.52x on a $67,100 median home value and Waycross 2.20x on $84,100.
- The share of households in places under a 3x ratio fell from 38.9% in 2018 to 12.5% in 2024, with the 5x-and-up bands expanding from 5.5% to 27.8%.
- If you take away one thing: Georgia is still cheaper than the country on paper, but six years of home values outpacing wages have shifted most of its households into ratio bands that barely existed in 2018.