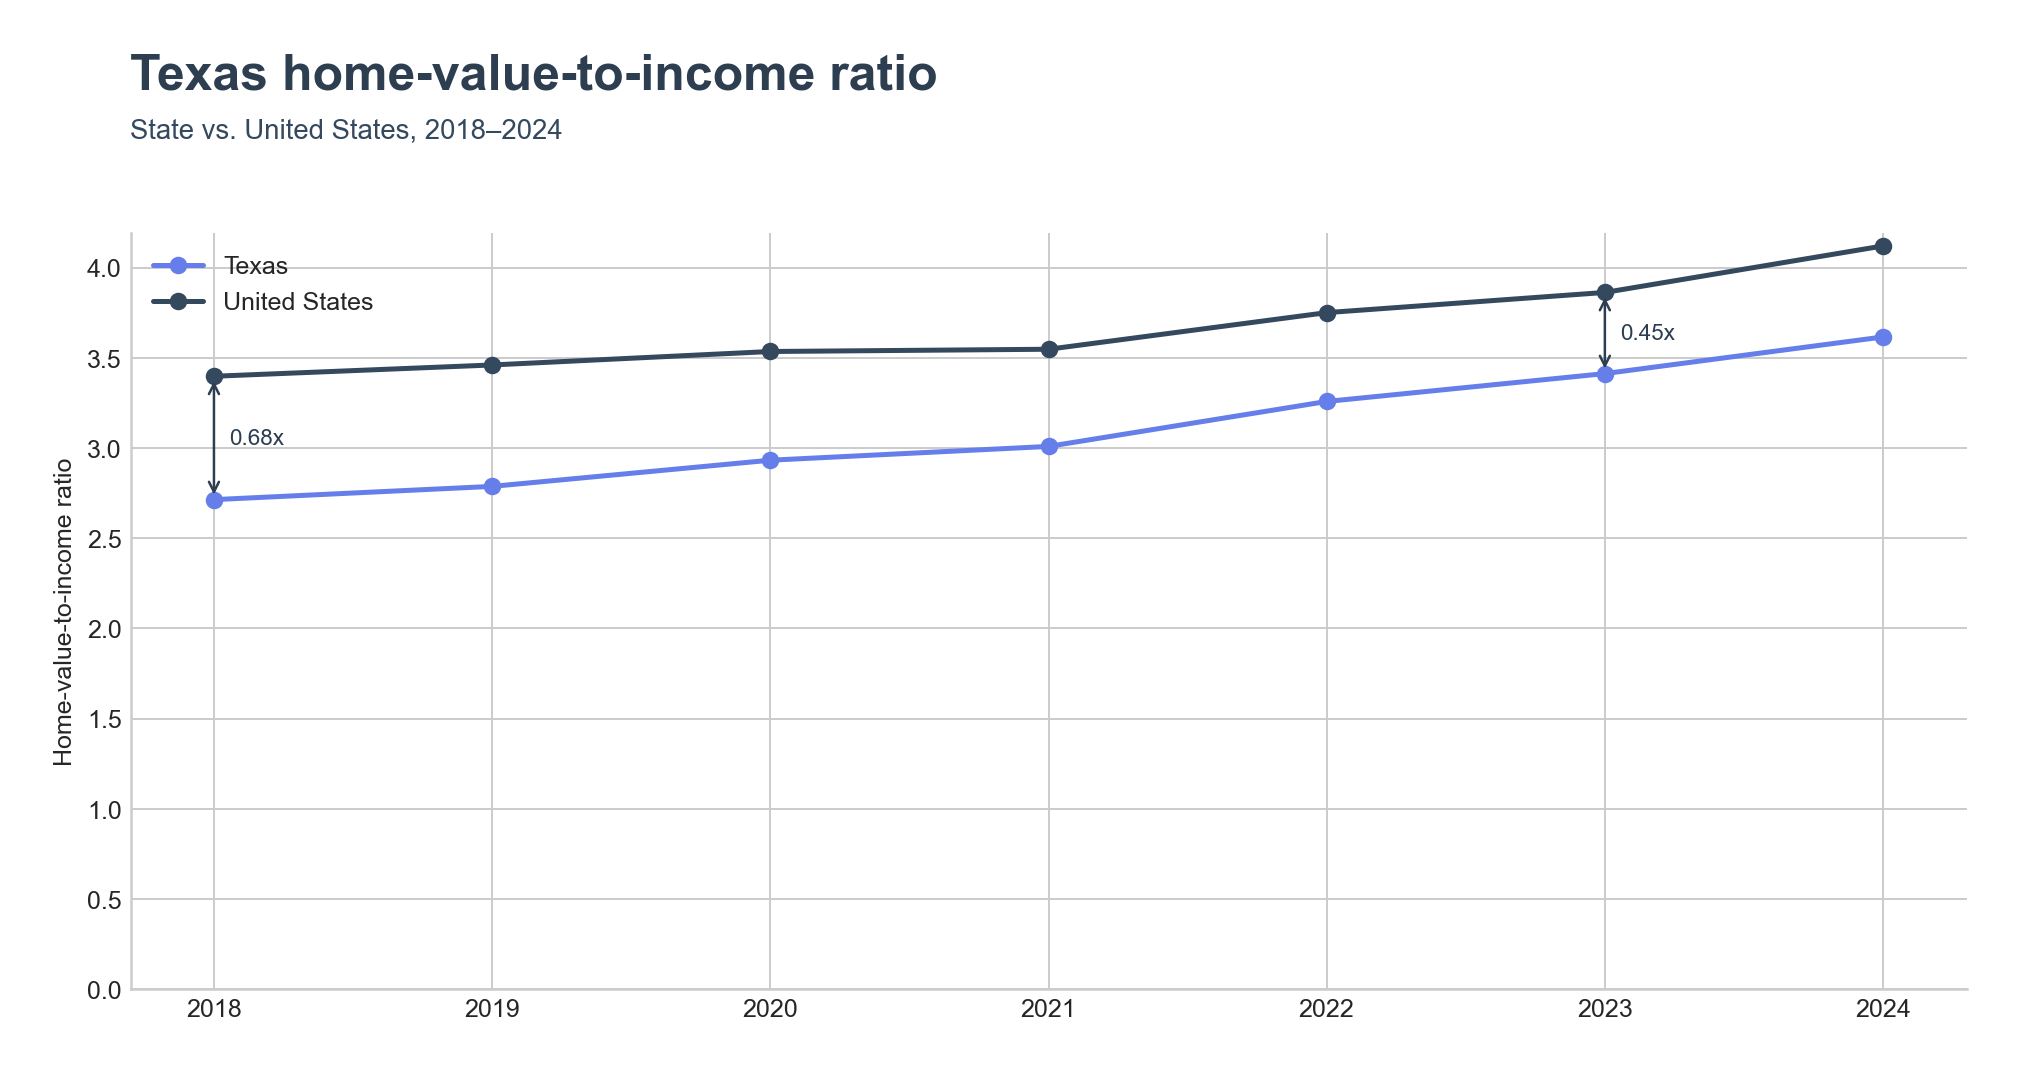
Texas ended 2024 with a home-value-to-income ratio of 3.62x, still below the United States figure of 4.12x. The gap was wider in 2018 — Texas at 2.71x against a national 3.40x, a 0.68x spread — and has narrowed to 0.45x as Texas housing costs caught up faster than incomes.
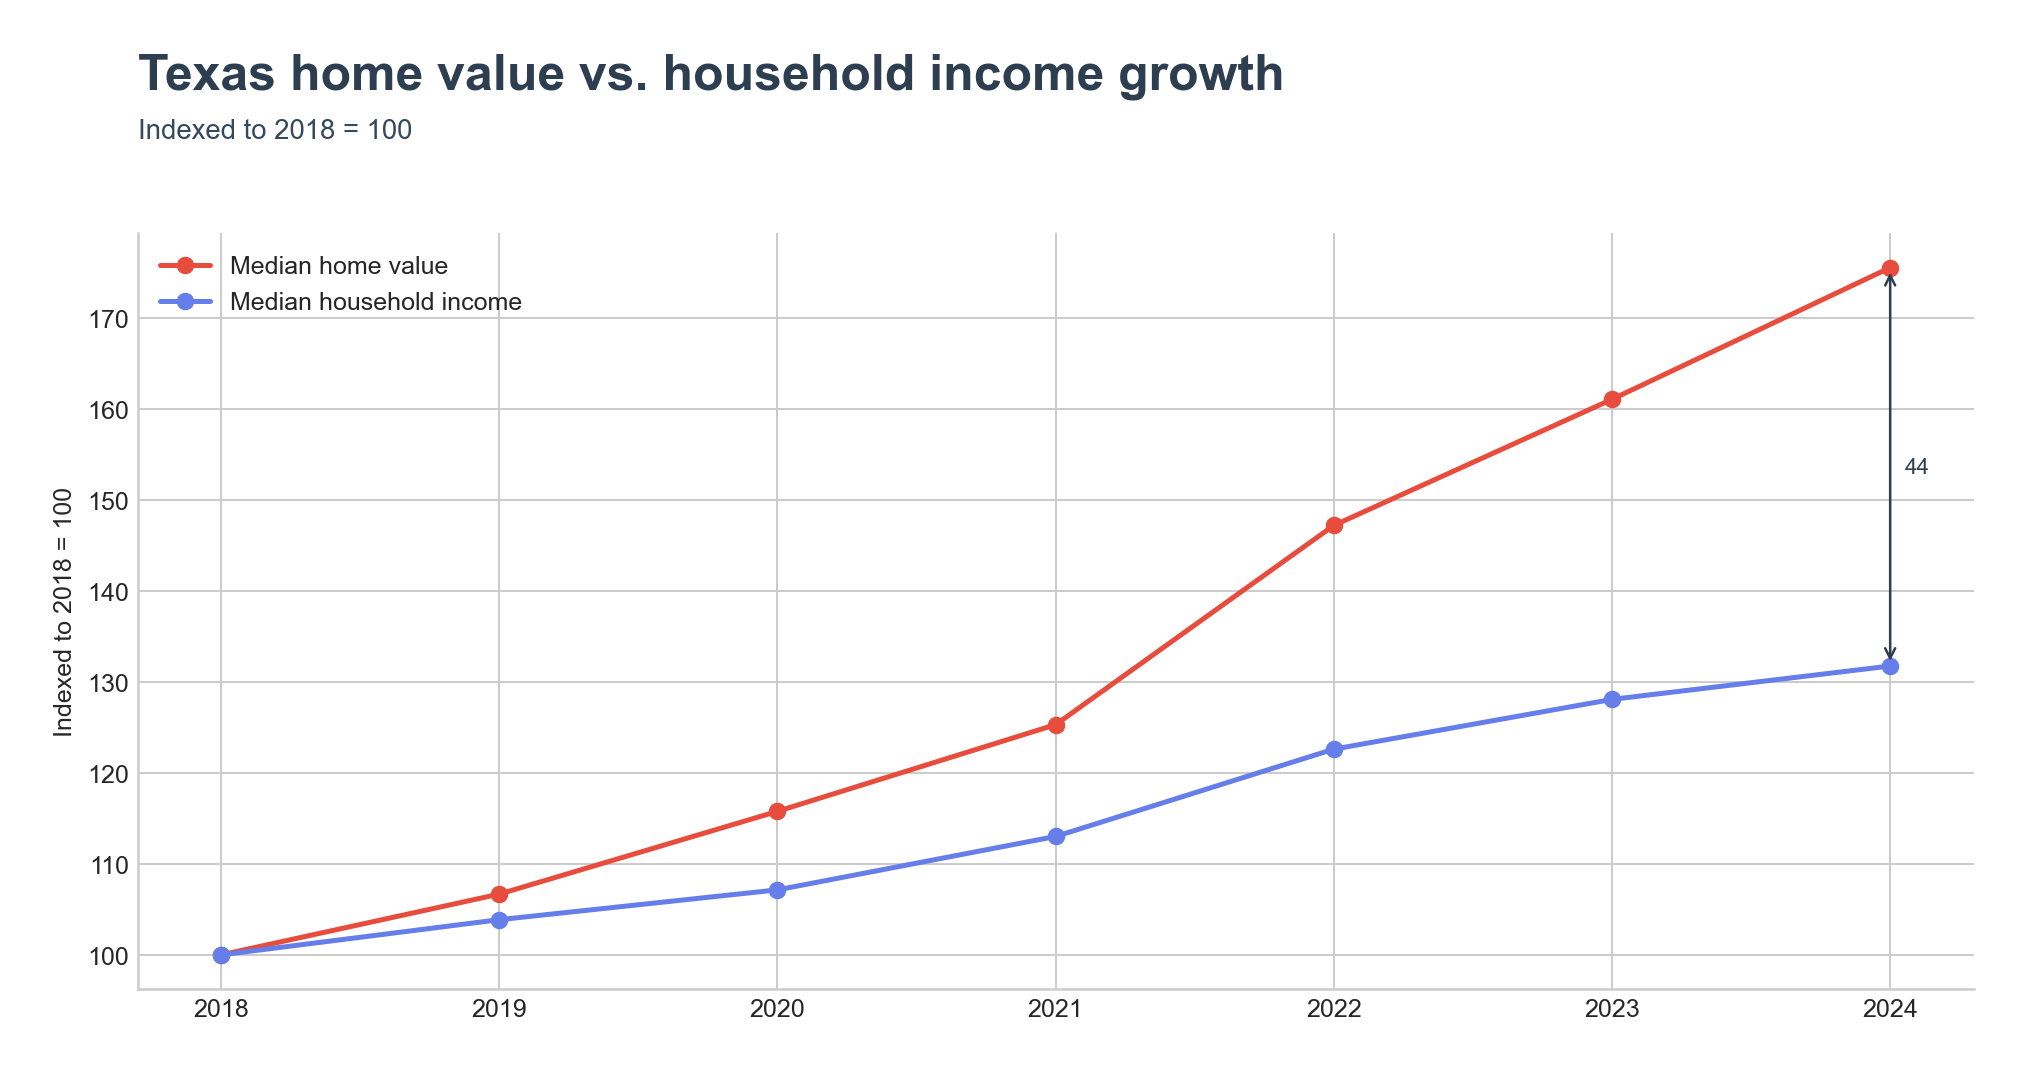
The component view shows why. Indexed to 2018, the median Texas home value reached 175 by 2024 while median household income reached only 132 — a 44-point gap that opened almost entirely after 2020.
Where the ratio is highest
The top of the place ranking is dominated by two enclaves entirely surrounded by the city of Dallas: Highland Park at 7.96x and University Park at 7.45x, which together form the Park Cities. Both clip the household-income measure at the $250,001 ACS top-code, so the ratios are floors rather than true values — actual incomes are higher and the real ratios are lower than printed, but home values of $1.99M and $1.86M keep them at the top of the state.
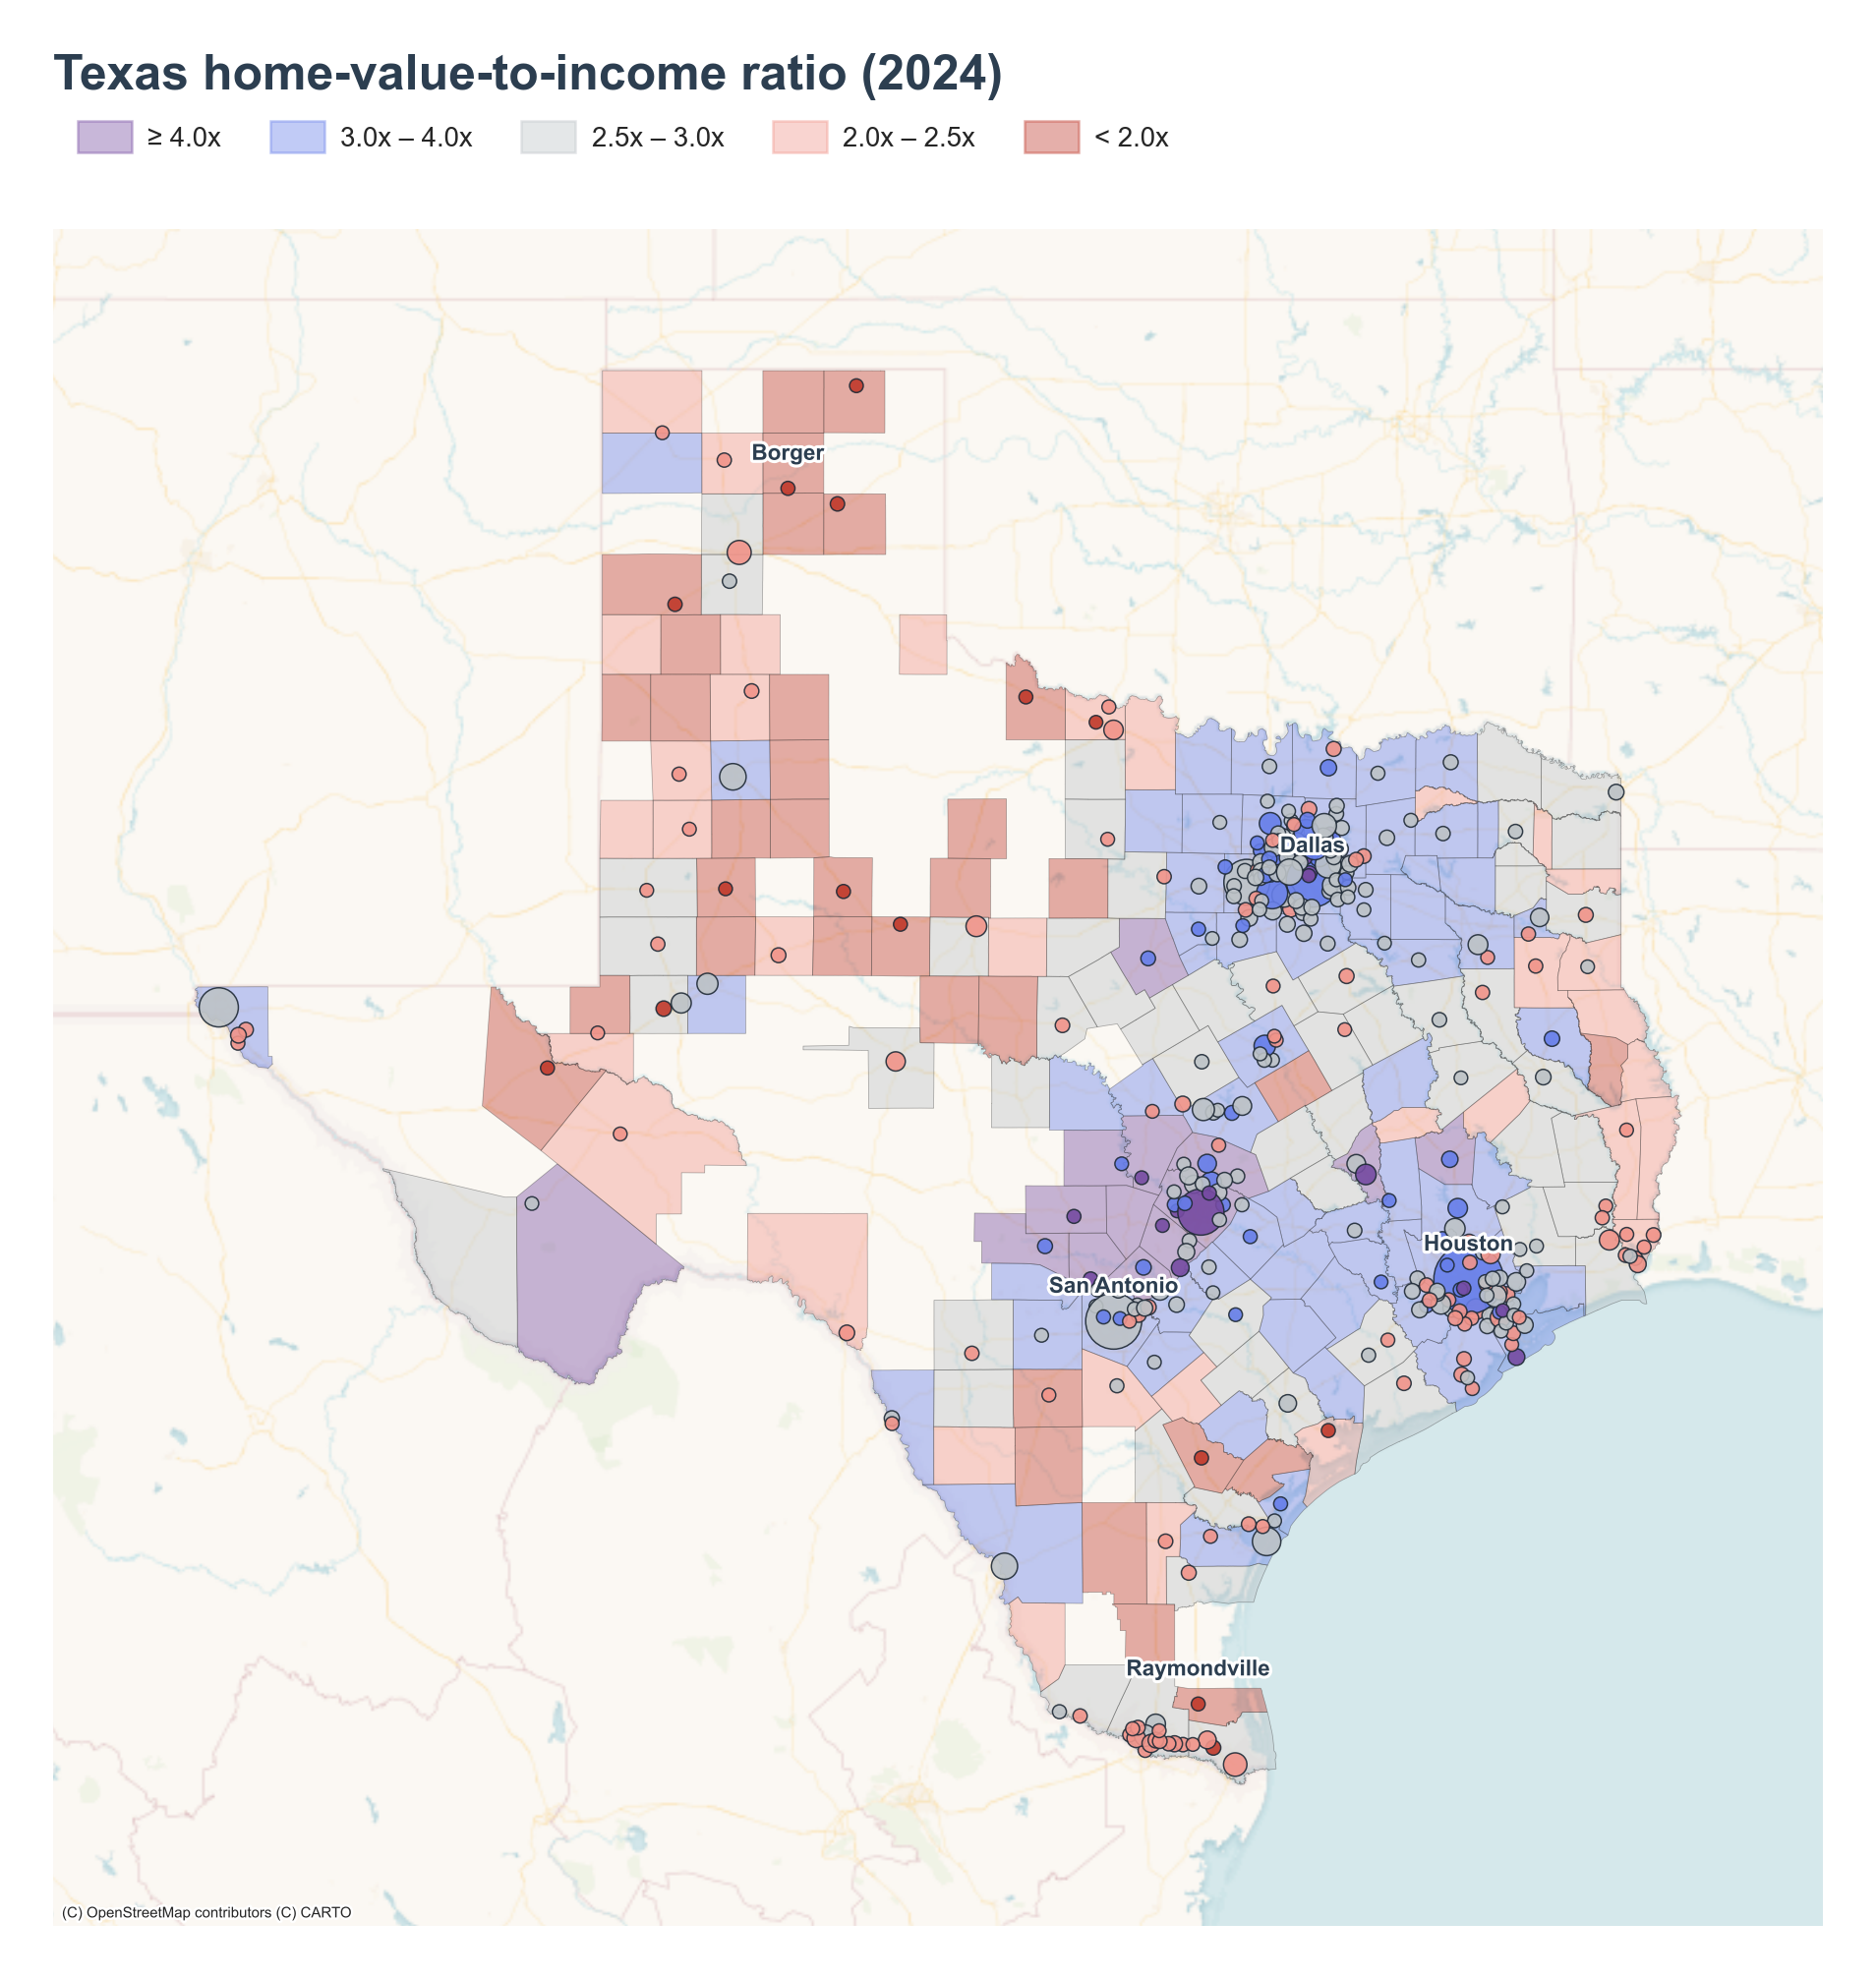
The remaining top places sit in two clusters visible on the map. Fredericksburg at 7.13x and Bee Cave at 6.98x are both in the Texas Hill Country west of Austin, a region whose wine-and-tourism economy and second-home demand have lifted home values well past local incomes. College Station at 6.81x is the home of Texas A&M University ; its ratio reflects the standard university-town pattern where a large student-renter population pulls measured household income down while housing competes on broader market terms.
The county ranking confirms the same geography. Gillespie (6.05x), Llano (5.28x), and Blanco (5.23x) are three contiguous Hill Country counties; Travis (5.25x) is the Austin core; Brazos (5.06x) is the College Station county.
Where the ratio is lowest
The bottom of the place ranking lands in two distinct regions. Raymondville sits at 1.01x — a $52,200 median home value against a $51,442 median income — in the lower Rio Grande Valley near the Gulf. The other four lowest places — Borger (1.68x), Vernon (1.70x), Pampa (1.78x), and Snyder (1.80x) — are all in the Texas Panhandle and adjacent North/West Texas oil-and-agriculture country, where home values stayed under $105,000 even in 2024.
The county map mirrors this: Lamb (1.36x), Floyd (1.53x), and Crosby (1.55x) form a Panhandle cluster around Lubbock; Mitchell (1.42x) sits in West Texas; Willacy (1.36x) is the county containing Raymondville.
How the distribution shifted
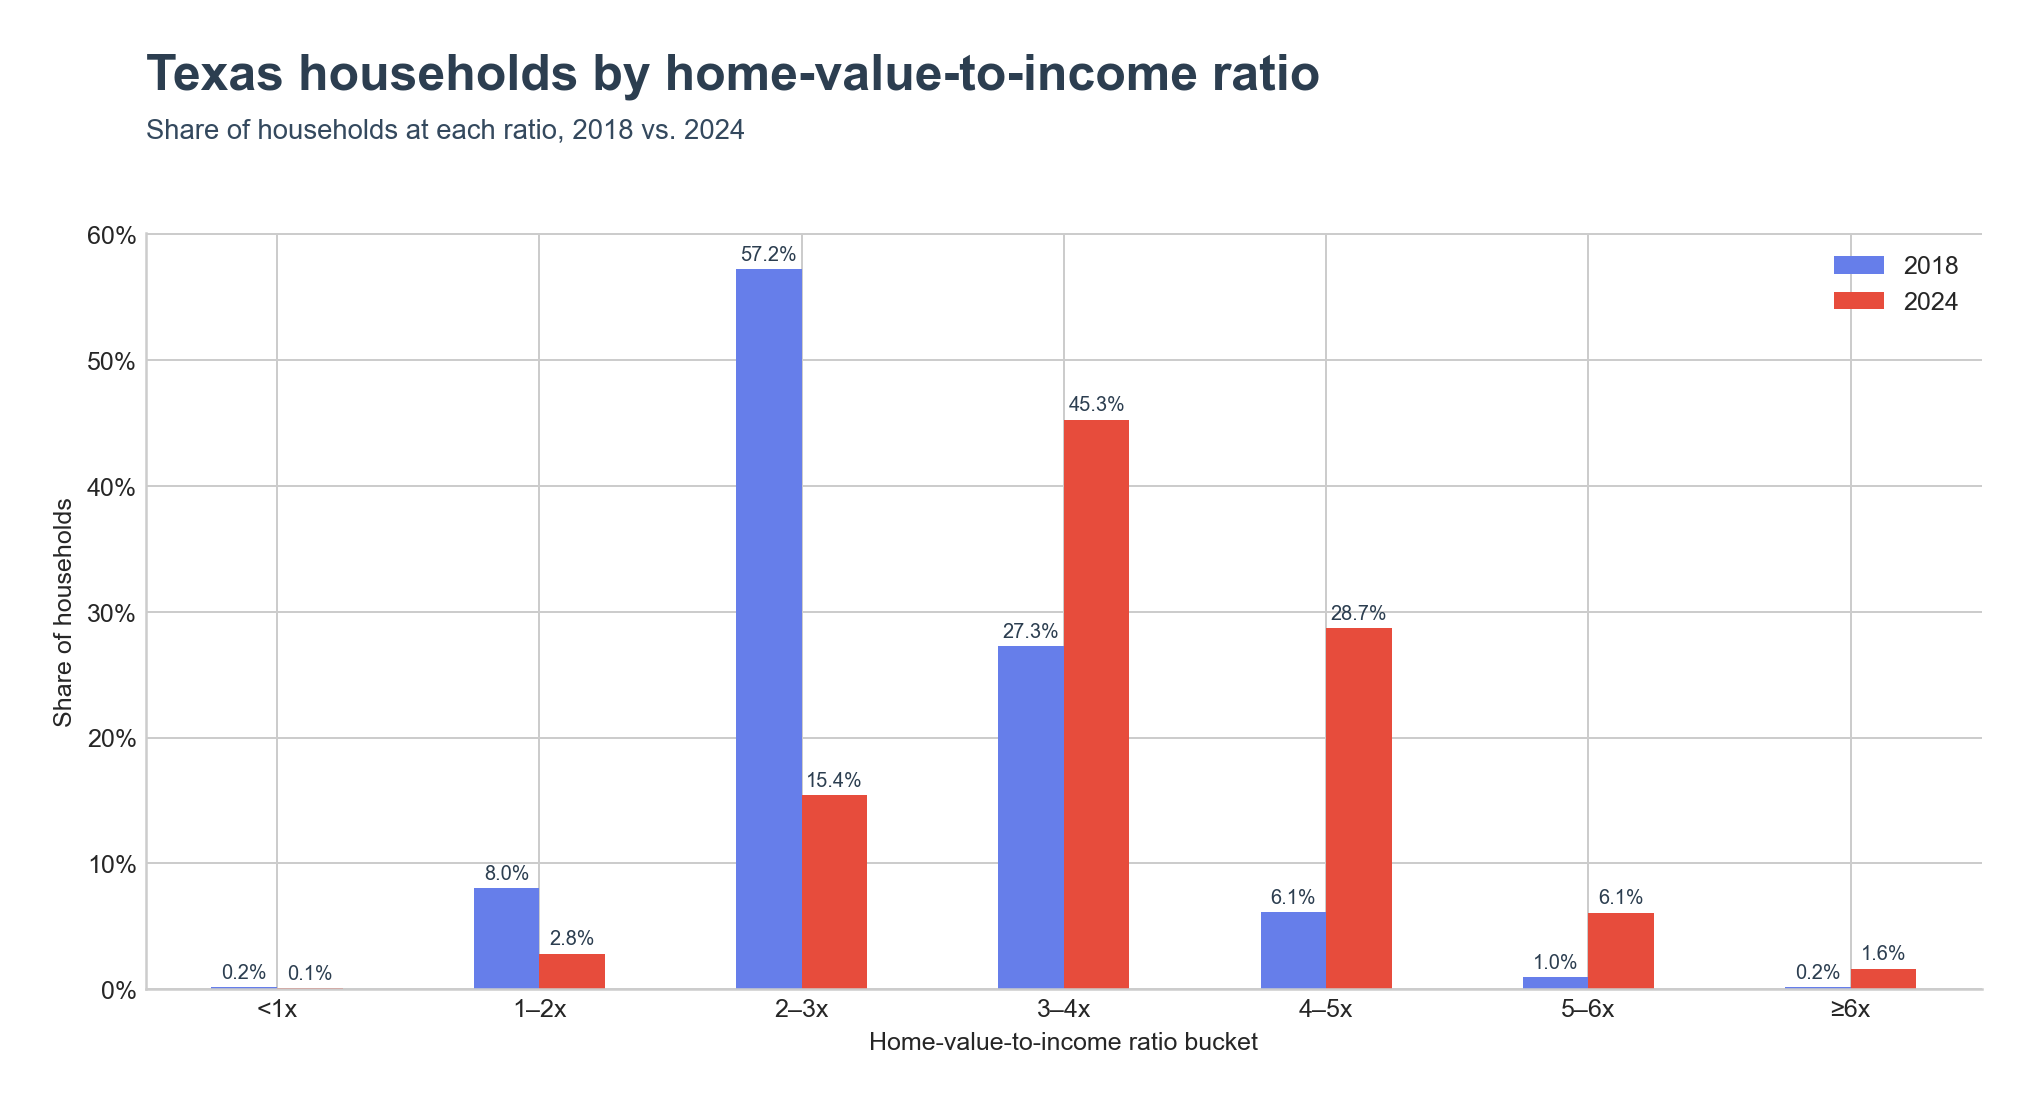
Texas's place-level distribution moved up by roughly one bucket between 2018 and 2024. The 2–3x bucket — which housed 57.2% of Texas households in 2018 — held only 15.4% by 2024. The 3–4x bucket grew from 27.3% to 45.3% and the 4–5x bucket from 6.1% to 28.7%. The ≥5x share rose from 1.2% to 7.7%, with the ≥6x bucket alone going from 0.2% to 1.6%.
Key Takeaways
- Texas is still 0.45x below the United States on the home-value-to-income ratio, but the gap has narrowed from 0.68x in 2018.
- Median home values grew 75% since 2018 against 32% for median household income, a 44-point index gap.
- The Park Cities, the Hill Country, the Austin core, and the College Station area concentrate the highest ratios in the state.
- The Panhandle and the lower Rio Grande Valley remain the most affordable regions, with multiple counties and places under 1.8x.
- Texas households living in places at 4x or higher went from 7.3% in 2018 to 36.4% in 2024.