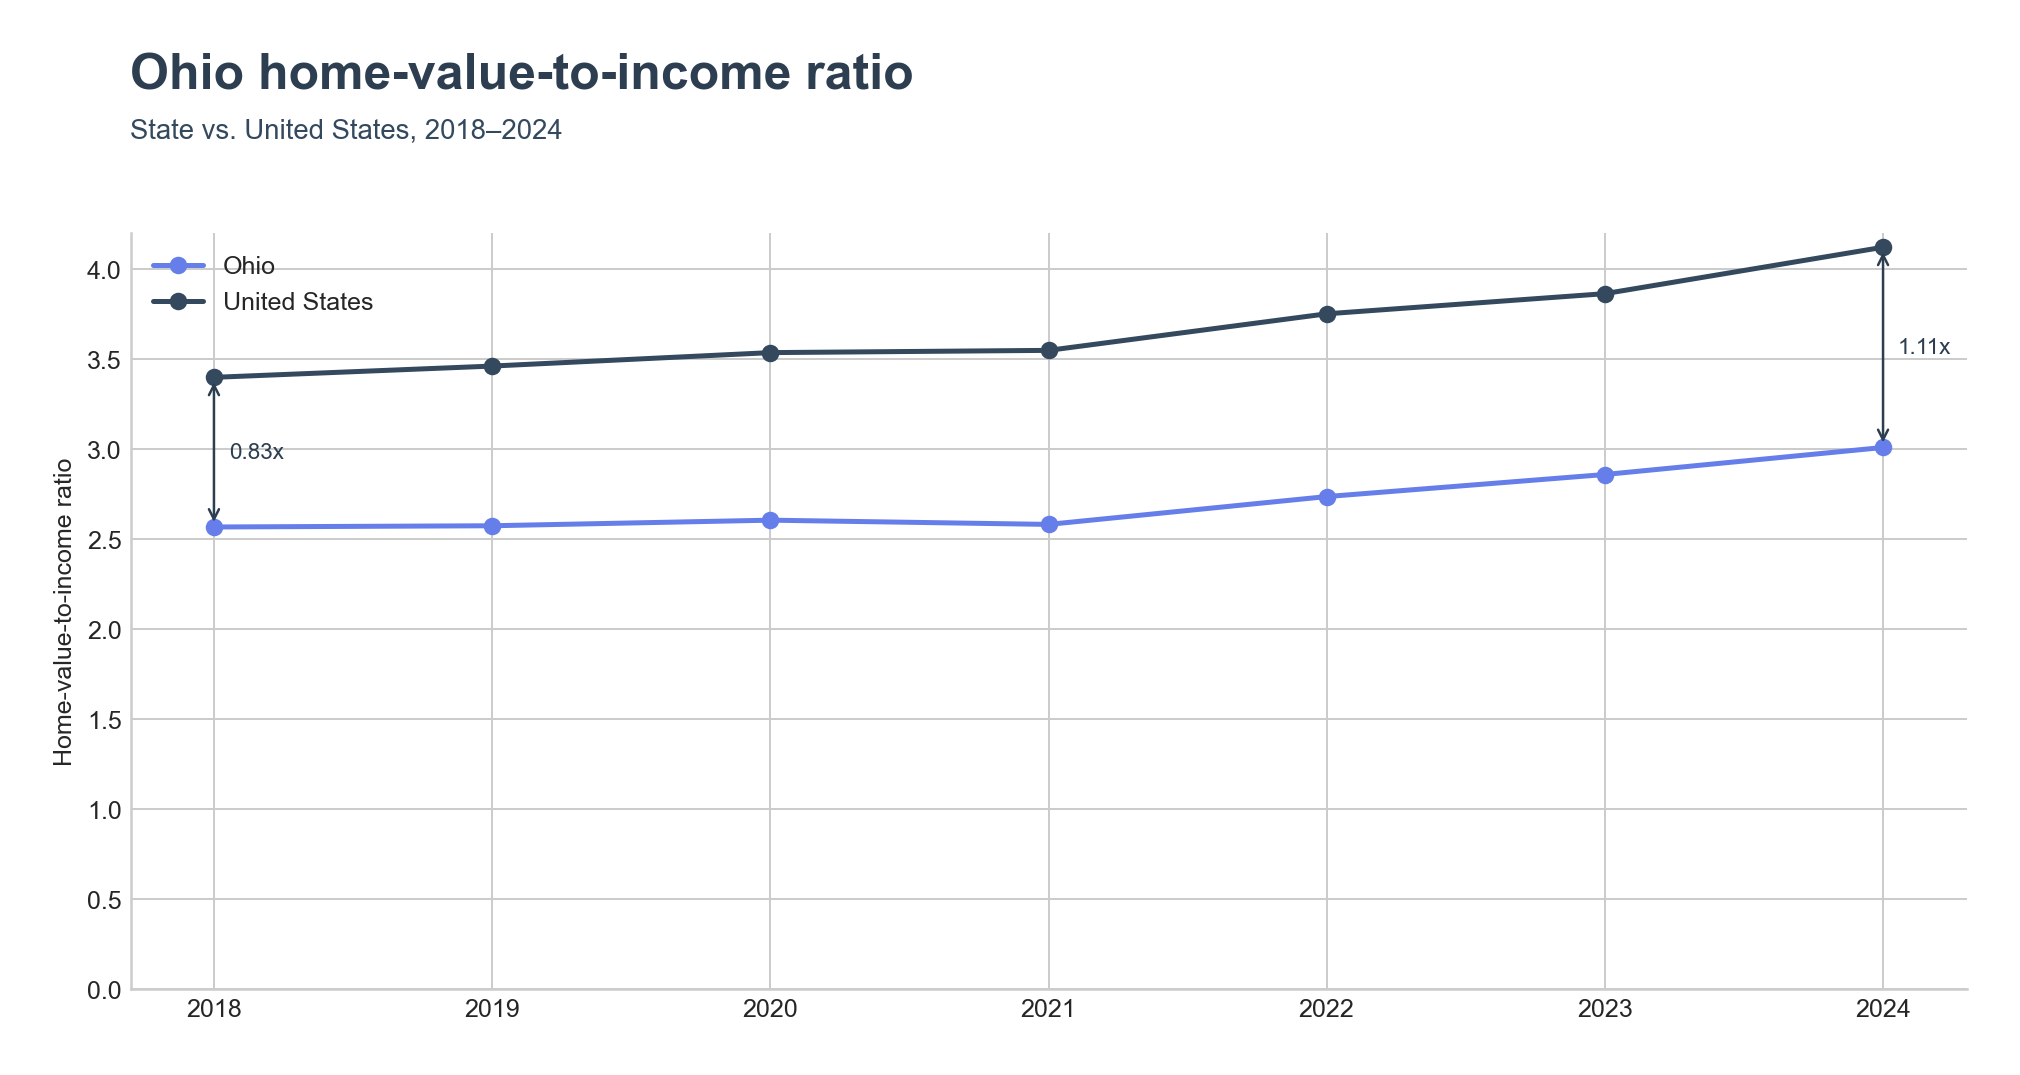
Ohio is still one of the most affordable states, but the cushion is shrinking.
Ohio's statewide home-value-to-income ratio reached 3.01x in 2024, up from 2.57x in 2018. The United States moved from 3.40x to 4.12x over the same window. Ohio sat 0.83x below the national ratio in 2018 and ends the period 1.11x below — in absolute terms the gap widened, but both lines moved in the same direction, and Ohio's +0.44x climb is meaningful for a state that started near the bottom of the national distribution.
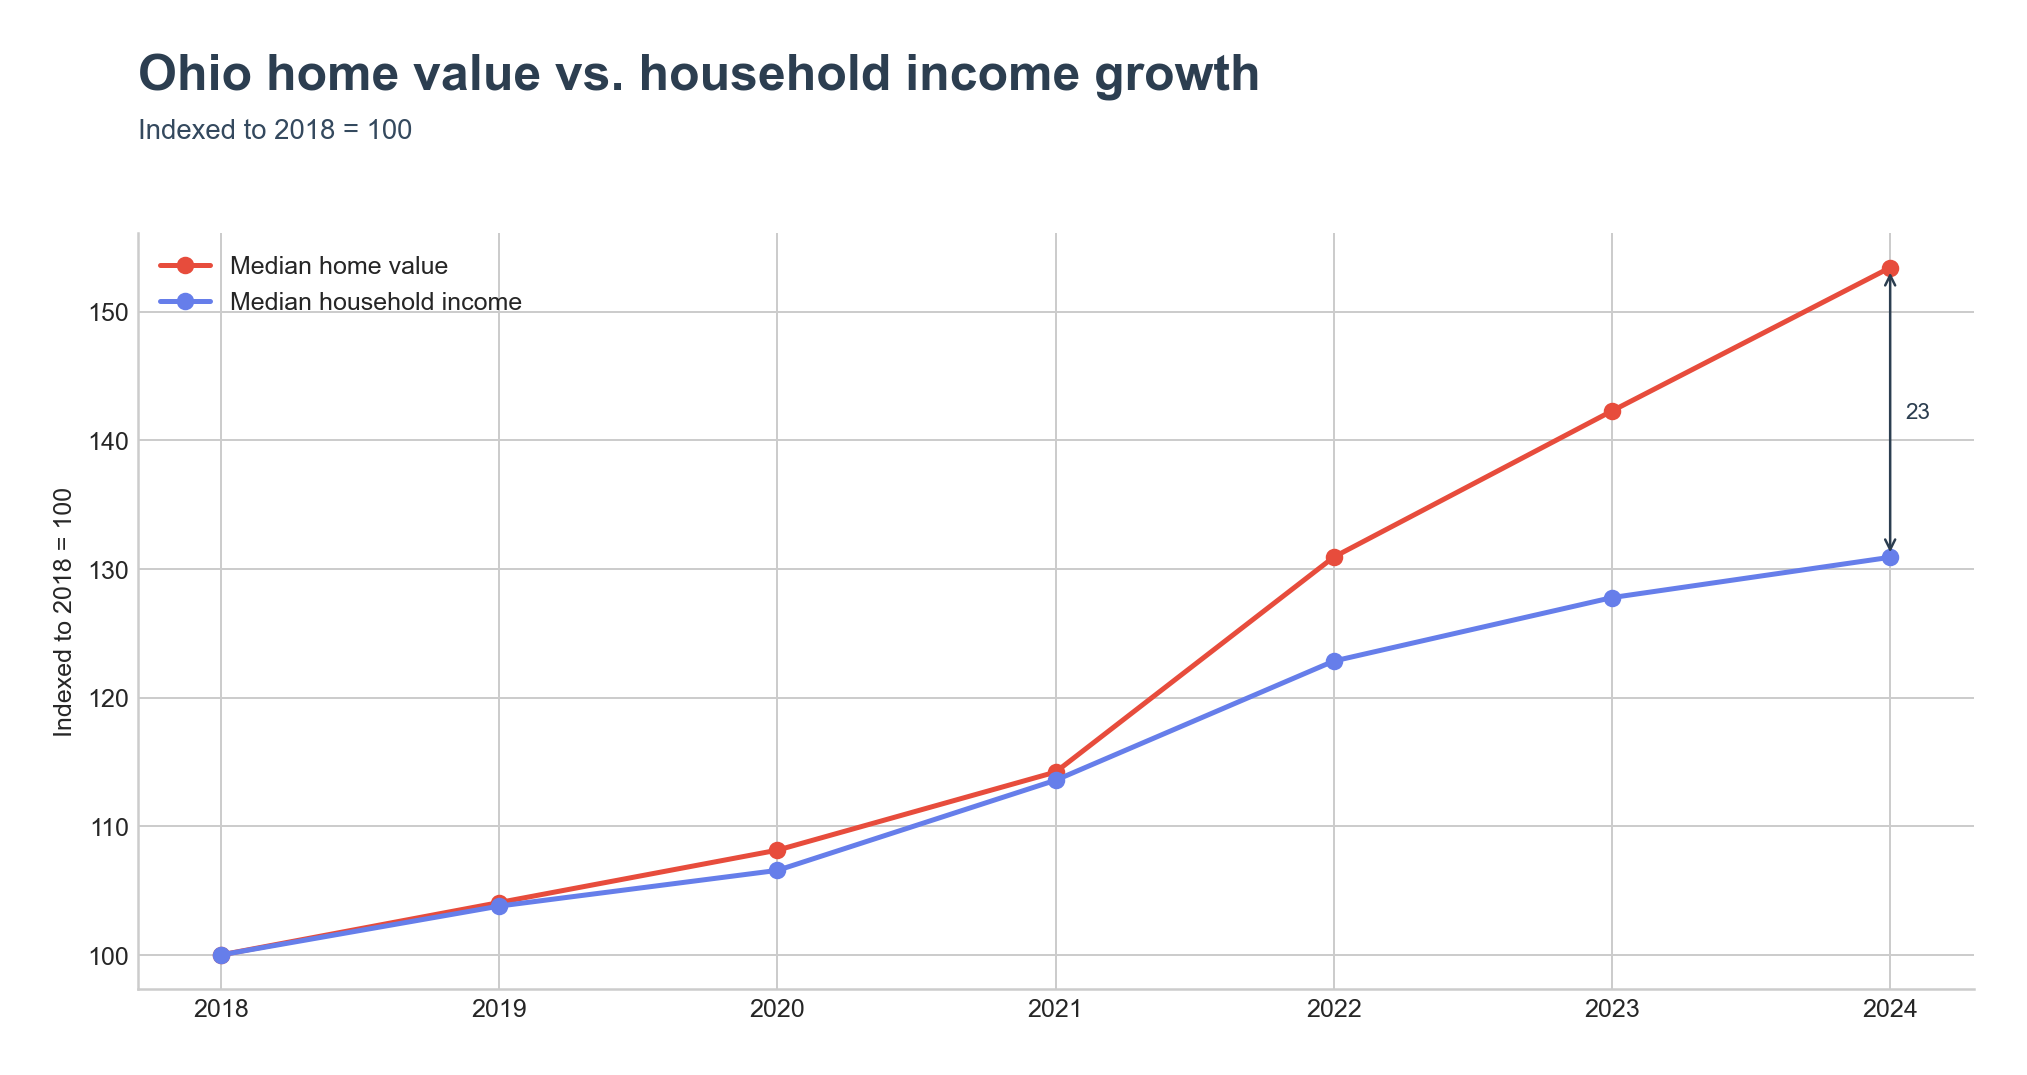
Home values pulled away from incomes after 2021.
Indexed to 2018 = 100, Ohio's median home value reached 153 by 2024 while median household income reached 131 — a 23-point gap. The typical Ohio home went from $140,000 to $214,800 (a +53% move) while median household income rose from $54,533 to $71,389 (a +31% move). The two series tracked each other tightly through 2021 and split sharply in 2022.
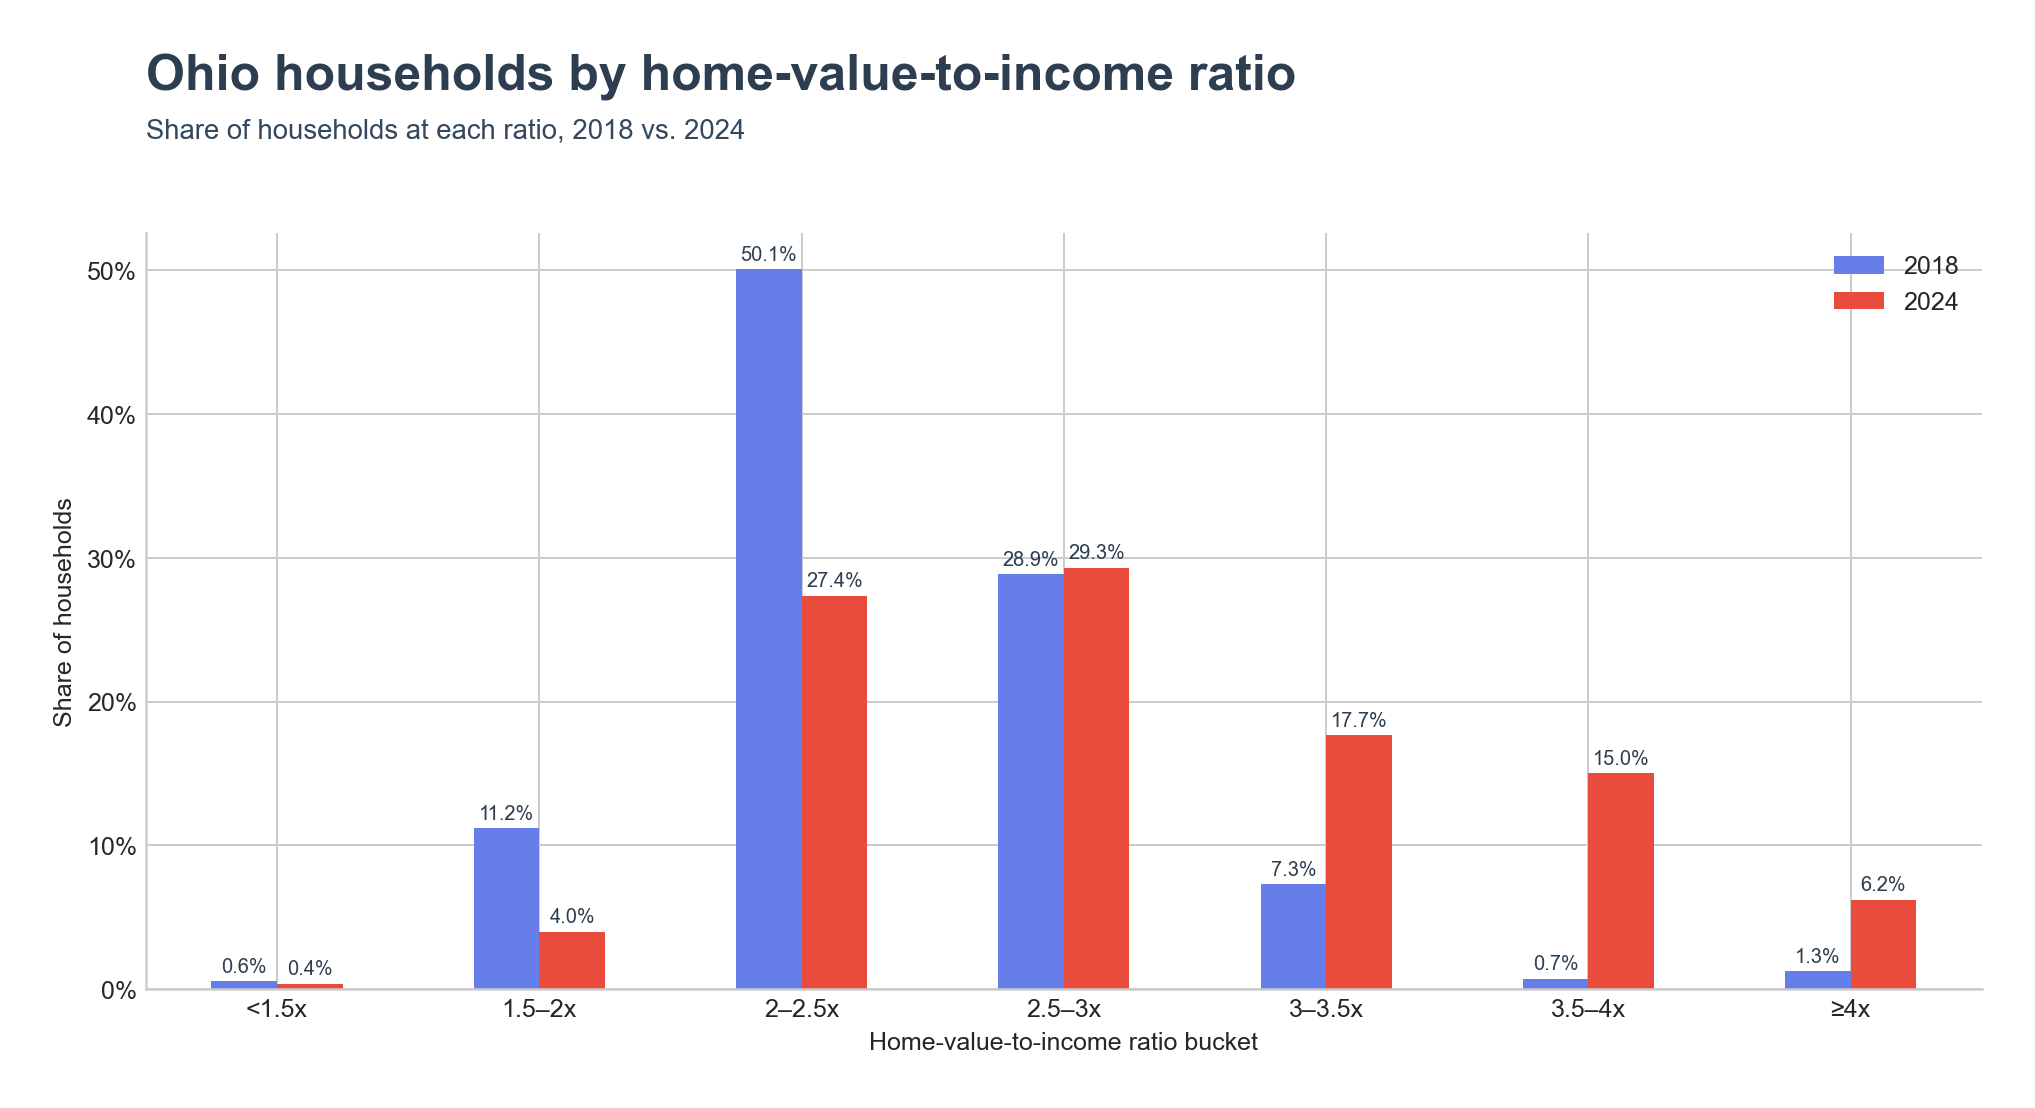
The Ohio middle moved up a full ratio step.
The place-level distribution shows the shift more clearly than the headline ratio. In 2018, 50.1% of Ohio households lived in places with a ratio between 2x and 2.5x — the modal Ohio range by a wide margin. By 2024 that share fell to 27.4%, while the 3–3.5x share more than doubled from 7.3% to 17.7% and the 3.5–4x share went from 0.7% to 15.0%. The 4x or above share also rose from 1.3% to 6.2%.
High ratios cluster around Columbus, Cincinnati, and Amish country; low ratios sit in the rust-belt east and rural northwest.
The county map splits Ohio along familiar lines. The highest county ratio in the state is Franklin County (Columbus) at 3.84x, followed by Holmes County at 3.52x — the county with the highest concentration of Amish residents in the world, where a large share of households hold homes but report low cash incomes. Pickaway at 3.47x sits immediately south of Franklin and is being pulled into the Columbus exurban ring. Hamilton County (Cincinnati) at 3.34x and Delaware County at 3.34x round out the top five; Delaware is one of the wealthiest counties in the United States and the highest-income county in Ohio, anchoring the affluent ring north of Columbus.
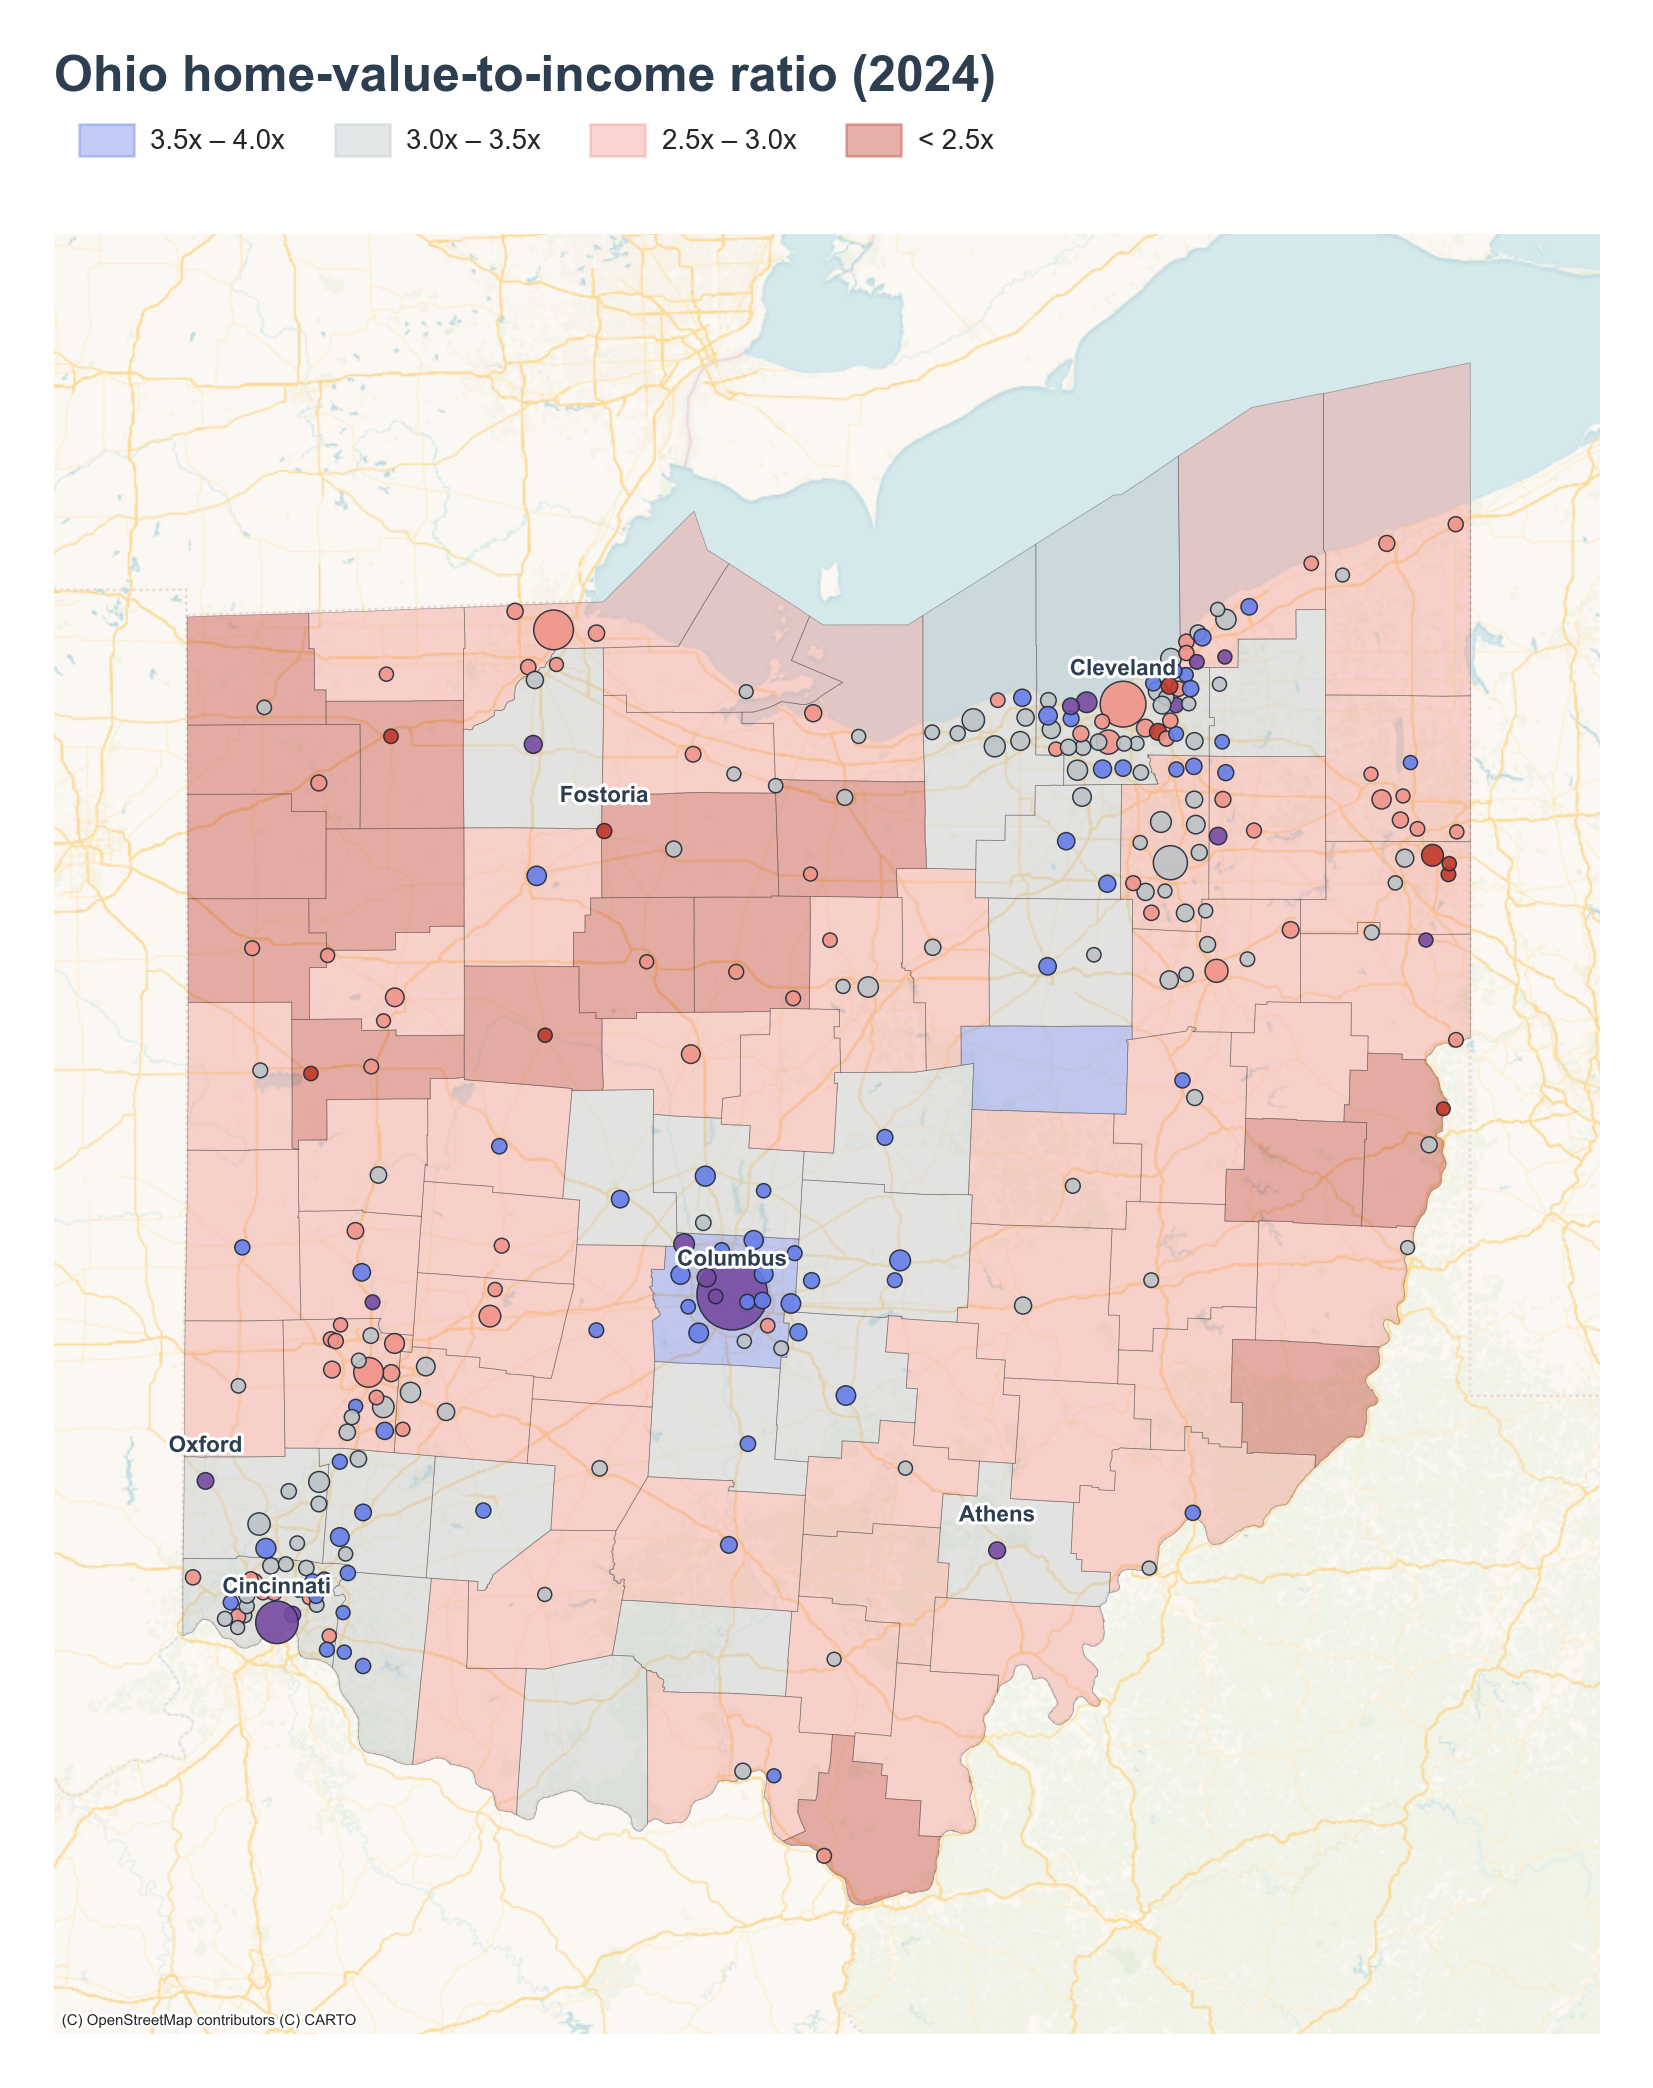
The bottom of the county distribution is the inverse: Paulding at 2.08x, Henry at 2.10x, and Defiance at 2.23x form a contiguous block of flat agricultural counties in the northwest corner of the state, while Jefferson County at 2.16x and Harrison County at 2.23x sit in the eastern Appalachian rust belt — Jefferson has lost roughly a third of its population since its 1960 industrial peak, and home values have stayed low along with it.
The place-level pattern is college towns on top, rust-belt cities and an inner-ring Cleveland suburb on the bottom.
Every place in Ohio's top four is a major college town. Athens leads at 6.47x — home to Ohio University, where the large student body sits well below the surrounding housing stock on the income side. Oxford at 5.84x is home to Miami University, Kent at 5.12x is Kent State, and Bowling Green at 5.01x is Bowling Green State. The fifth slot is the only non-college town: Grandview Heights at 4.96x, an early inner-ring suburb of Columbus where a $583,300 median home value — the highest in the top five — pairs with a $117,672 median household income.
The bottom-five places show the opposite pattern. Fostoria at 1.61x is a small industrial city in northwest Ohio. Maple Heights at 1.83x is an inner-ring Cleveland suburb in Cuyahoga County where post-1960 demographic turnover has left modest home values alongside still-working household incomes. Youngstown at 1.84x is the textbook rust-belt case, where post-steel decline has kept the housing stock cheap ever since. Struthers at 1.87x sits directly southeast of Youngstown and shares the same post-1977 steel collapse. St. Marys at 1.87x rounds out the bottom — a small western Ohio city with a $148,500 median home value against an unusually high $79,516 median household income.
Key Takeaways
- Ohio's home-value-to-income ratio reached 3.01x in 2024, well below the U.S. 4.12x.
- The state rose +0.44x since 2018, slower than the national +0.72x, but the gap to the U.S. widened from 0.83x to 1.11x.
- Home values grew 53% while household incomes grew 31%.
- The share of Ohioans living in places at 3x or higher rose from 9.3% in 2018 to 38.9% in 2024.
- High ratios are college towns and the Columbus/Cincinnati metros; low ratios are rust-belt cities, an inner-ring Cleveland suburb, and the flat agricultural northwest.