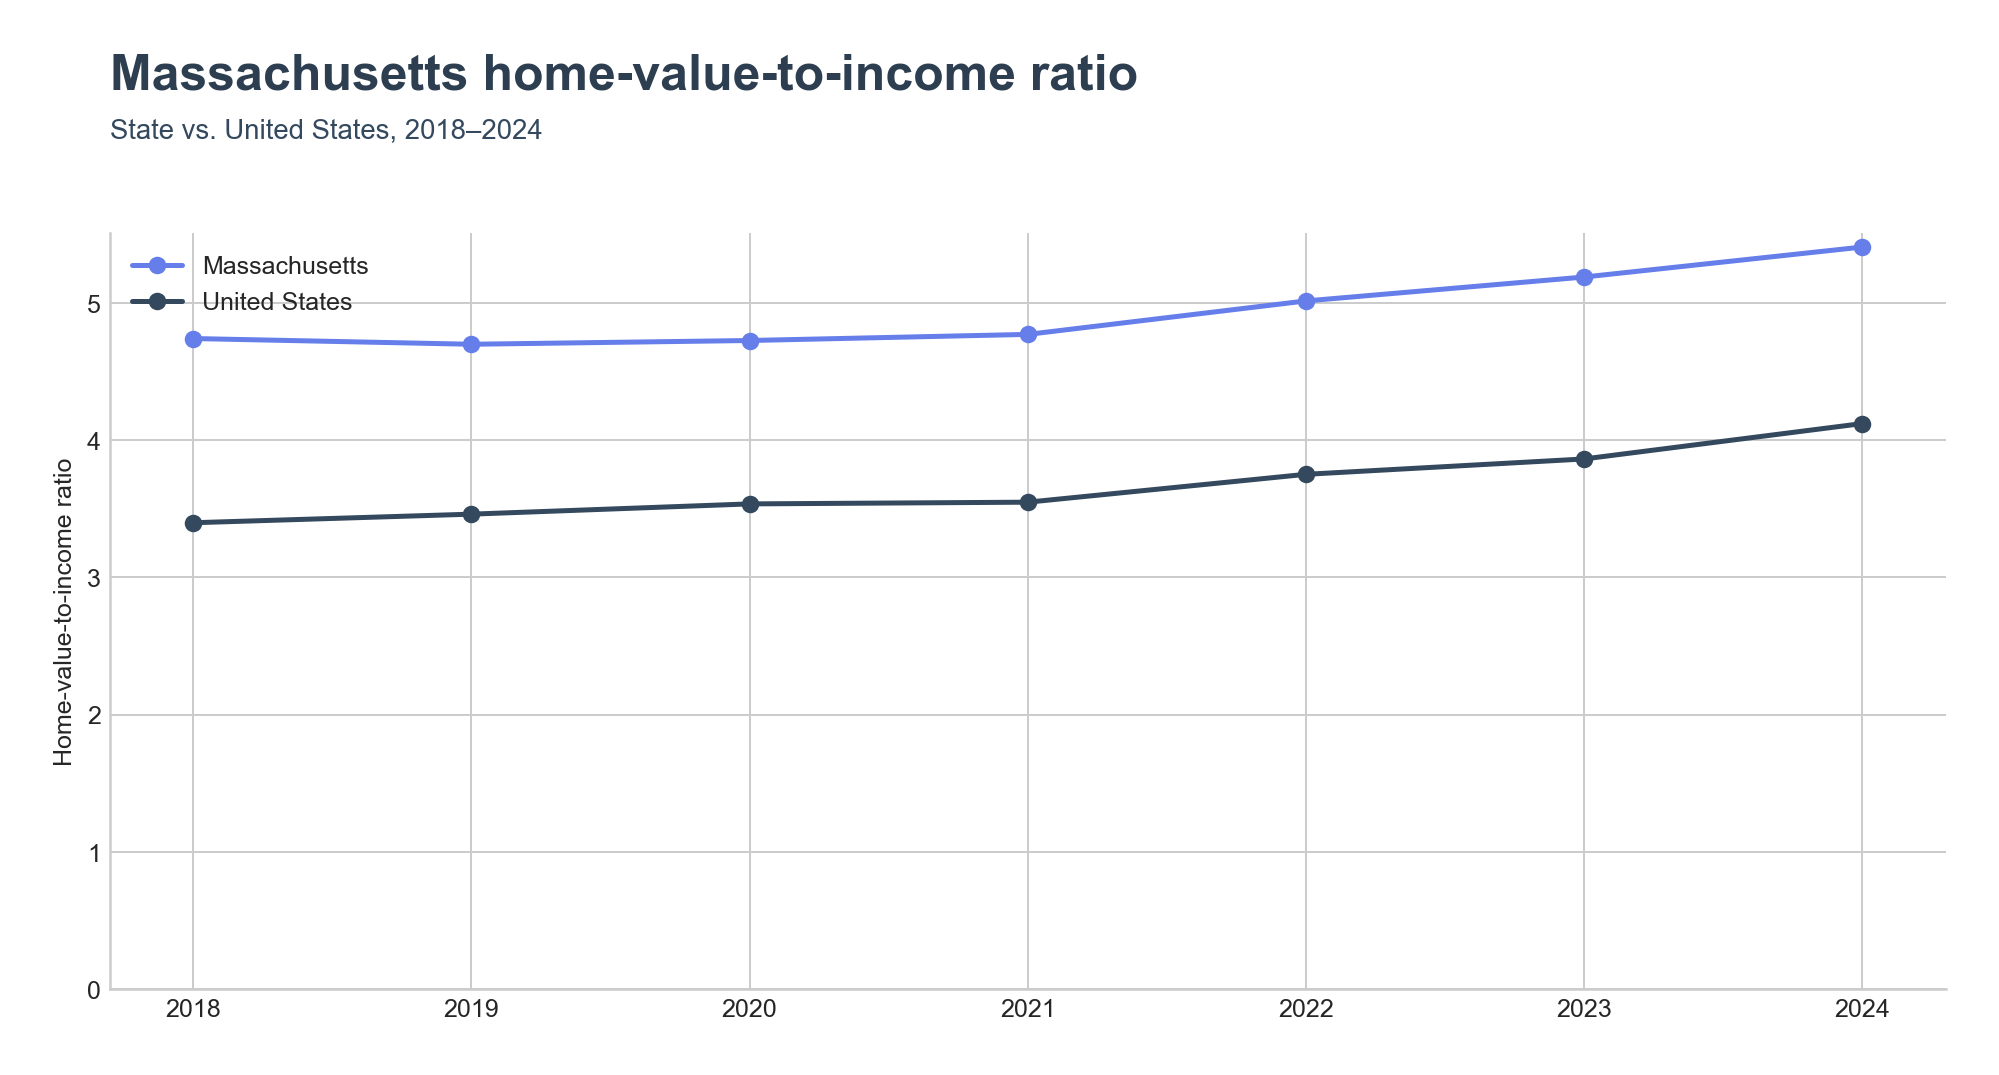
Massachusetts sits well above the national line and is pulling further away.
Massachusetts's statewide home-value-to-income ratio reached 5.41x in 2024, up from 4.74x in 2018. The United States moved from 3.40x to 4.12x over the same window. Massachusetts started 1.34x above the national ratio and ends the period 1.29x above — running on a parallel track a full ratio step higher, with a +0.67x climb against the national +0.72x.
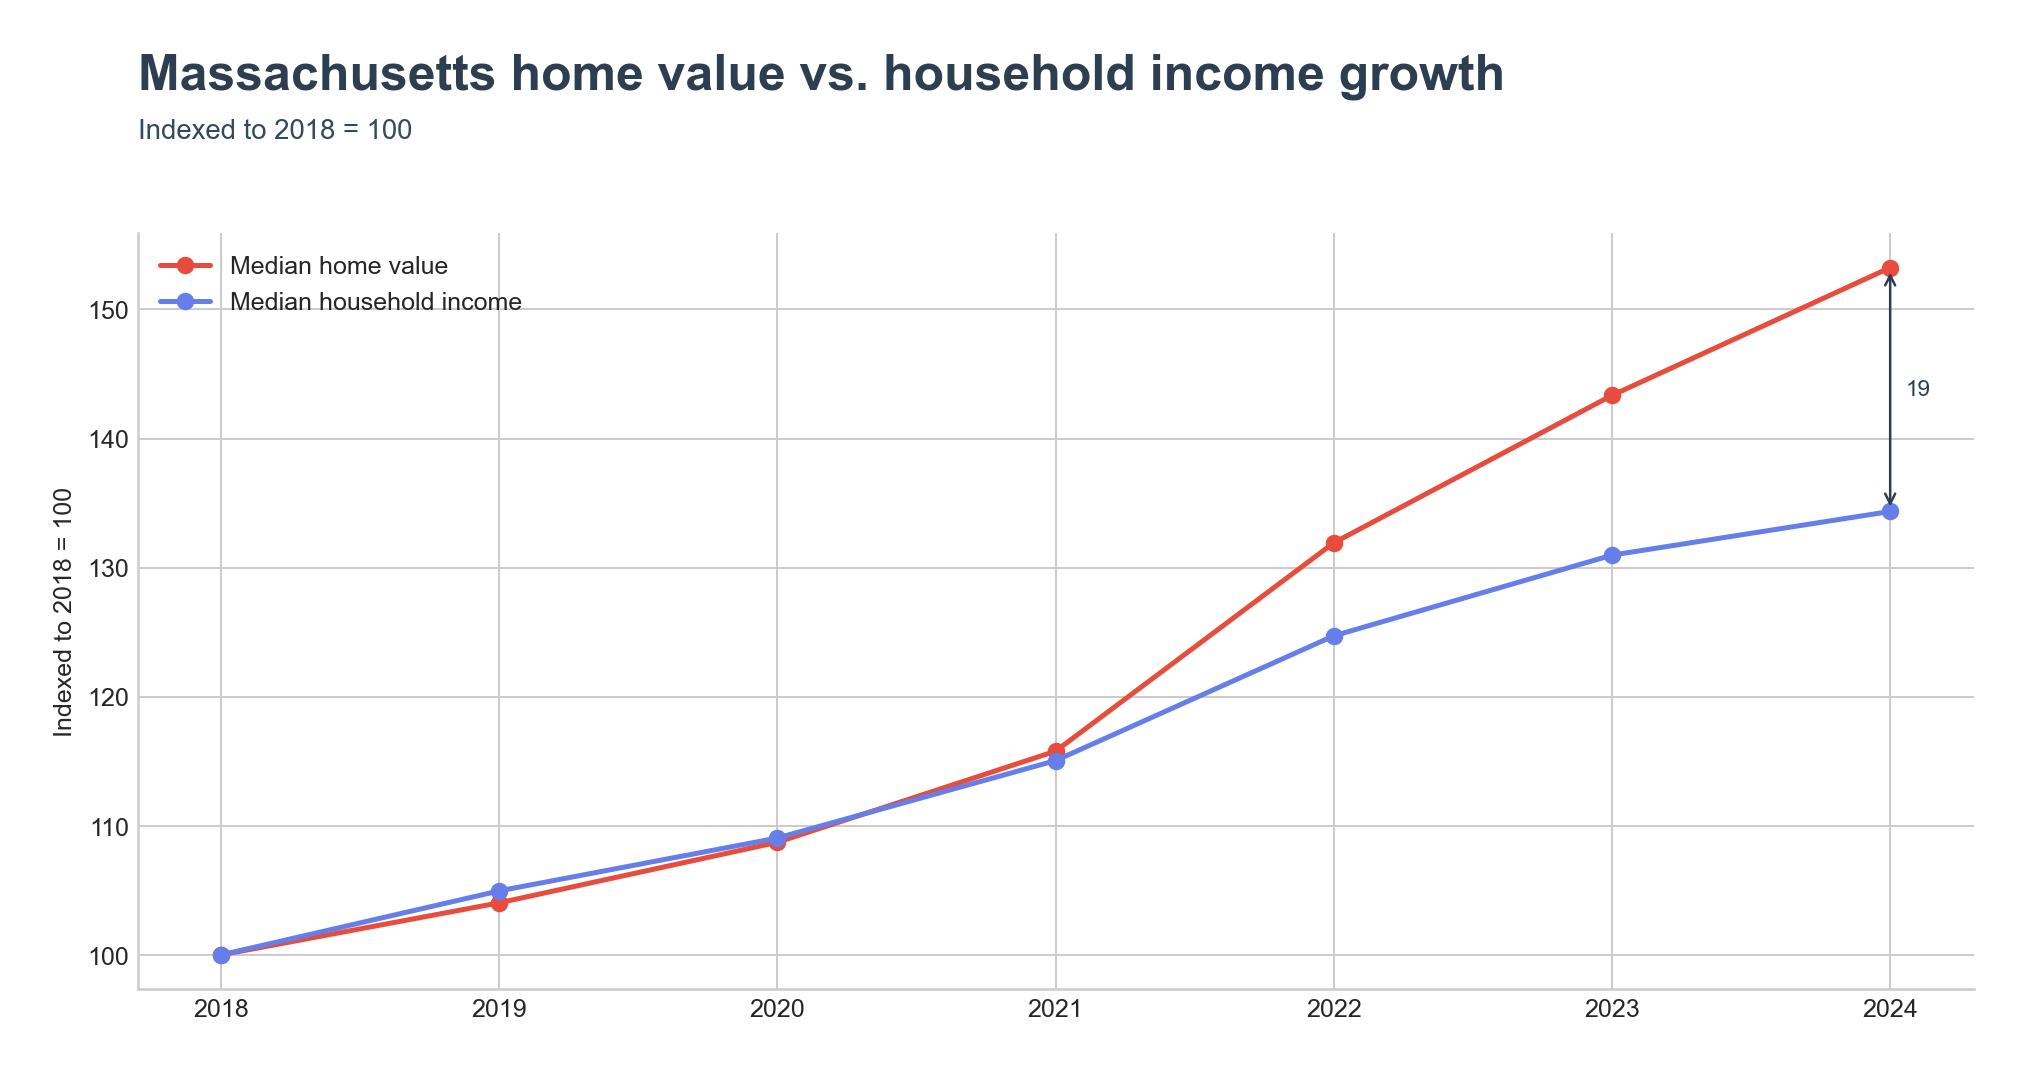
Home values pulled away from incomes after 2020.
Indexed to 2018 = 100, Massachusetts's median home value reached 153 by 2024 while median household income reached 134 — a 19-point gap. The typical Massachusetts home went from $366,800 to $562,100 (a +53% move) while median household income rose from $77,378 to $103,960 (a +34% move). The two series tracked each other through 2020 and split sharply in 2021.
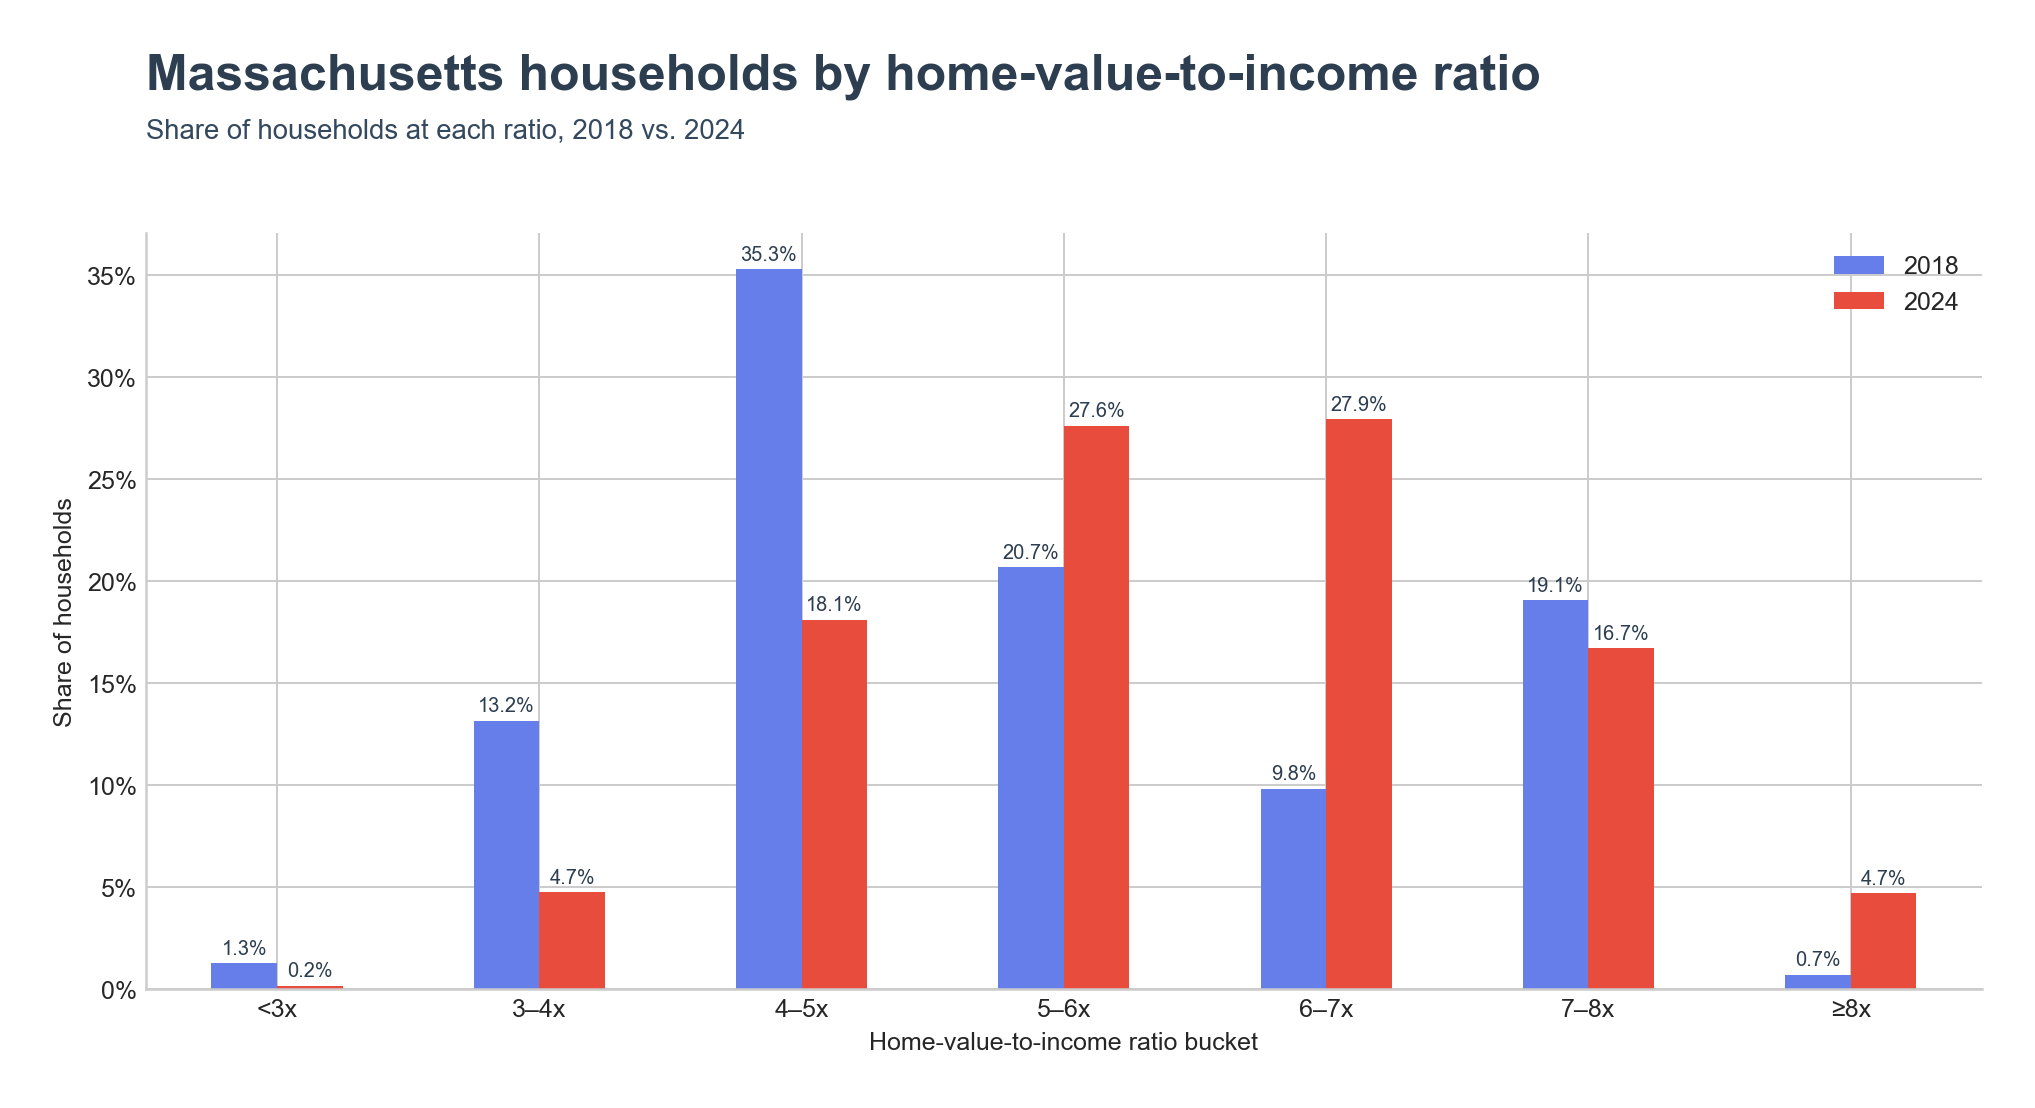
The Massachusetts middle moved up a full ratio step, and a new top tier appeared.
In 2018, 35.3% of Massachusetts households lived in places with a ratio between 4x and 5x — the modal Massachusetts range — and the 3–4x band held another 13.2%. By 2024 the 4–5x share fell to 18.1%, the 3–4x share fell to 4.7%, and the 5–6x band rose from 20.7% to 27.6%. The biggest jump is one step higher: the 6–7x band went from 9.8% of Massachusetts households in 2018 to 27.9% in 2024, becoming the new mode. The ≥8x bucket grew from 0.7% to 4.7%.
High ratios run from the islands through Greater Boston; low ratios sit in the western counties.
The county map sorts Massachusetts cleanly east-to-west. Nantucket County tops the state at 11.41x, with Dukes County — Martha's Vineyard — second at 9.27x. Suffolk County , which contains Boston, sits at 7.38x; Barnstable County on Cape Cod is at 6.60x; and Essex County on the North Shore is at 6.08x. The top five are the islands, Boston, and the coast on either side of it.
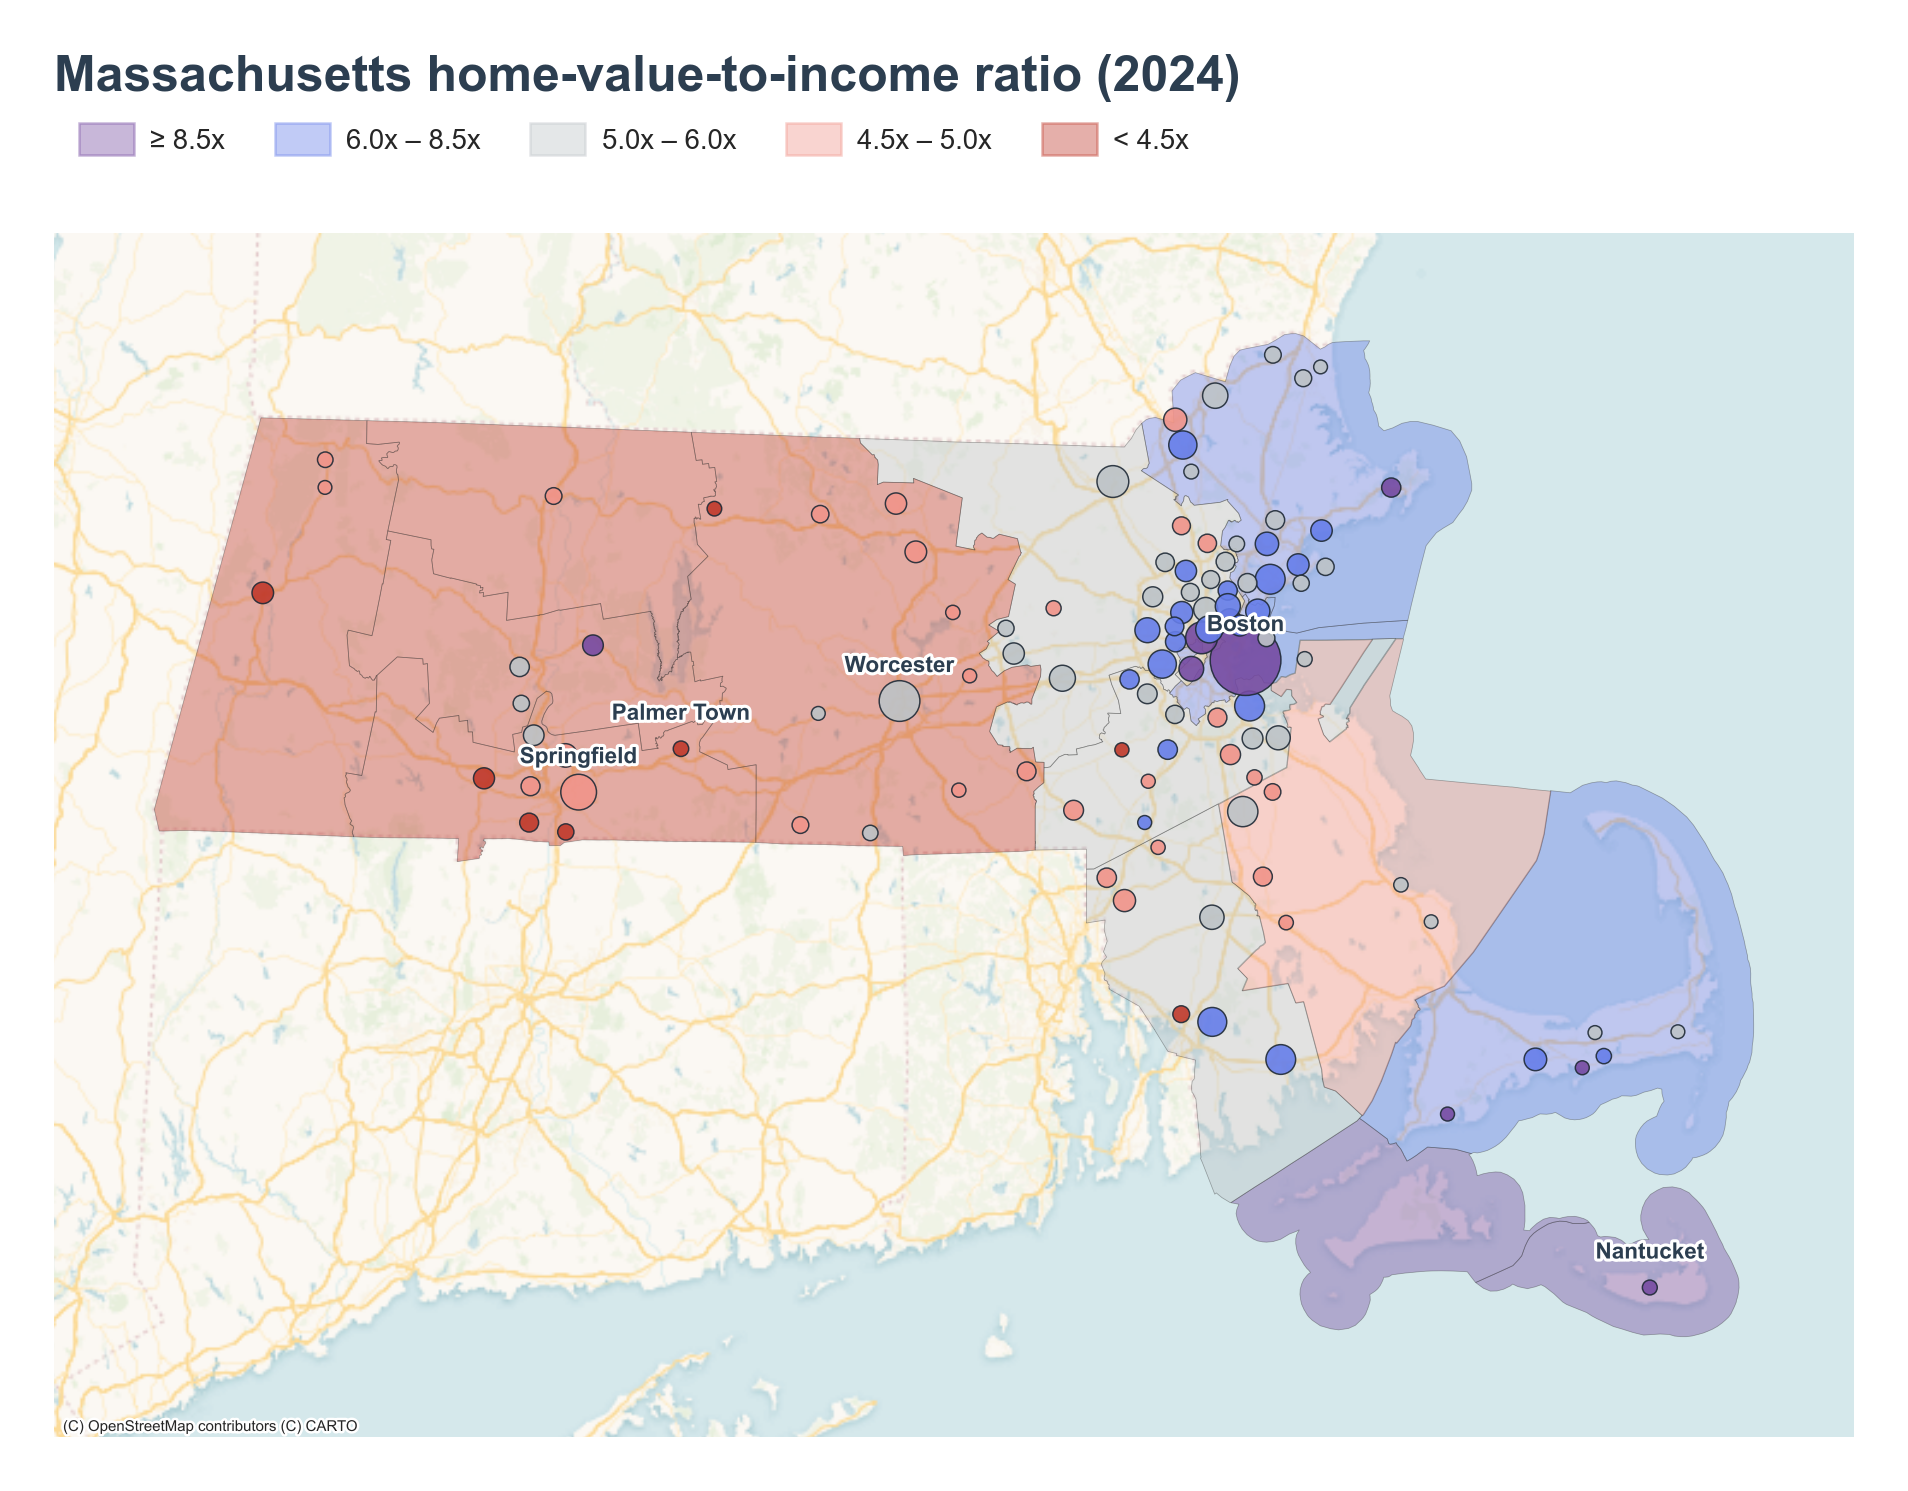
The bottom of the county distribution is the western half of the state. Berkshire County in the far west sits lowest at 4.02x. Hampden County — the Springfield area — is at 4.19x, Franklin at 4.39x, Worcester at 4.42x, and Hampshire at 4.49x. Even the floor of the Massachusetts county distribution sits at or above the 4.12x national ratio.
Places: islands and inner-Boston communities on top, western mill towns on the bottom.
Nantucket leads at 9.90x — a resort-economy island where median home value is $1,465,300 against $148,017 in median household income. Three inner Greater Boston communities follow: Brookline at 8.77x, Cambridge at 8.35x — home to Harvard and MIT — and Boston itself at 7.52x. West Yarmouth on Cape Cod rounds out the top five at 7.51x, on much lower $65,841 income — the seasonal economy detaches local wages from local prices.
The bottom-five places are all in the western counties. Longmeadow , an affluent suburb south of Springfield, sits lowest at 3.04x — its $149,601 median household income is the engine, not cheap homes. Palmer Town at 3.46x, Pittsfield at 3.64x — the Berkshire County seat and former General Electric plant town — Agawam Town at 3.65x, and Athol at 3.69x fill out the floor. All five sit west of Worcester.
Key Takeaways
- Massachusetts's home-value-to-income ratio reached 5.41x in 2024, 1.29x above the U.S. 4.12x.
- The state rose +0.67x since 2018, slightly below the national +0.72x — the gap is wide and roughly steady.
- Home values grew 53% while household incomes grew 34%, opening a 19-index-point gap after 2020.
- The 6–7x band went from 9.8% of Massachusetts households in 2018 to 27.9% in 2024 and is now the modal bucket.
- High ratios concentrate on the islands, Cape Cod, and inner Greater Boston; low ratios sit in Berkshire, Hampden, and the western counties.
- If you take away one thing: every Massachusetts county now prices at or above the U.S. ratio, and the action since 2018 has been the middle of the state's distribution pushing into a new 6–7x mode.