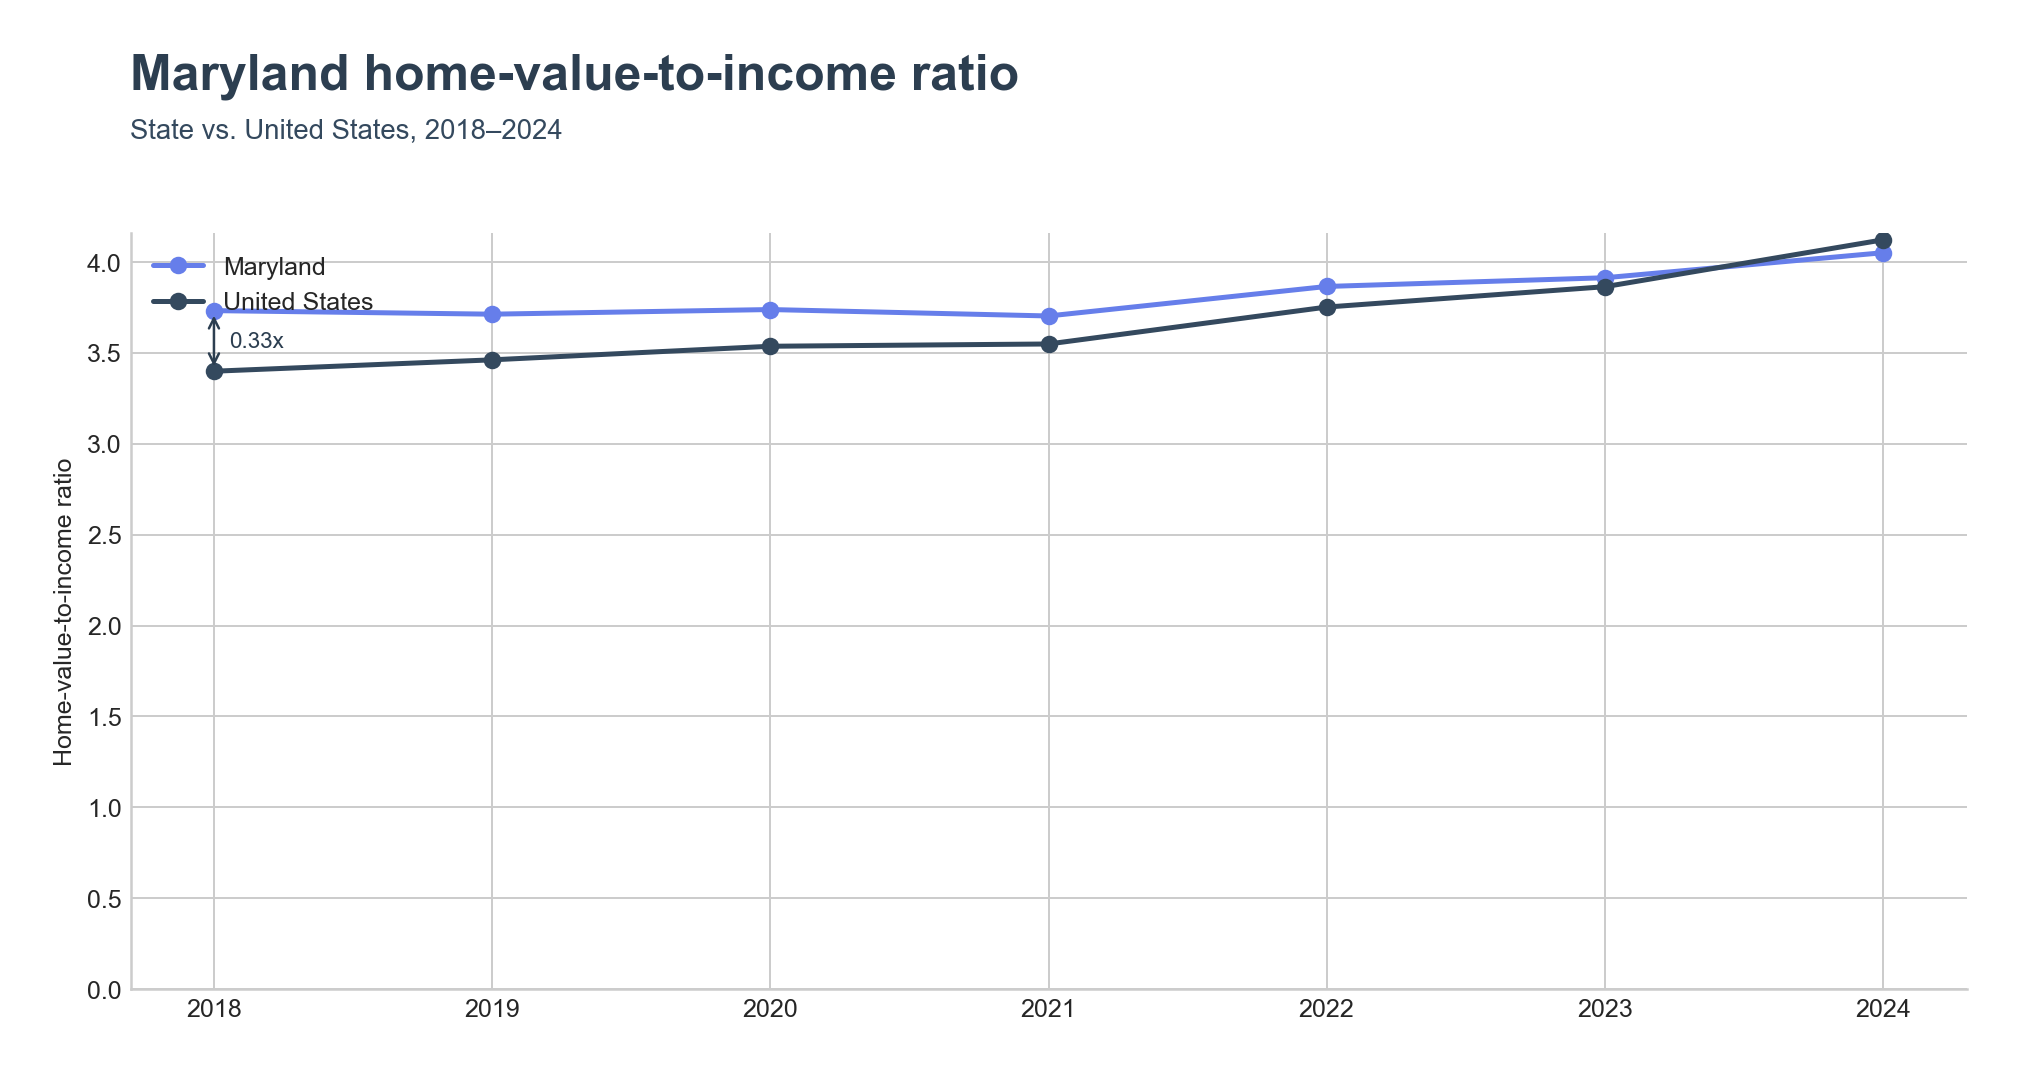
Maryland's home-value-to-income ratio reached 4.05x in 2024, just below the United States figure of 4.12x. Maryland has spent most of the past seven years running slightly ahead of the national line before the two converged in 2024.
Where the ratio runs highest
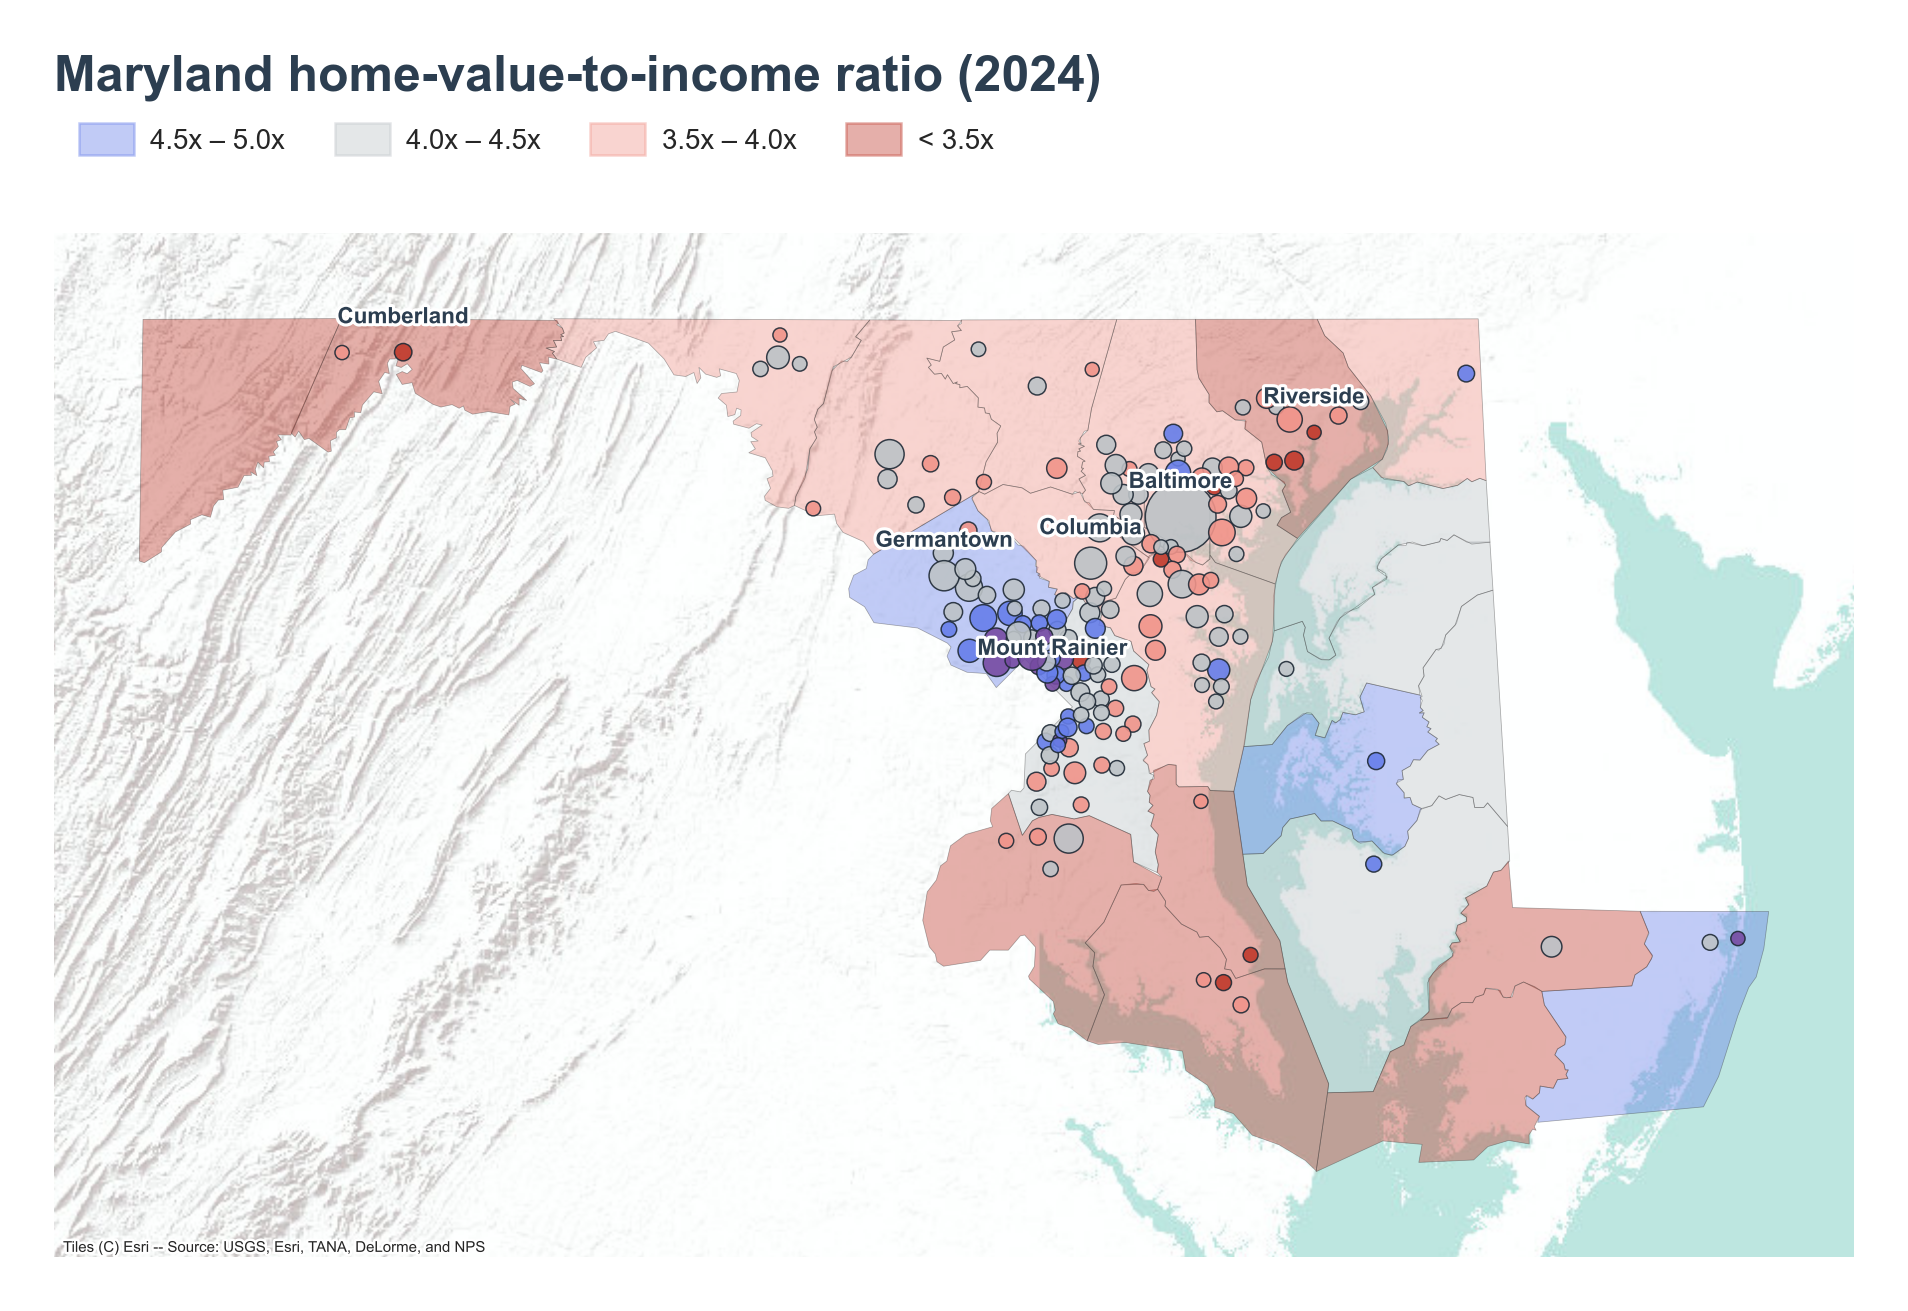
The widest gaps between home value and income sit in the Washington, D.C. suburbs of Prince George's and Montgomery counties. Mount Rainier tops the list at 7.73x, the highest in the state, on a median home value of $529,600 against median household income of $68,505. Mount Rainier began as a streetcar suburb of Washington in the late 19th century, built around cheap commuter housing along an early rail line to the capital, and its historic core is now known as the Gateway Arts District .
Marlow Heights follows at 6.98x (home value $387,600, income $55,502), then Takoma Park at 6.93x (home value $749,200, income $108,136). Unlike Mount Rainier and Marlow Heights, Takoma Park's high ratio comes from a high home value paired with a relatively high income rather than a low one — it is a planned Montgomery County commuter suburb dating to 1883, long known locally as "Azalea City."
White Oak (6.88x) and Silver Spring (6.44x) round out the top places, both also in Montgomery County. At the county level, Montgomery County itself leads at 4.83x, reflecting its status as one of the wealthiest, highest-home-value counties ringing Washington, D.C., where average household income ranks among the highest of any U.S. county .
Where the ratio runs lowest
Cumberland, in Maryland's western panhandle, posts one of the state's lowest place ratios at 2.56x, on a median home value of just $123,200. Cumberland was once Maryland's second-largest city and a major 19th- and 20th-century manufacturing hub for coal, glass, and tin, a base that has since declined , leaving home values well below the state's high-cost suburbs. Allegany County, where Cumberland sits, is the lowest-ratio county in the state at 2.60x.
Riverside, on the map northeast toward Baltimore, sits at the bottom among places at 2.33x, with home value of $246,100 against income of $105,785 — a low ratio driven by income well above the state median rather than an unusually cheap home.
The remaining low counties — Somerset (2.67x), Wicomico (3.34x), St. Mary's (3.41x), and Calvert (3.44x) — sit on the Eastern Shore and Southern Maryland, distinct from the high-ratio Eastern Shore counties of Talbot (4.83x), Worcester (4.58x), Dorchester (4.24x), and Caroline (4.24x) shown in lighter shading elsewhere on the Shore. Chesapeake Ranch Estates (2.79x) and California (2.89x), both in Southern Maryland, and Joppatowne (2.90x), north of Baltimore, complete the bottom places — each combining moderate home values with income well above the state median.
Home values are outpacing income
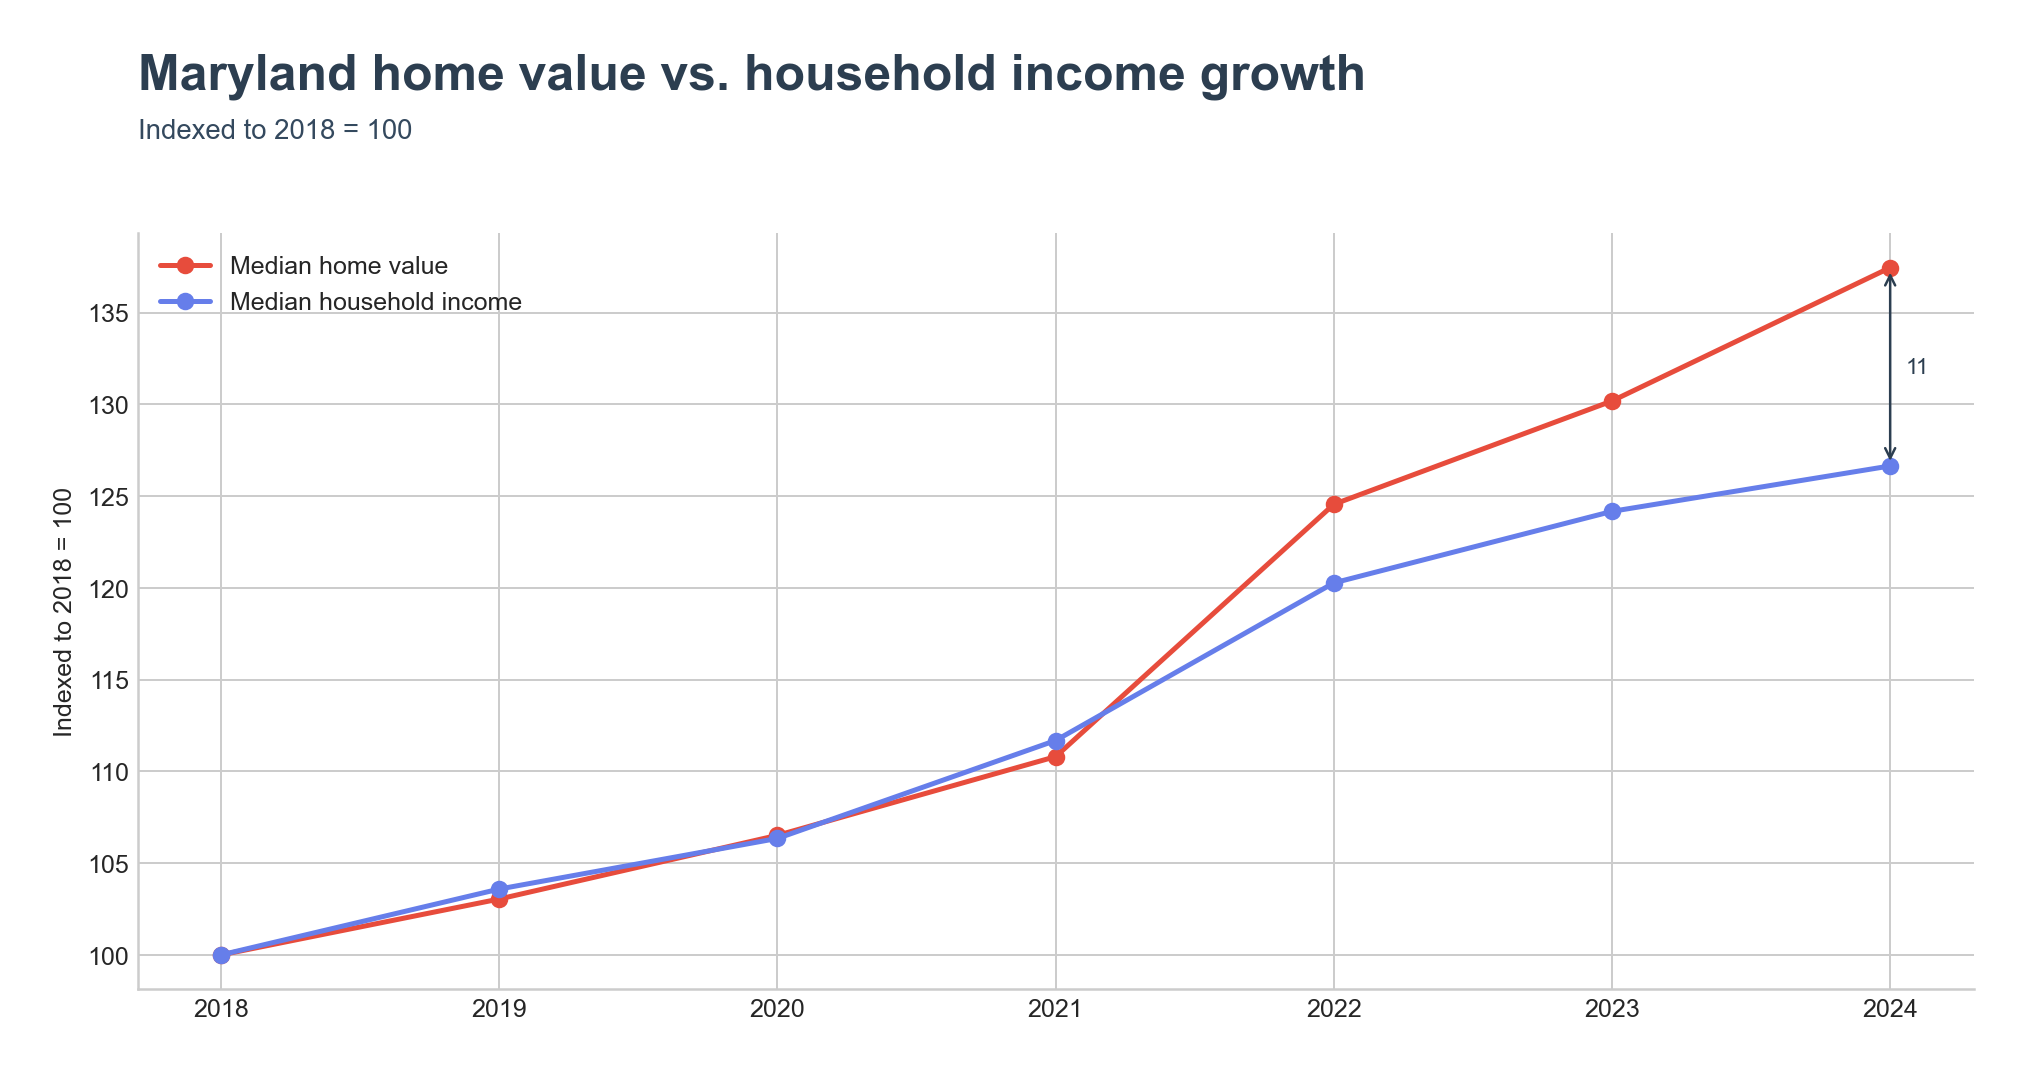
Since 2018, Maryland's median home value and median household income tracked closely through 2021, then diverged, with home value pulling further ahead of income through 2024.
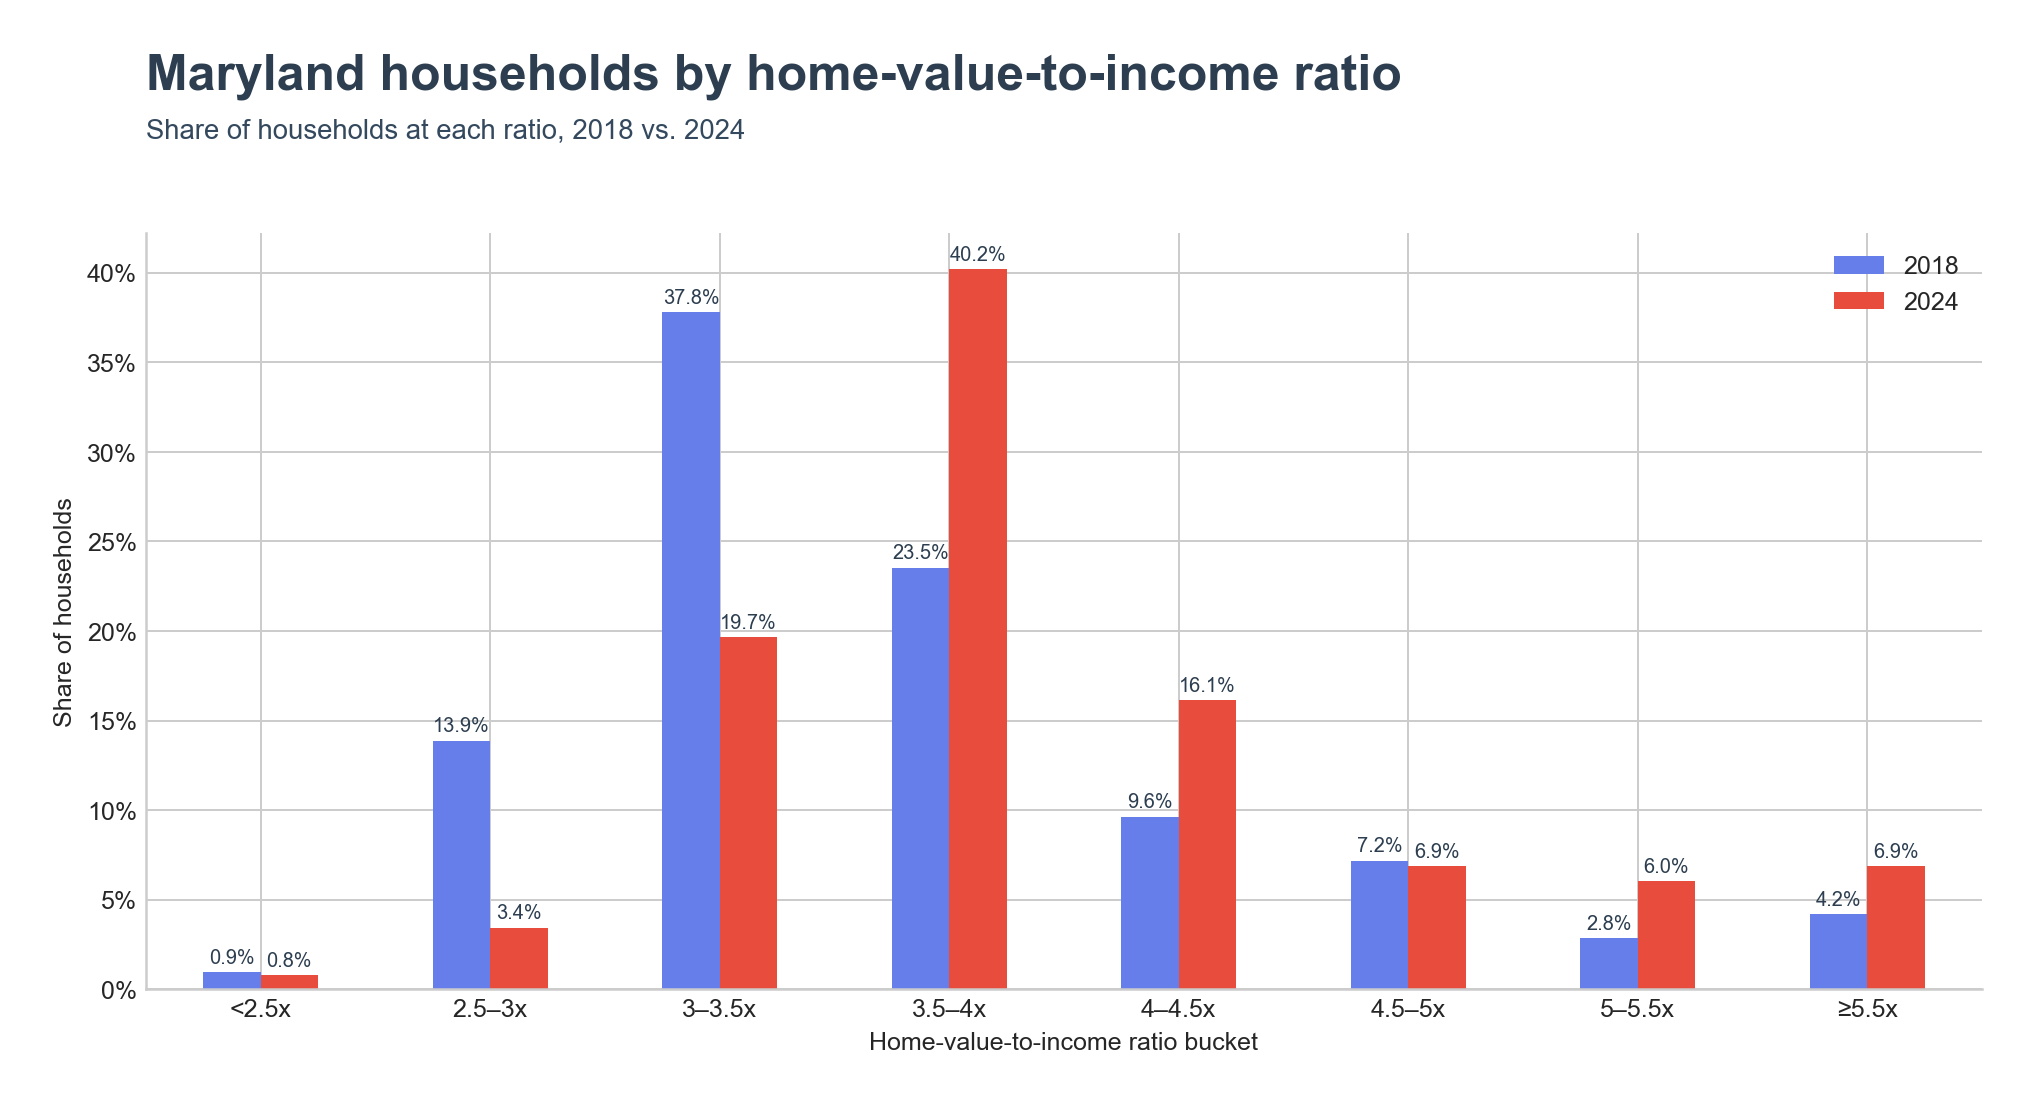
The distribution of households across ratio bands shifted higher over the same period. In 2018, the largest share of households, 37.8%, sat in the 3–3.5x band; by 2024, the largest share, 40.2%, had moved up to the 3.5–4x band. The ≥5.5x band alone grew from 4.2% of households in 2018 to 6.9% in 2024.
Key Takeaways
- Maryland's home-value-to-income ratio was 4.05x in 2024, versus 4.12x for the United States.
- Mount Rainier had the highest ratio among highlighted places, 7.73x, followed by Marlow Heights (6.98x) and Takoma Park (6.93x).
- Montgomery County led all counties at 4.83x, narrowly ahead of Talbot County (4.83x) and Worcester County (4.58x).
- Riverside had the lowest ratio among highlighted places, 2.33x; Allegany County had the lowest among counties, 2.60x.
- Since 2018, Maryland's indexed home value has risen faster than indexed household income, most sharply after 2021.
- The share of Maryland households at a ratio of ≥5.5x rose from 4.2% in 2018 to 6.9% in 2024.