A widening gap statewide
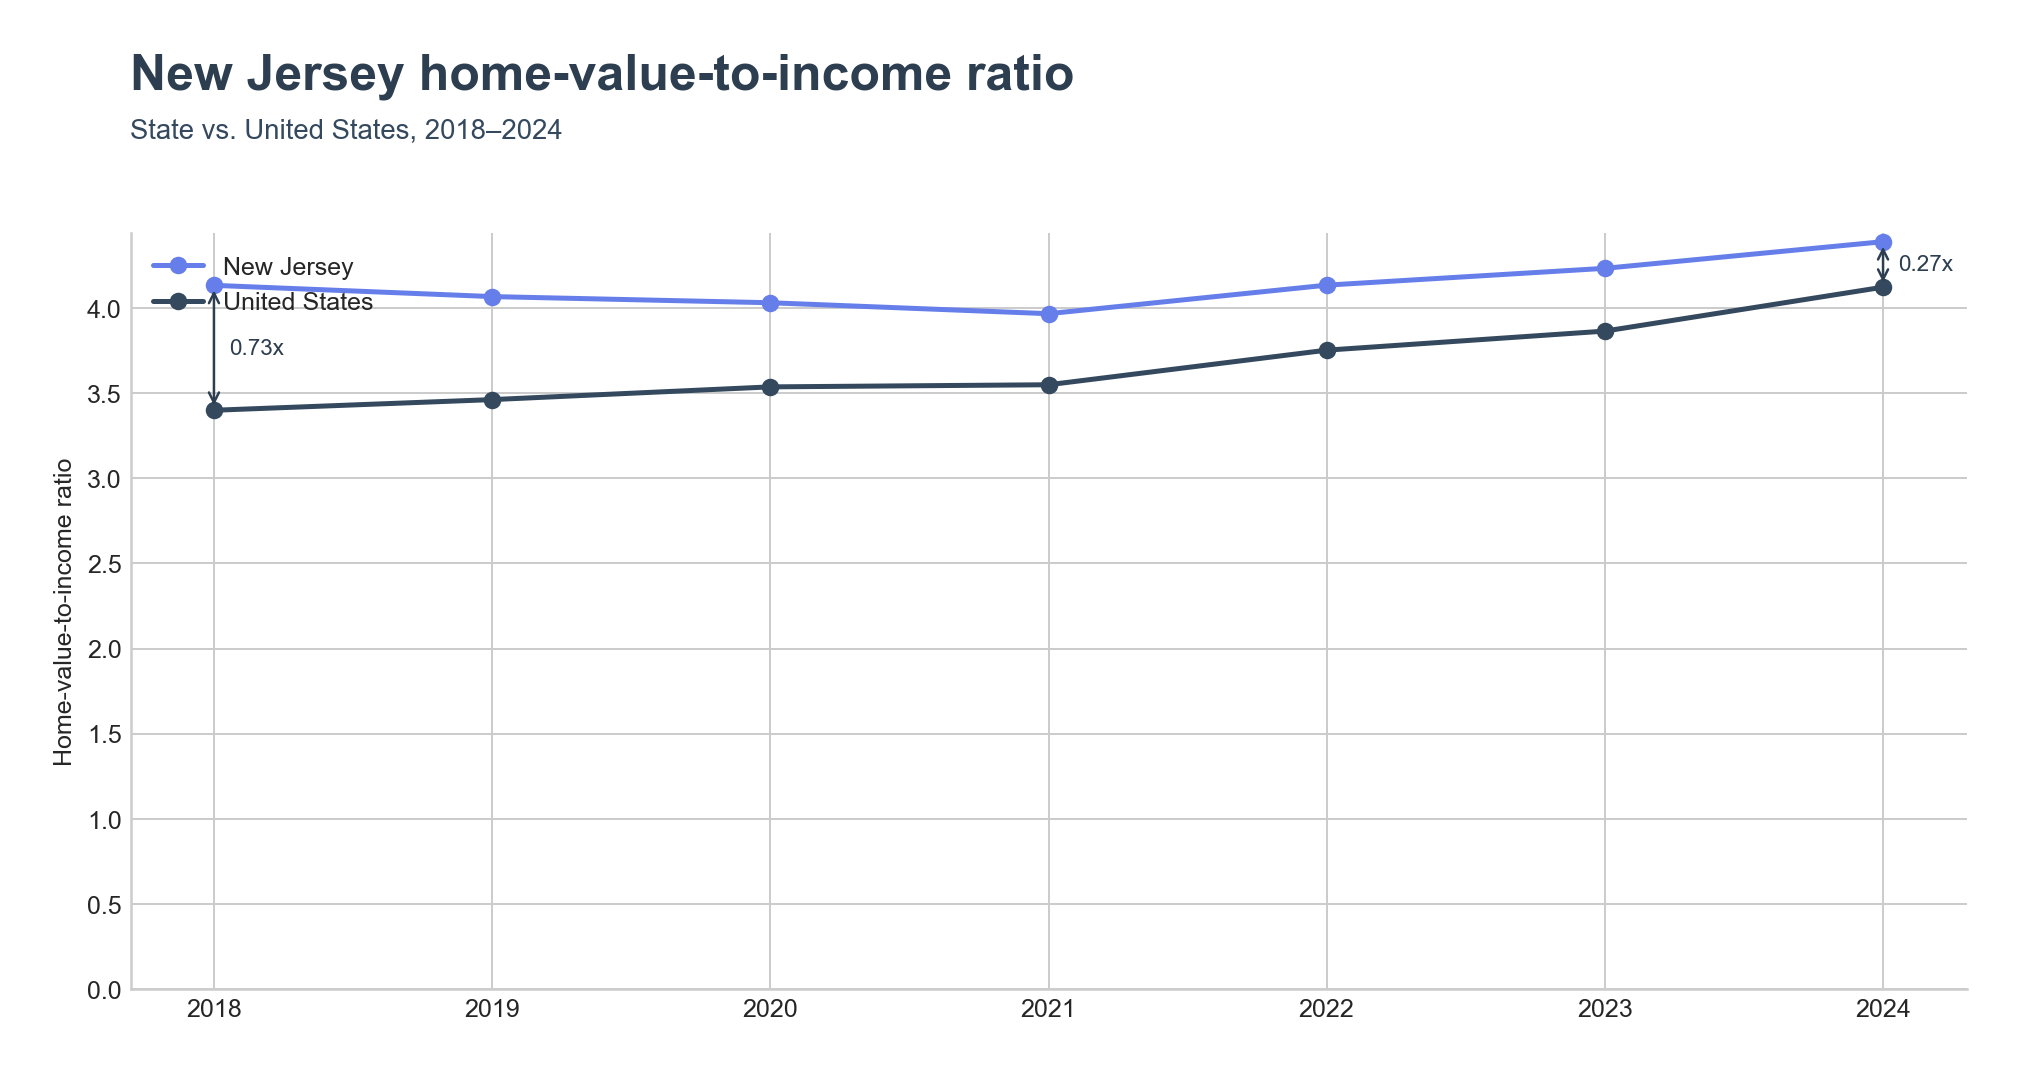
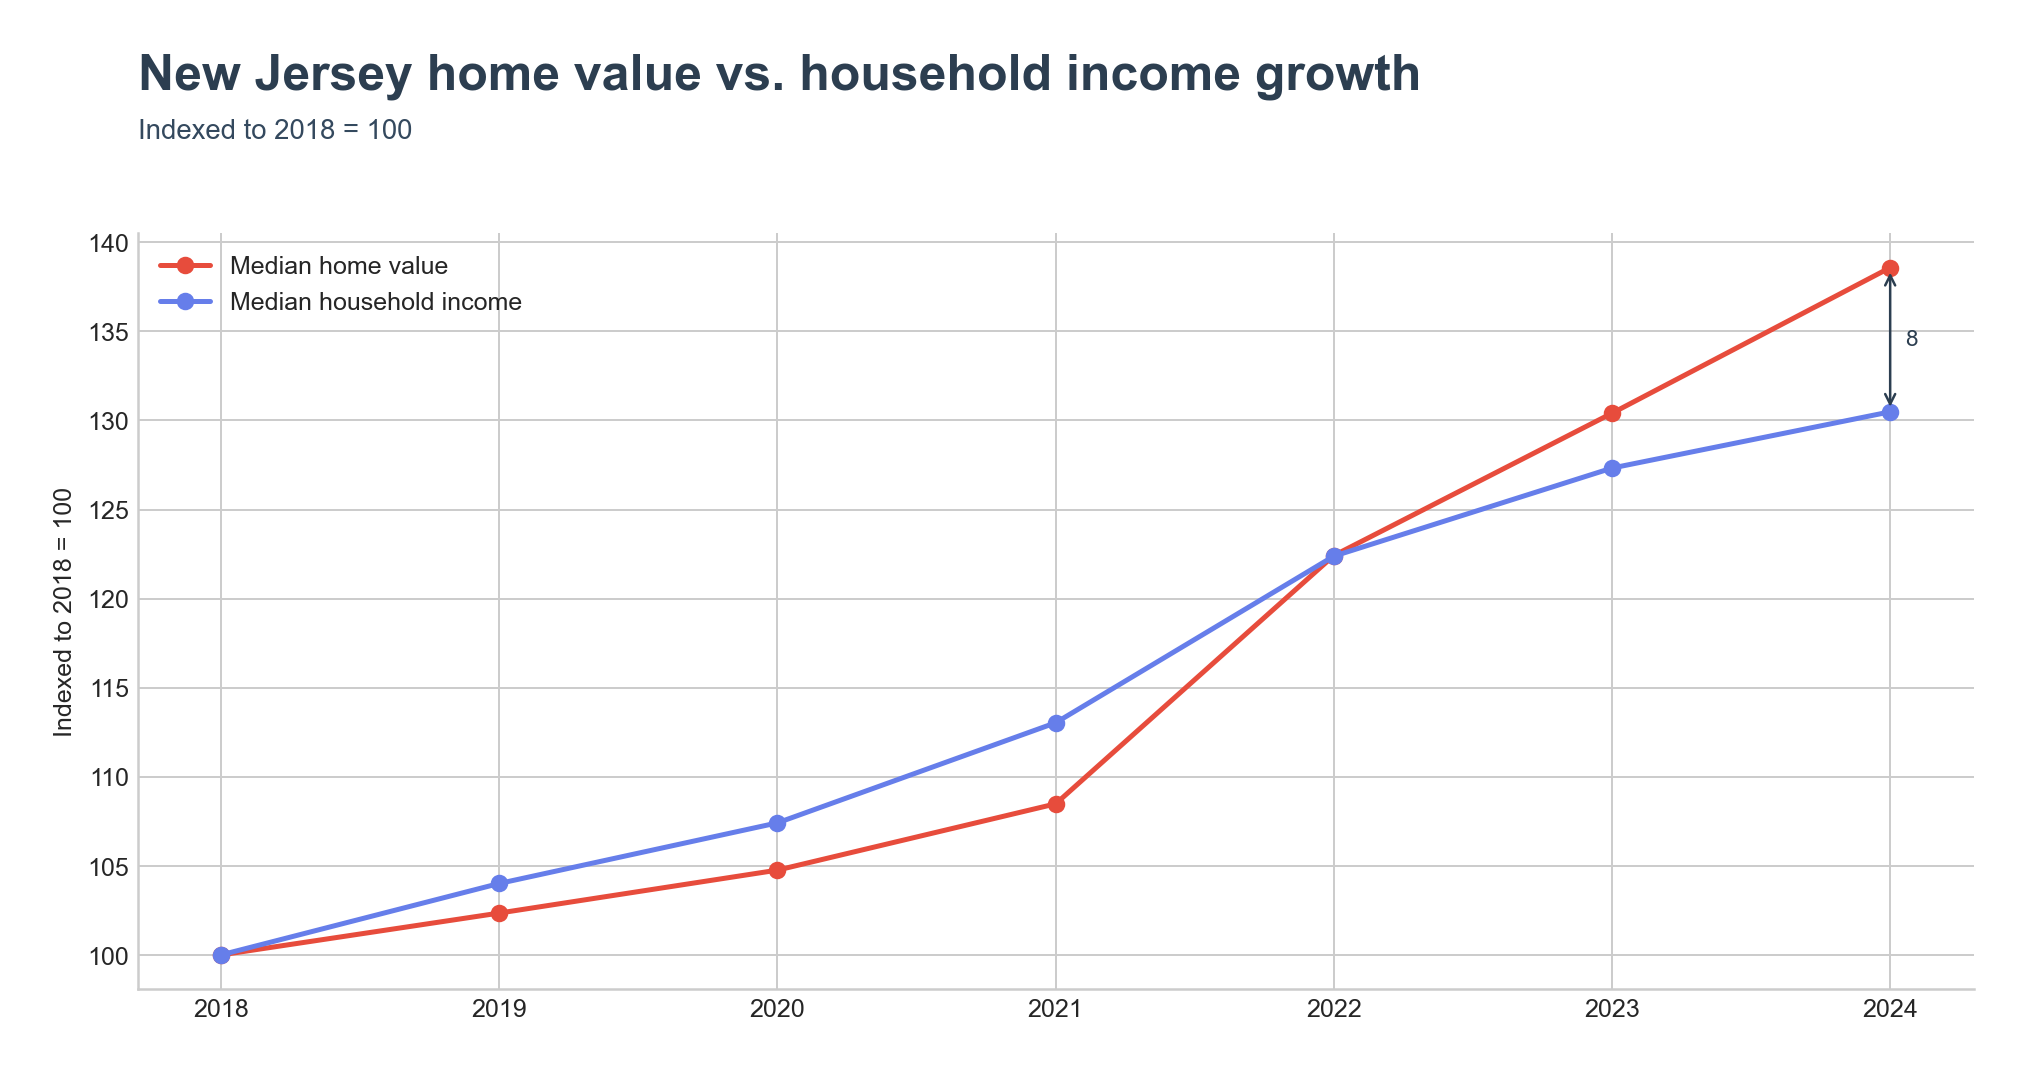
New Jersey's home-value-to-income ratio reached 4.39x in 2024, up from 4.13x in 2018, and now sits above the national figure of 4.12x. Home value growth has outpaced income growth statewide: median home value rose to $454,400 while median household income rose to $103,556, and the indexed comparison shows home value gaining 8 more index points than income since 2018.
Where the ratio runs highest
Lakewood posts the state's highest home-value-to-income ratio, at 12.56x — a median home value of $715,500 against median household income of just $56,968. Lakewood's Orthodox Jewish population, over half of township residents , drives an unusually young, large-household demographic, which pulls median household income down relative to home values even as families own homes.
Belmar, on the Jersey Shore, follows at 9.21x (home value $861,800, income $93,573). Belmar's tiny footprint, more than a third of it water, combined with oceanfront access constrains supply, and a large share of its housing stock is seasonal or vacation-occupied , a pattern that inflates prices against a resident income base.
Rounding out the top places: Ocean City at 8.26x, Fairview at 8.04x, and Passaic at 7.76x.
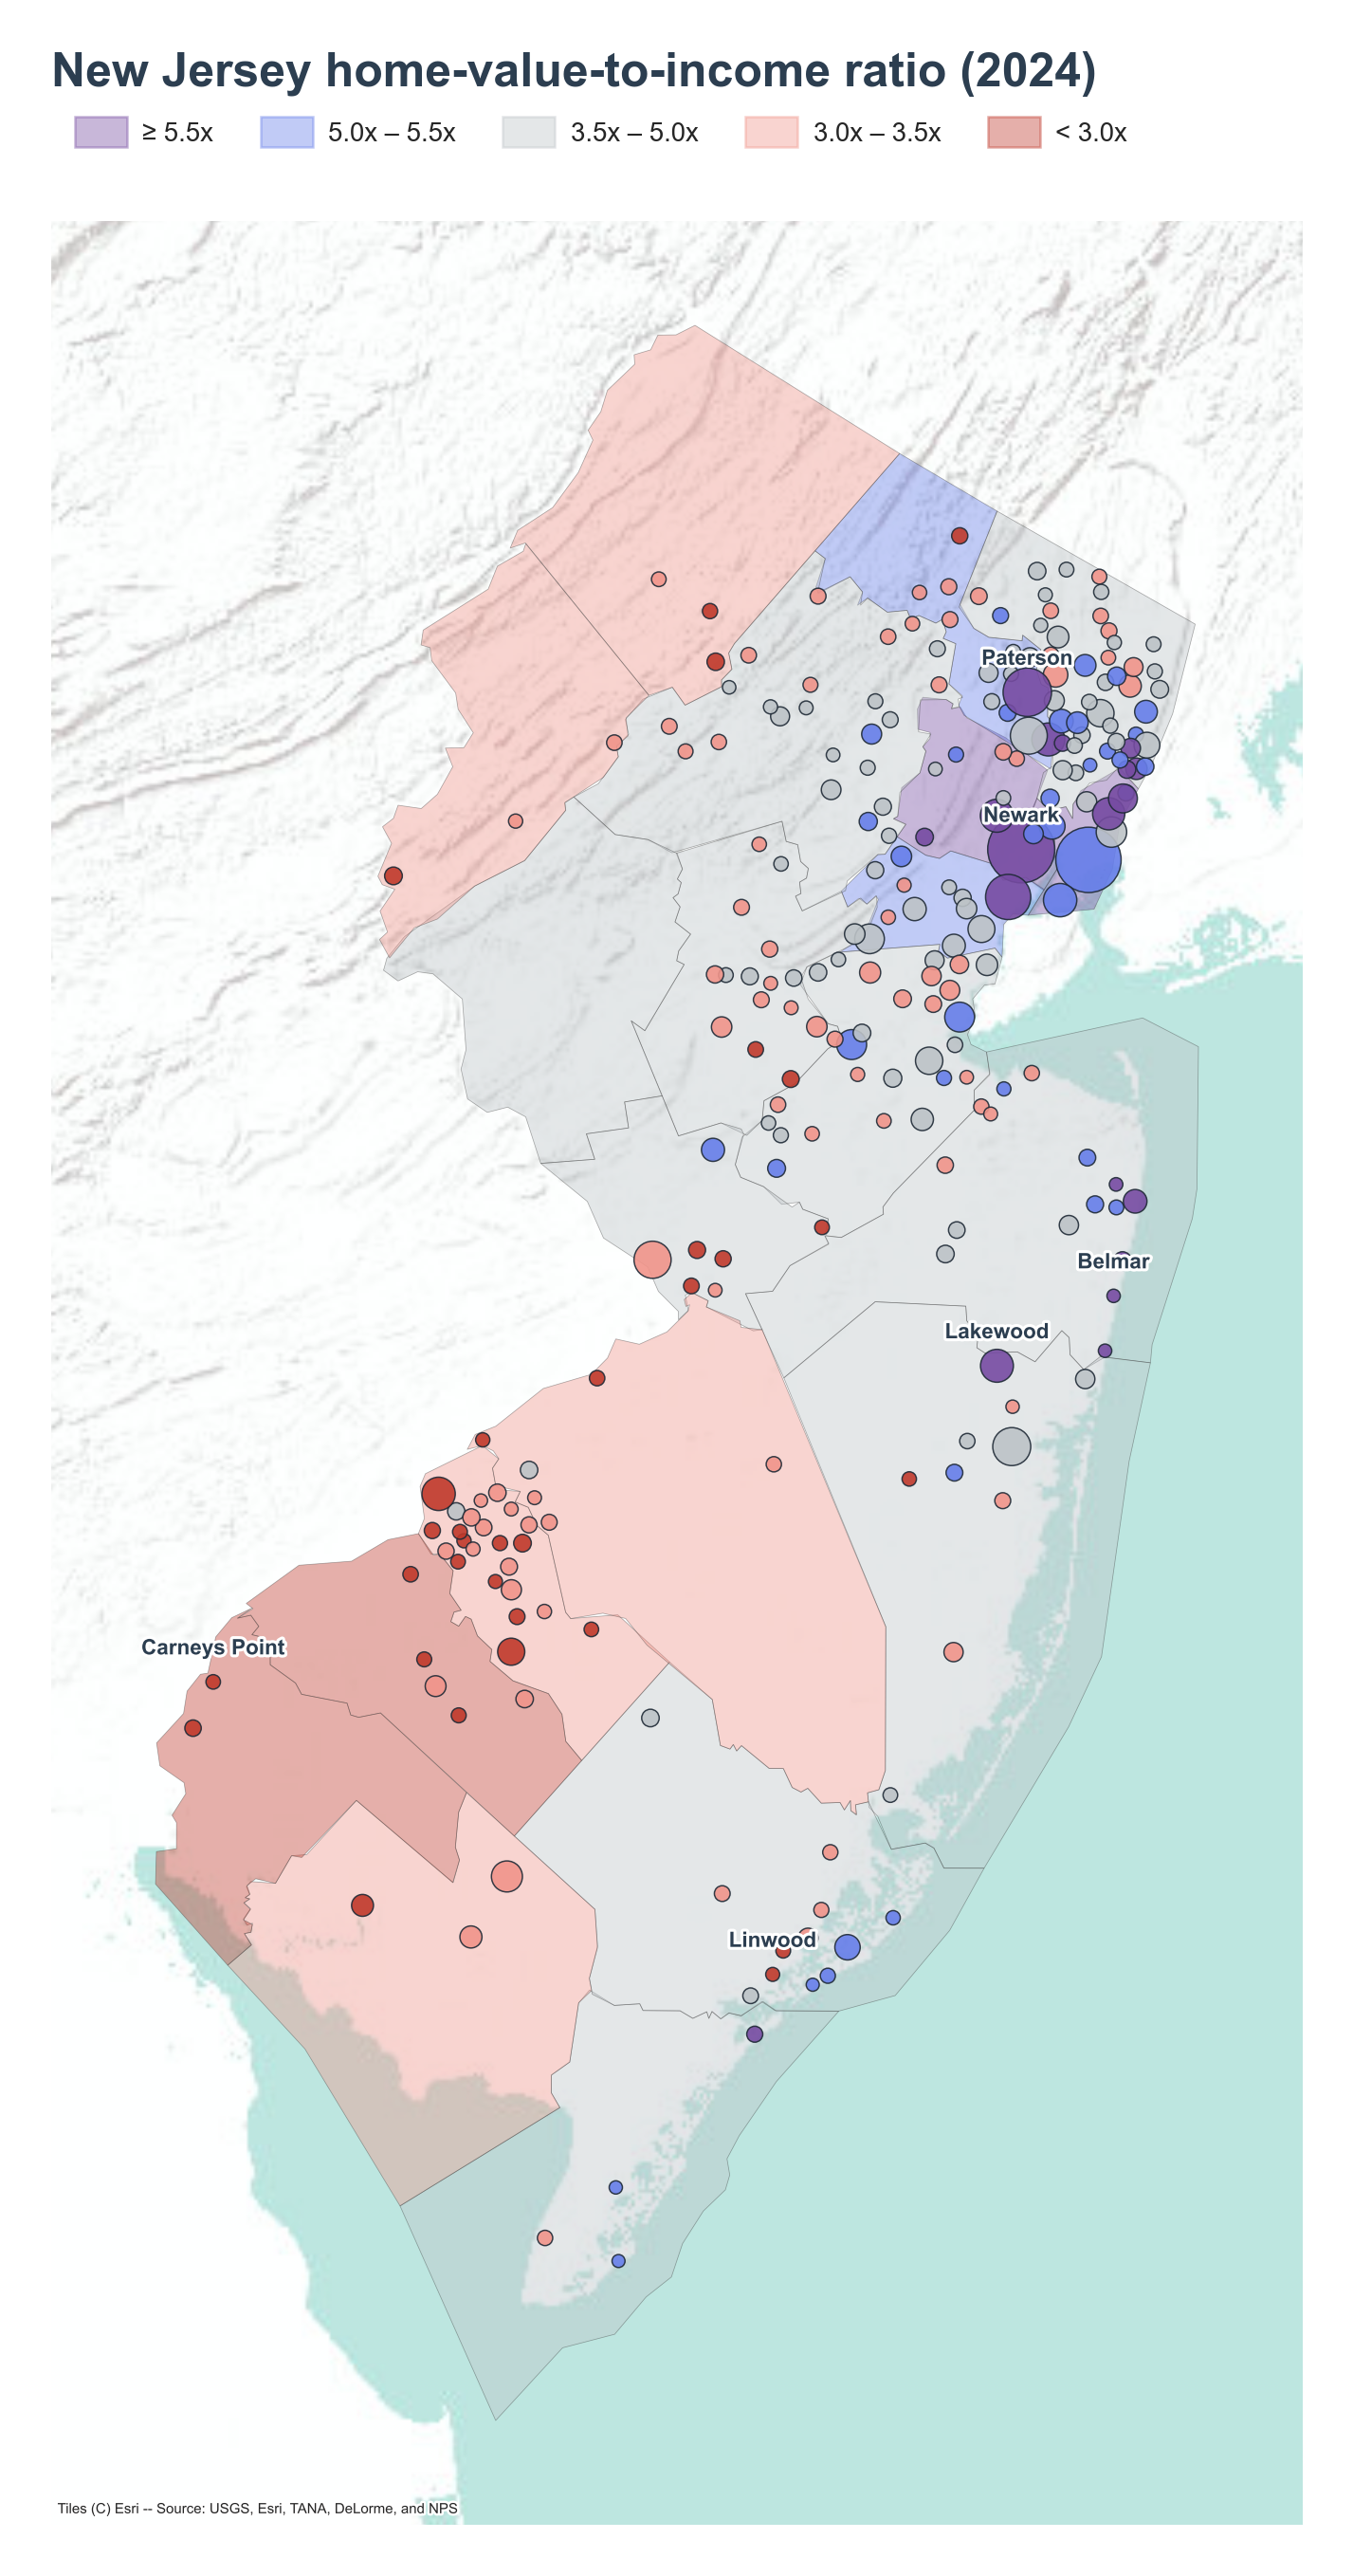
At the county level, the highest ratios cluster in the counties around Newark and the Hudson waterfront — Essex County (6.49x), Hudson County (5.88x), Passaic County (5.25x), Union County (5.13x), and Bergen County (4.99x). These are the same counties containing Newark and Paterson, both visible on the map as high-ratio clusters; Newark is a principal city of the New York metropolitan area with a large white-collar commuter base, a dynamic that pushes home values up relative to local household incomes across the surrounding counties.
Where the ratio runs lowest
Carneys Point, in the state's far southwest on the map, has the lowest ratio among places at 2.50x (home value $193,300, income $77,273). The township's economy has long centered on the DuPont Chambers Works chemical complex , a legacy industrial employer whose environmental liabilities have weighed on the local housing market even as the Turnpike corridor keeps household incomes comparatively steady.
Linwood (2.52x) and Crestwood Village (2.53x) follow closely, with Atco (2.60x) and Bridgeton (2.61x) also among the lowest. Linwood's low ratio reflects a high income base ($156,354) relative to a moderate home value ($394,700), the opposite pattern from the low-ratio places above it — an affluent suburb rather than a depressed one.
At the county level, the lowest ratios sit in the southern and northwestern counties: Gloucester County (2.95x), Salem County (3.00x, home to Carneys Point), Sussex County (3.18x), Camden County (3.23x), and Burlington County (3.27x).
The distribution is shifting toward higher ratios
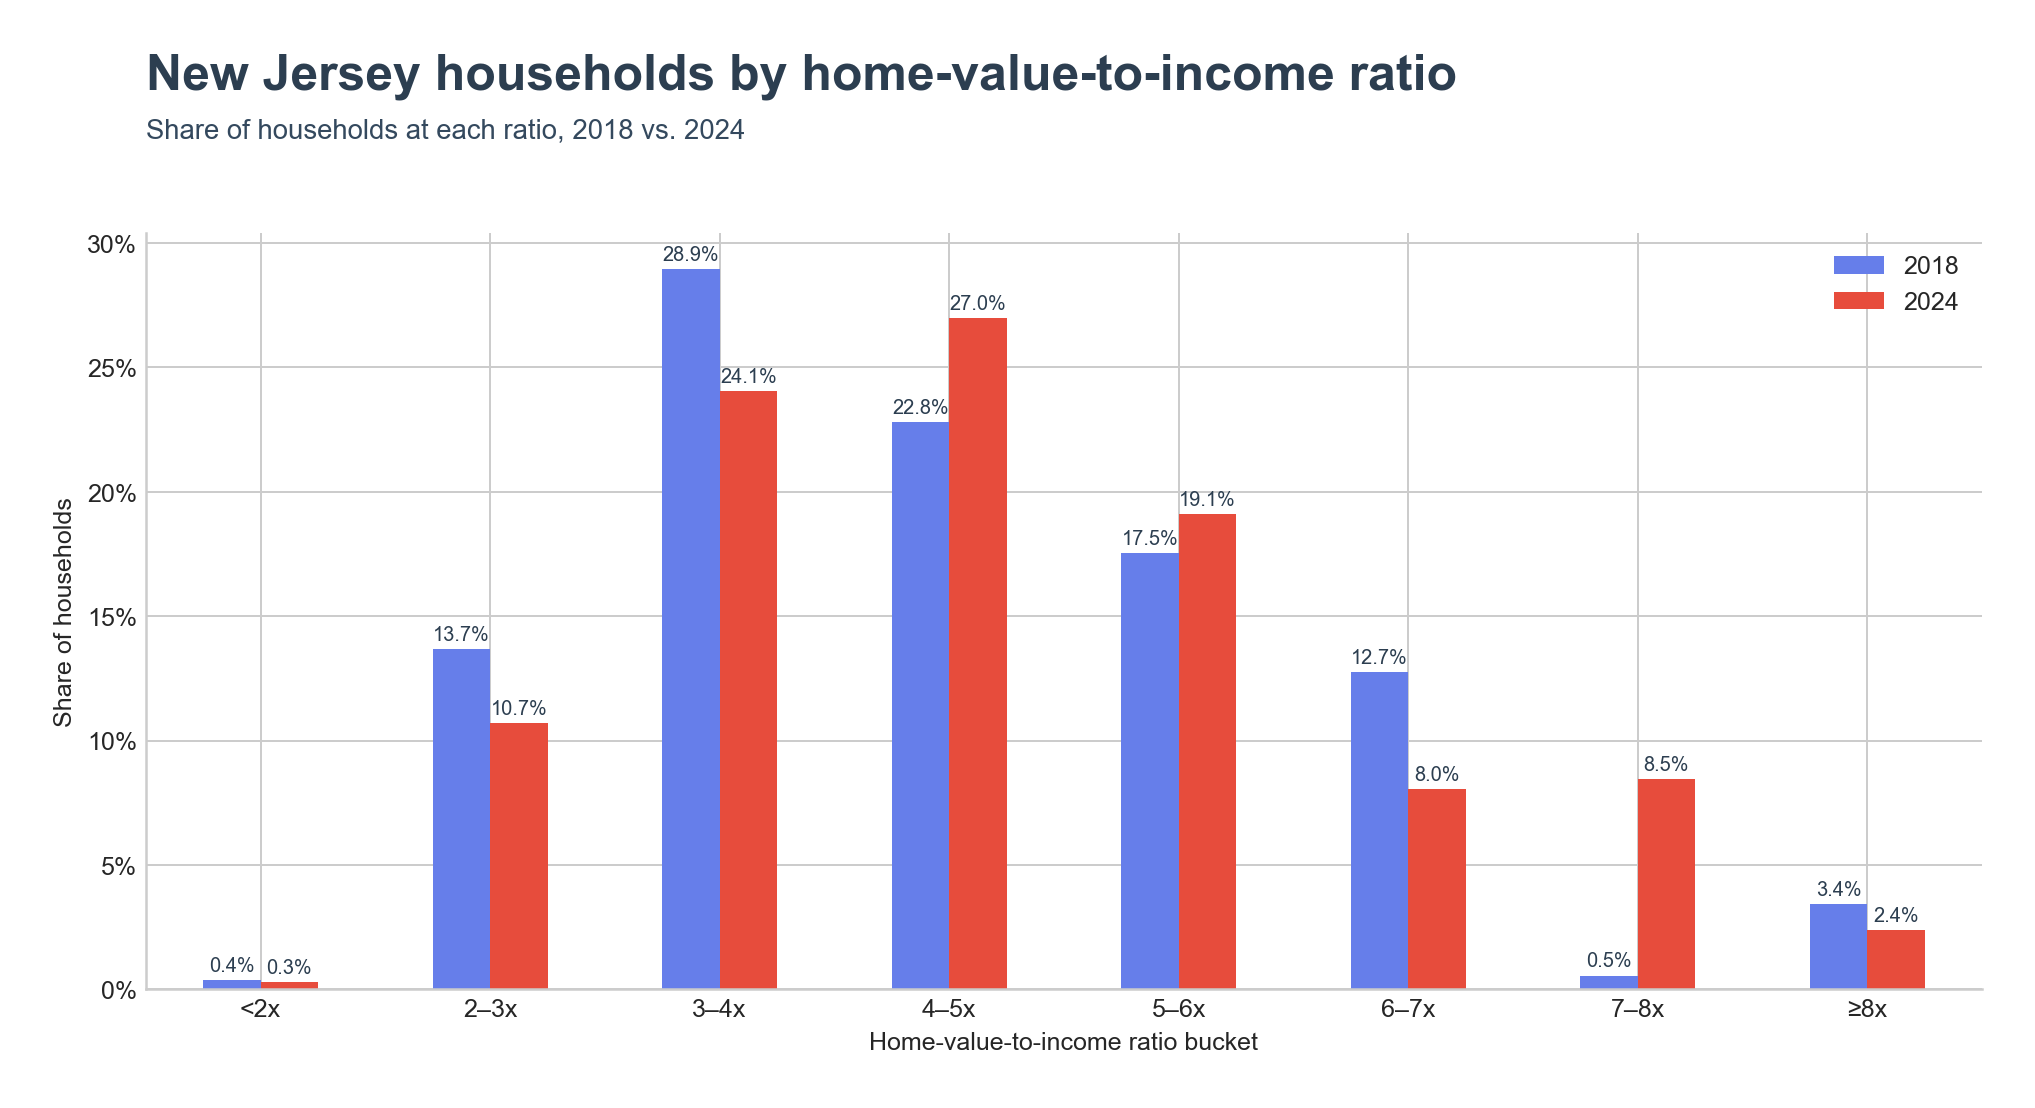
Between 2018 and 2024, the share of New Jersey households in the 3–4x bucket fell from 28.9% to 24.1%, while the 4–5x bucket grew from 22.8% to 27.0% and the 7–8x bucket grew from 0.5% to 8.5%. Fewer households sit in the moderate-ratio range than in 2018, and more have moved into higher-ratio territory.
Key Takeaways
- New Jersey's home-value-to-income ratio is 4.39x in 2024, above the US figure of 4.12x.
- Lakewood has the highest ratio among places, 12.56x, linked to its large-household Orthodox Jewish population.
- Belmar and Ocean City, both Jersey Shore towns, rank among the highest ratios, reflecting constrained seasonal housing supply.
- Essex, Hudson, Passaic, Union, and Bergen counties — the counties around Newark and Paterson — post the highest county-level ratios.
- Carneys Point has the lowest ratio among places, 2.50x, tied to the legacy DuPont Chambers Works industrial economy.
- The share of households in the 7–8x ratio bucket rose from 0.5% in 2018 to 8.5% in 2024.