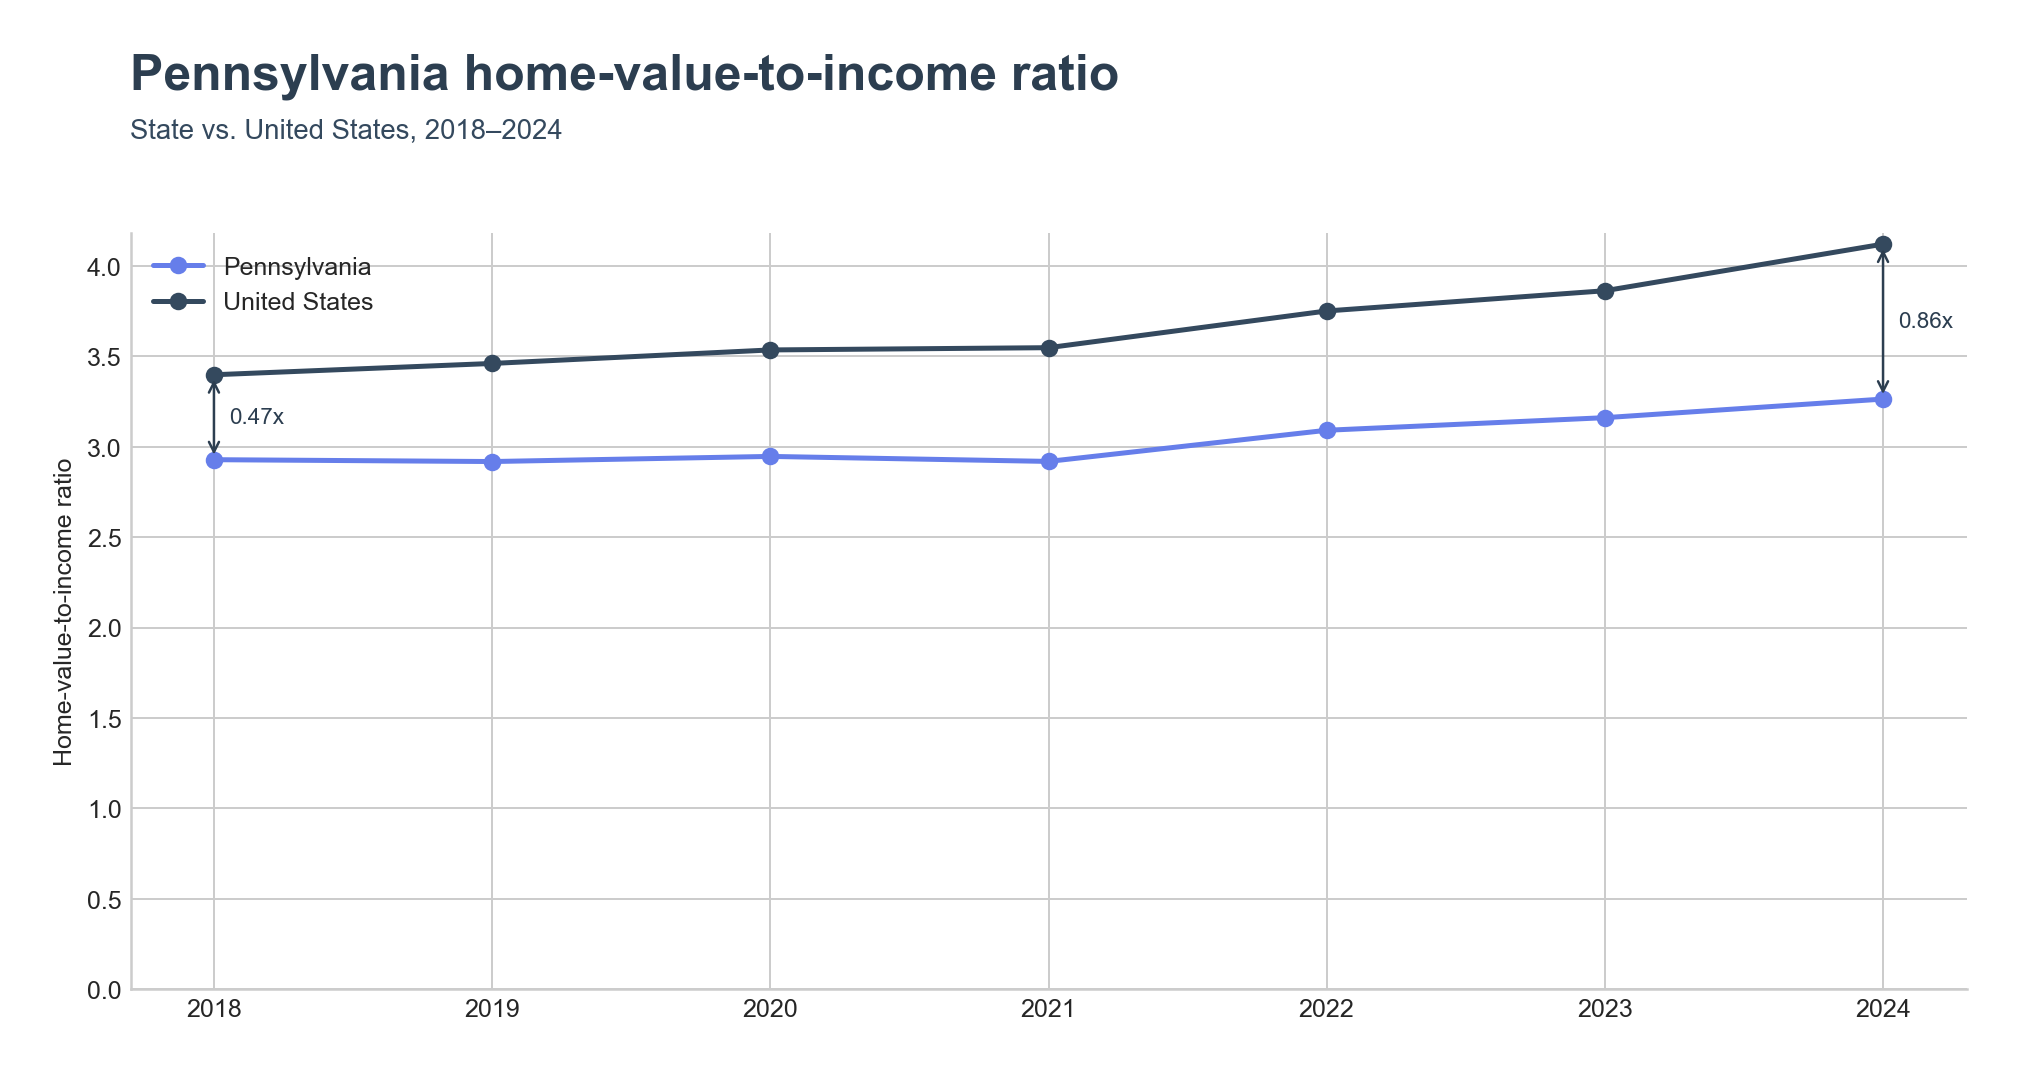
Pennsylvania's home-value-to-income ratio reached 3.26x in 2024, up from 2.93x in 2018. That is well below the United States figure of 4.12x, a gap of 0.86x that has widened from 0.47x in 2018 as national home values outpaced the state's.
Where the ratio runs highest
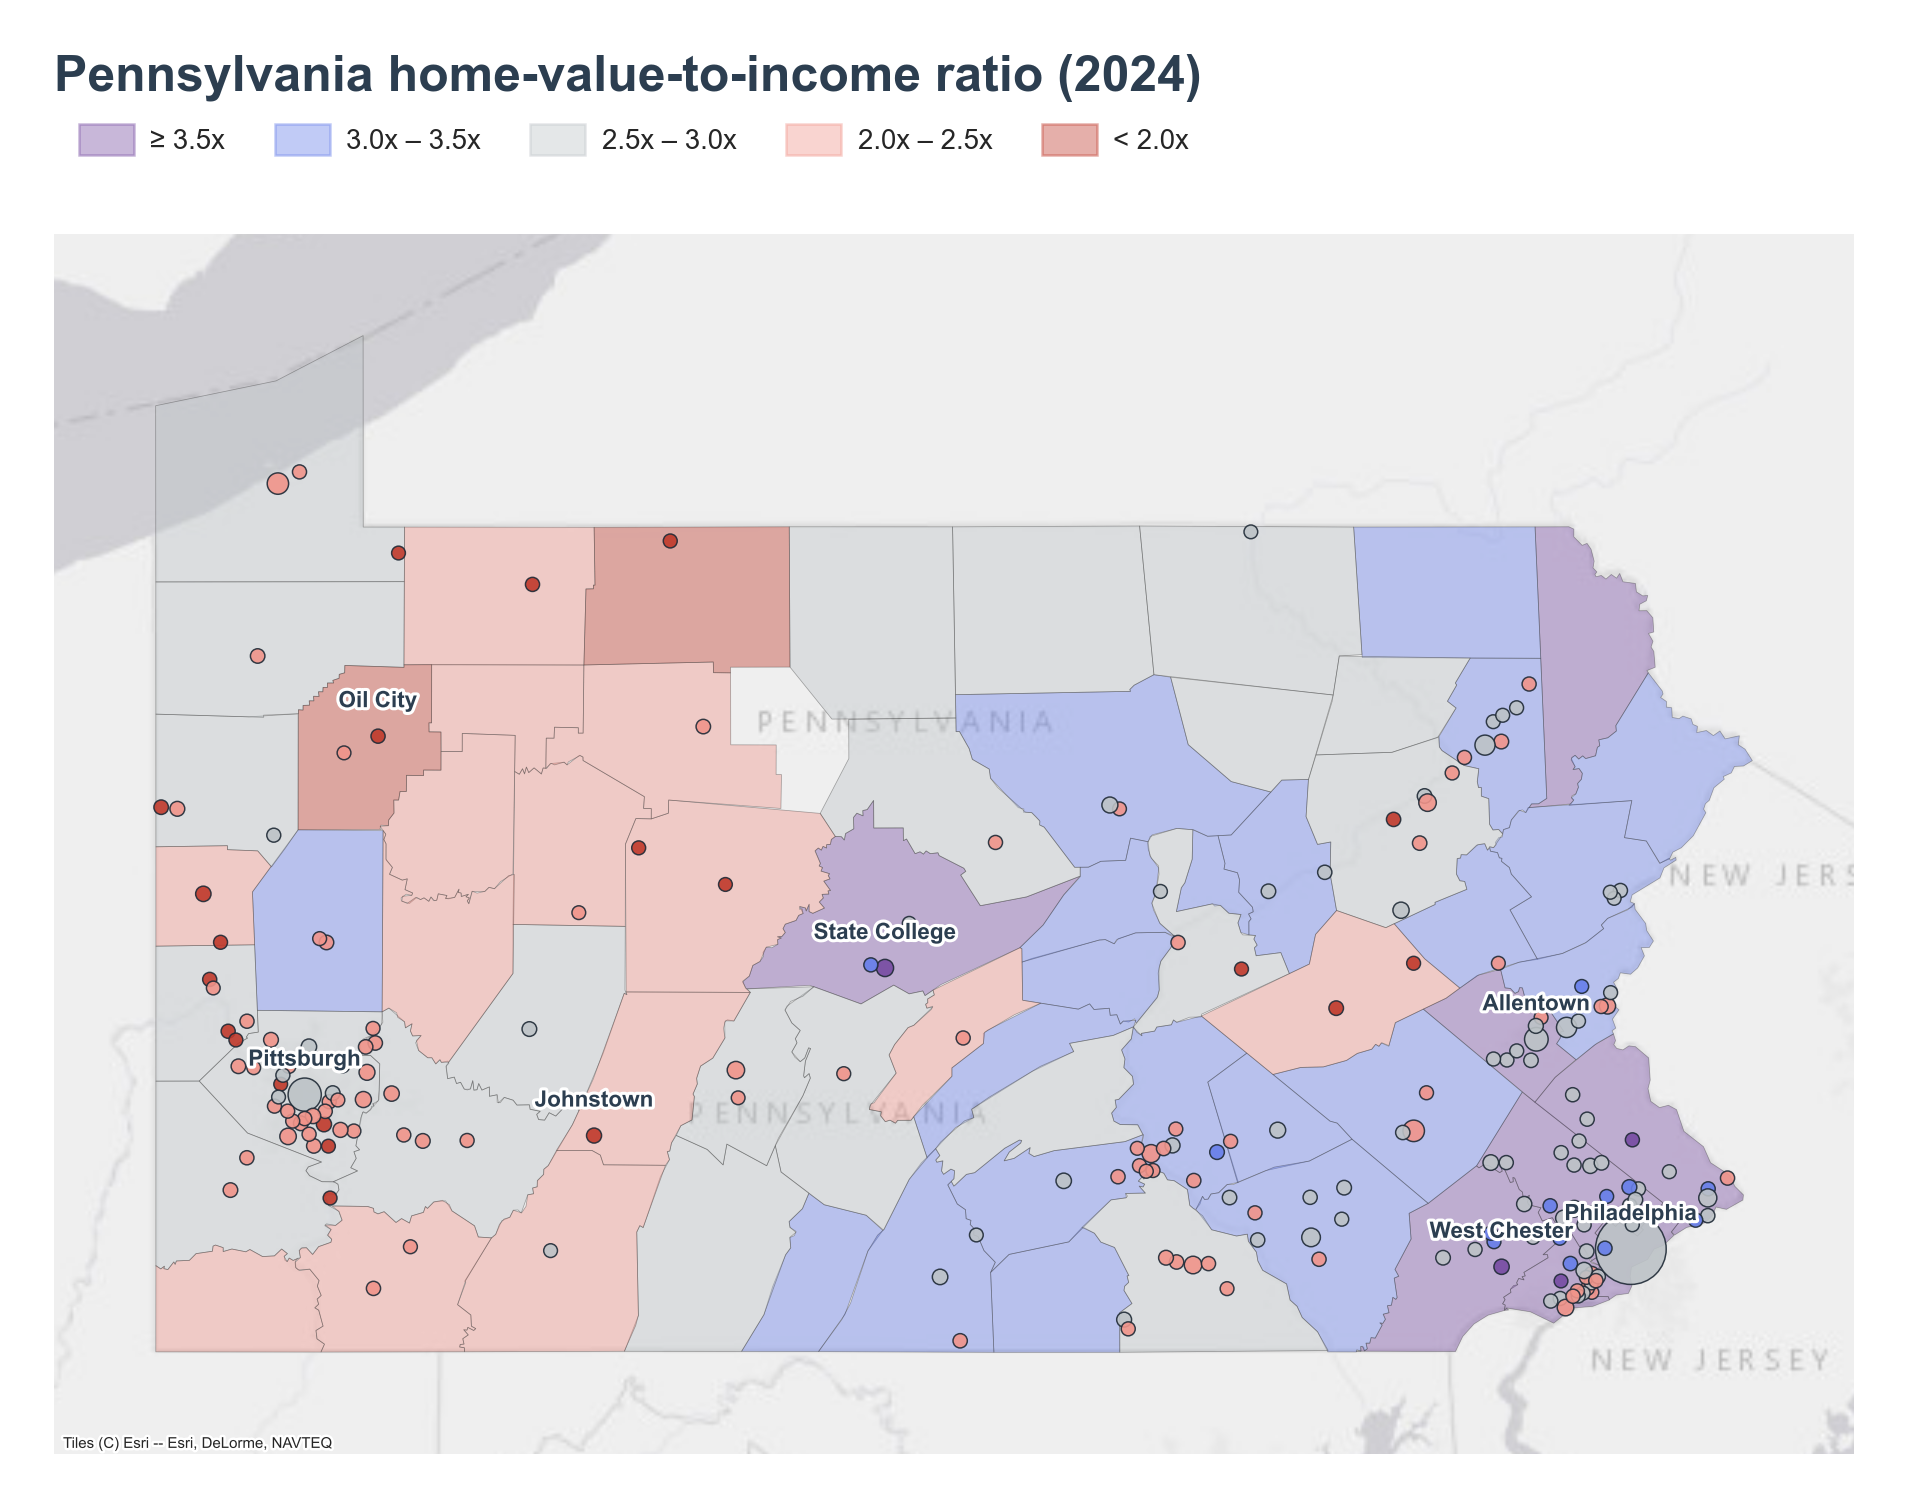
State College tops the state at 9.64x, a ratio built on a $437,800 median home value against just $45,424 in median household income. The mismatch reflects the borough's economy, which stayed stable through downturns because of the expanding Pennsylvania State University — a large student population depresses measured household income while proximity to the university supports home prices. On the map, State College sits alone as the only purple (≥3.5x) block in central Pennsylvania, well outside the blue-and-purple cluster around Philadelphia.
West Chester, the Chester County seat inside the Philadelphia metropolitan area, follows at 6.26x ($490,700 home value, $78,385 income). Unlike State College, West Chester's high ratio comes from elevated home values, not depressed income — its household income is nearly double the state figure. Doylestown (5.31x) and Media (5.25x) sit in the same southeastern cluster on the map, both close to Philadelphia, and both pair strong household incomes ($99,322 and $89,092) with home values of $527,700 and $467,800, so the ratio there is driven by home values rather than any income shortfall. Park Forest Village (4.92x), just outside State College, rounds out the top five places.
At the county level, Centre County — home to State College — leads at 4.35x, followed by Philadelphia County (3.92x), Bucks County (3.88x), Wayne County (3.88x), and Montgomery County (3.83x). The county map shows the purple and blue high-ratio band concentrated in the southeast, around Philadelphia and its suburban counties, plus the isolated Centre County pocket in the middle of the state.
Where the ratio runs lowest
Johnstown, in the southwest, posts the lowest ratio in the state at 1.20x ($45,400 home value, $37,888 income). The city's decline traces to the collapse of its steel industry: the Cambria Iron Works and later steelmaking anchored the city's growth in the 19th century , and the region has seen sustained population and economic decline since major steel operations wound down. On the map, Johnstown sits in a red (<2.0x) patch southwest of State College.
Oil City, in the northwest, is close behind at 1.44x ($74,100 home value, $51,316 income). Oil City was once central to the American petroleum industry after wells were drilled there in 1861, but Pennsylvania's oil production peaked in 1891 and had fallen to under 10% of the nation's output by 1907 as production shifted to Texas, California, and Oklahoma. The map shows Oil City and the surrounding McKean and Venango county area shaded red, the lowest-ratio region in the state.
Shamokin (1.52x), Bradford (1.52x), and Sharon (1.73x) fill out the bottom five places, all small former industrial and manufacturing towns scattered across the state's north and west.
At the county level, McKean County (1.66x), Venango County (1.95x), Elk County (2.01x), Cambria County (2.07x), and Warren County (2.11x) form the low-ratio cluster in the state's north-central and northwest counties — the same red-and-pink band visible on the map around Oil City and Johnstown.
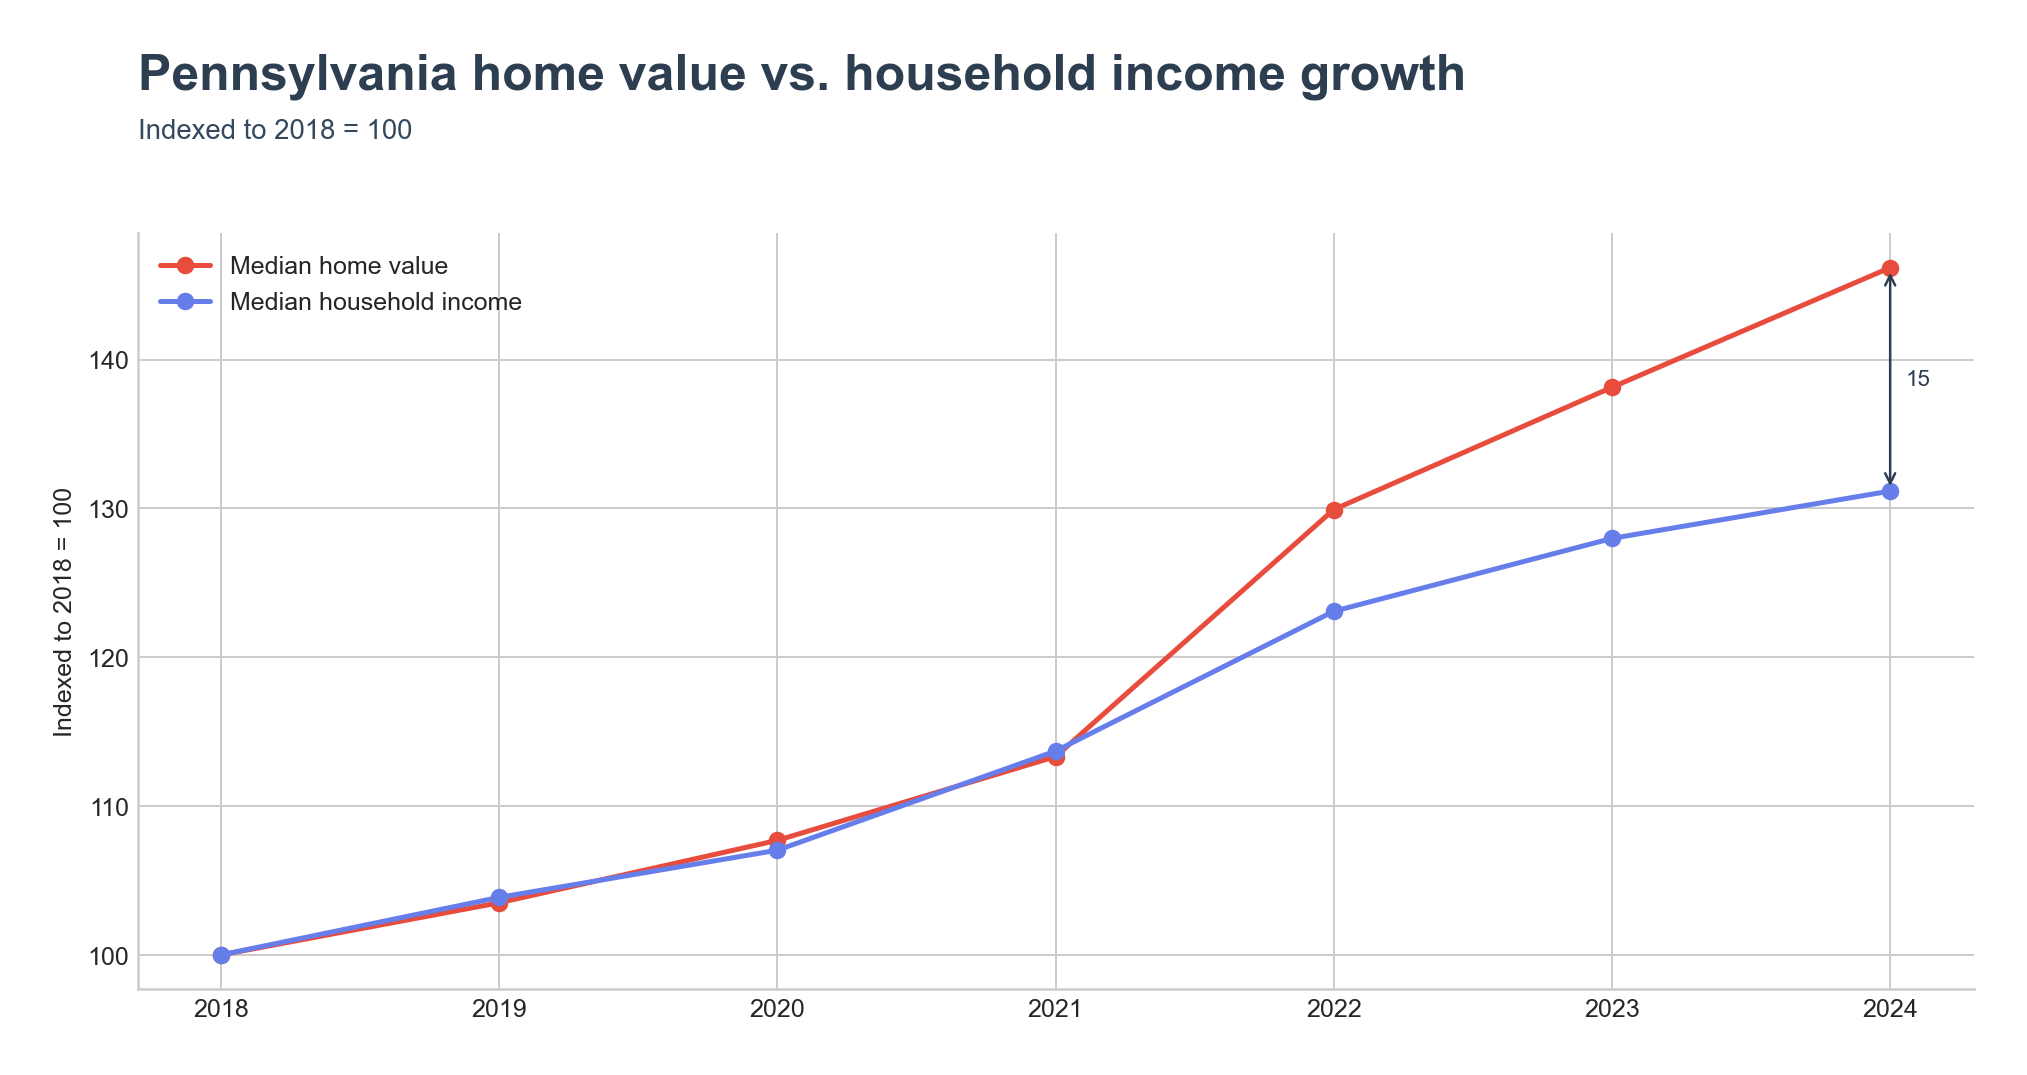
Since 2018, Pennsylvania's median home value has risen to an index of roughly 146 (2018 = 100), while median household income has risen to about 131 — a gap of 15 index points that opened mostly after 2021.
How the distribution has shifted
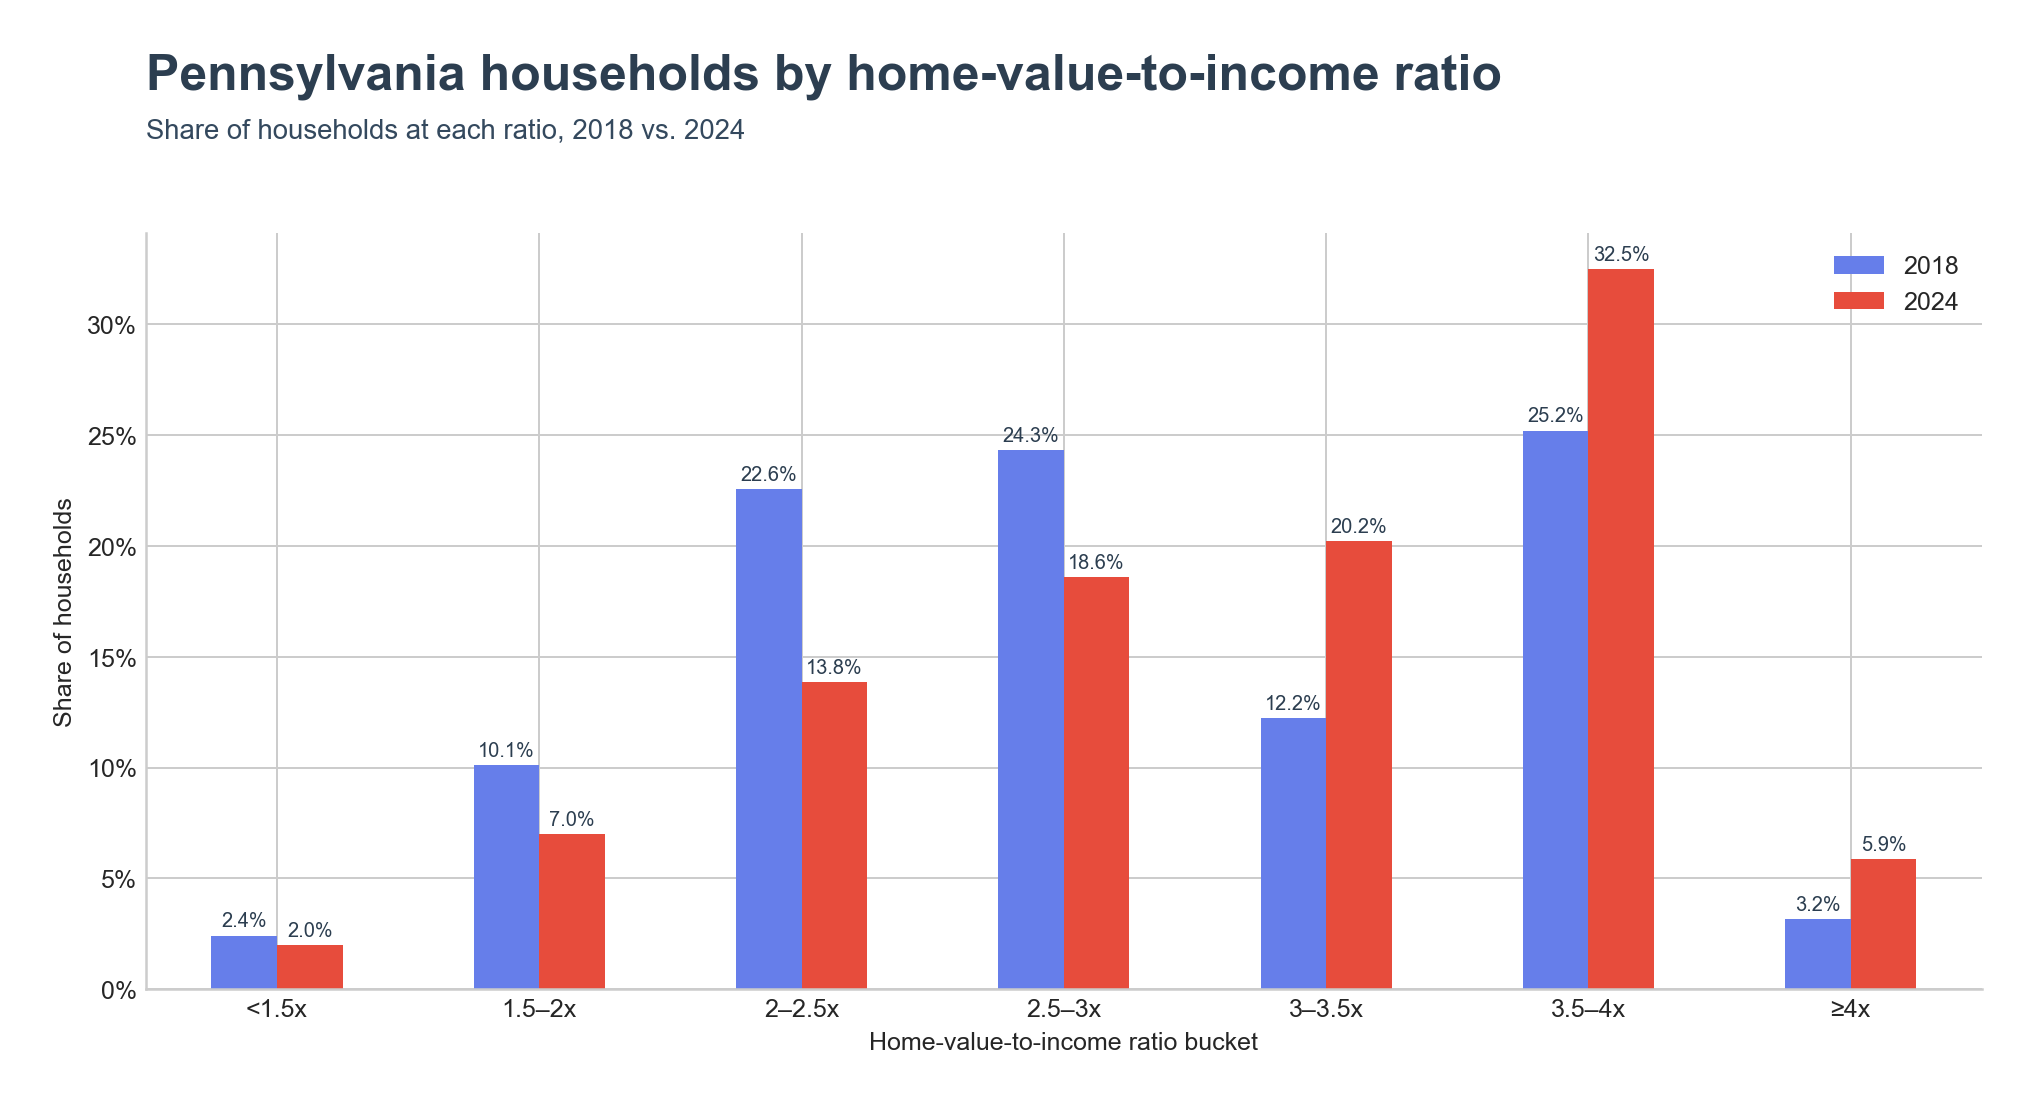
The share of Pennsylvania households in places with a ratio of 3.5–4x grew from 25.2% in 2018 to 32.5% in 2024. The ≥4x bucket also grew, from 3.2% to 5.9%. Meanwhile, the lower brackets thinned out: the 2–2.5x bucket fell from 22.6% to 13.8%, and the 2.5–3x bucket fell from 24.3% to 18.6%. The 3–3.5x bucket picked up much of that movement, rising from 12.2% to 20.2% — the largest single-bucket gain in the state. Overall, households have shifted from the middle of the distribution toward its higher end.
Key Takeaways
- Pennsylvania's home-value-to-income ratio is 3.26x in 2024, versus 4.12x nationally.
- The gap to the national ratio widened from 0.47x in 2018 to 0.86x in 2024.
- State College has the highest place-level ratio in the state at 9.64x, driven by a student-heavy population that depresses measured income.
- West Chester, Doylestown, and Media — all in the Philadelphia suburbs — round out the rest of the top five places, driven by high home values.
- Johnstown (1.20x) and Oil City (1.44x) post the lowest ratios, both former industrial hubs following the decline of steel and oil, respectively.
- The share of households in the 3.5–4x bucket grew from 25.2% to 32.5% between 2018 and 2024, and the 3–3.5x bucket posted the largest single-bucket gain, from 12.2% to 20.2%.