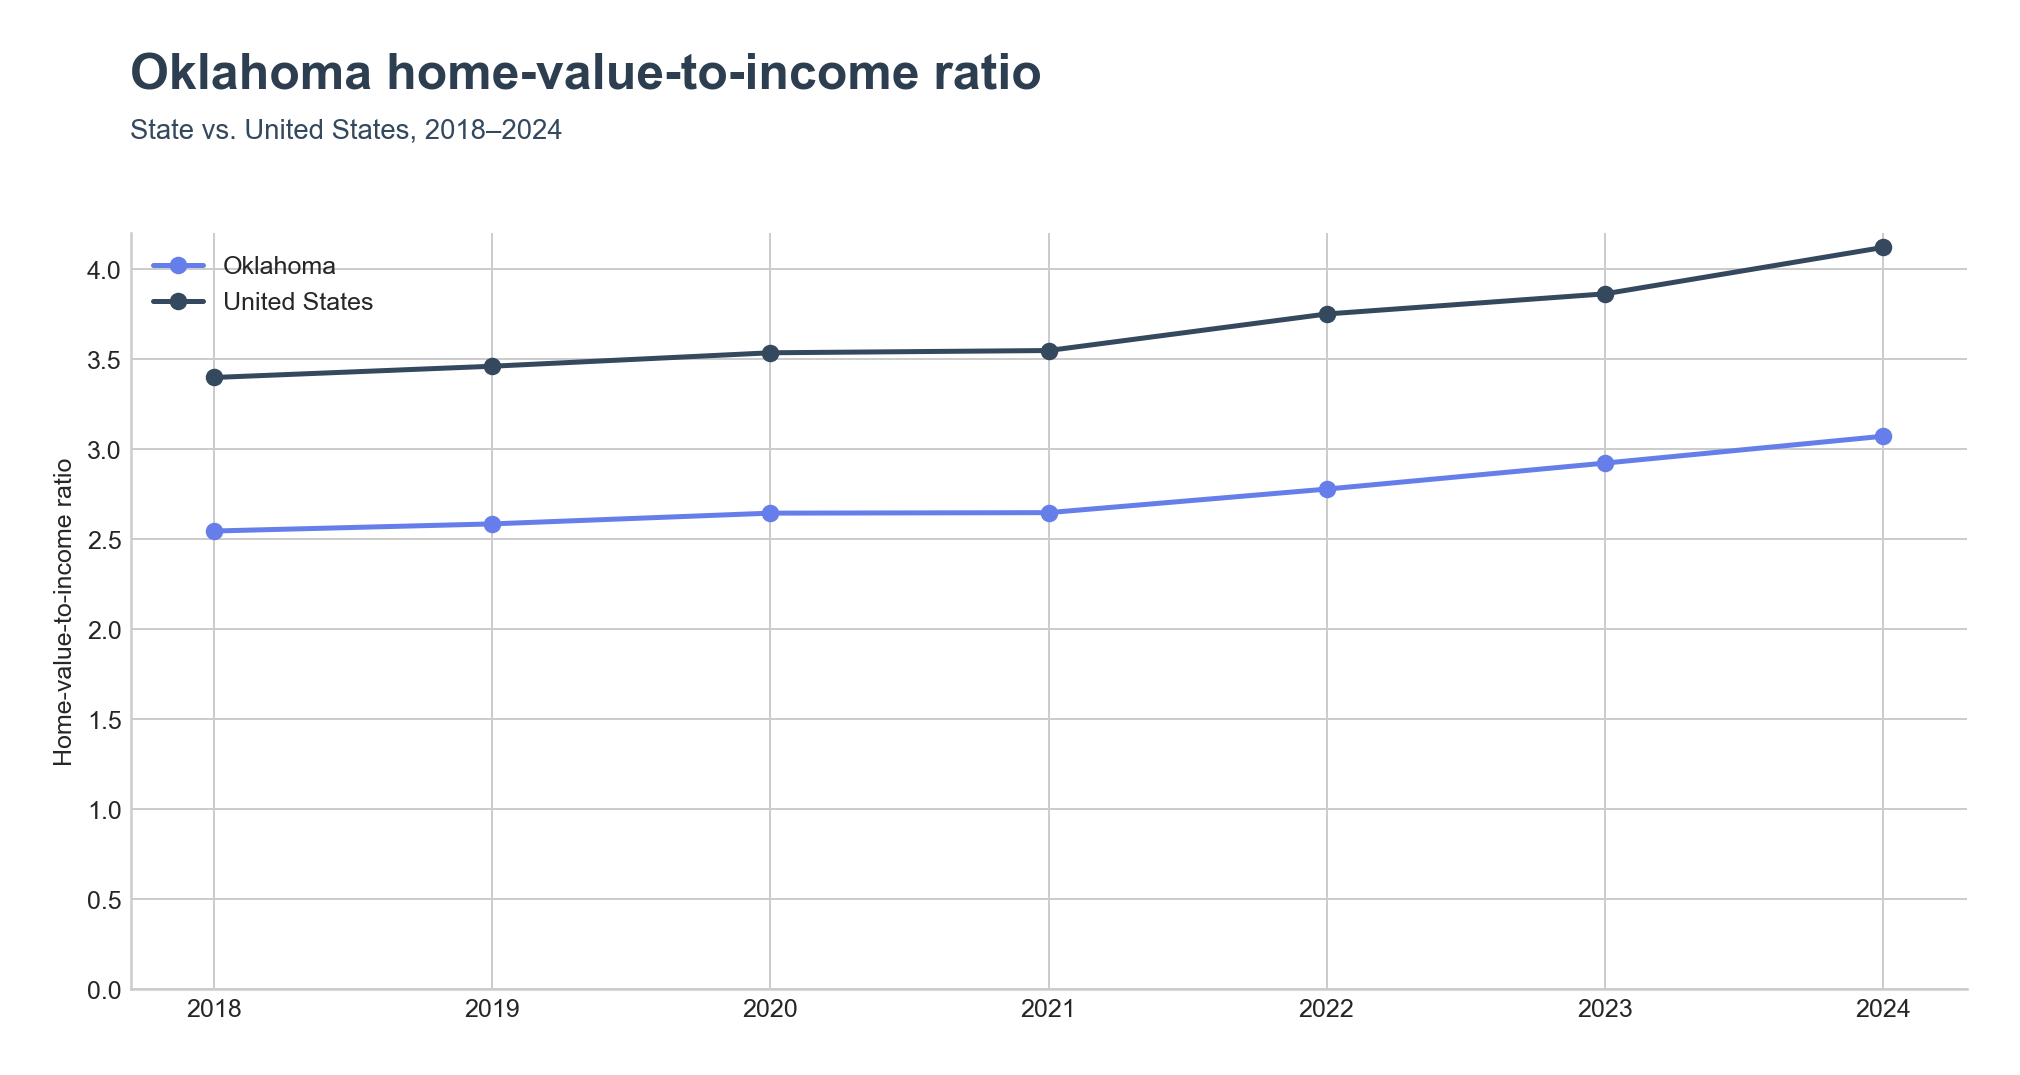
Oklahoma's home-value-to-income ratio reached 3.07x in 2024, well below the United States figure of 4.12x. The two have moved apart rather than together: Oklahoma stood at 2.55x against a national 3.40x in 2018, and the national ratio has climbed faster since, so the state's relative affordability advantage is larger now even as its own ratio has risen every year.
Where the ratio runs highest
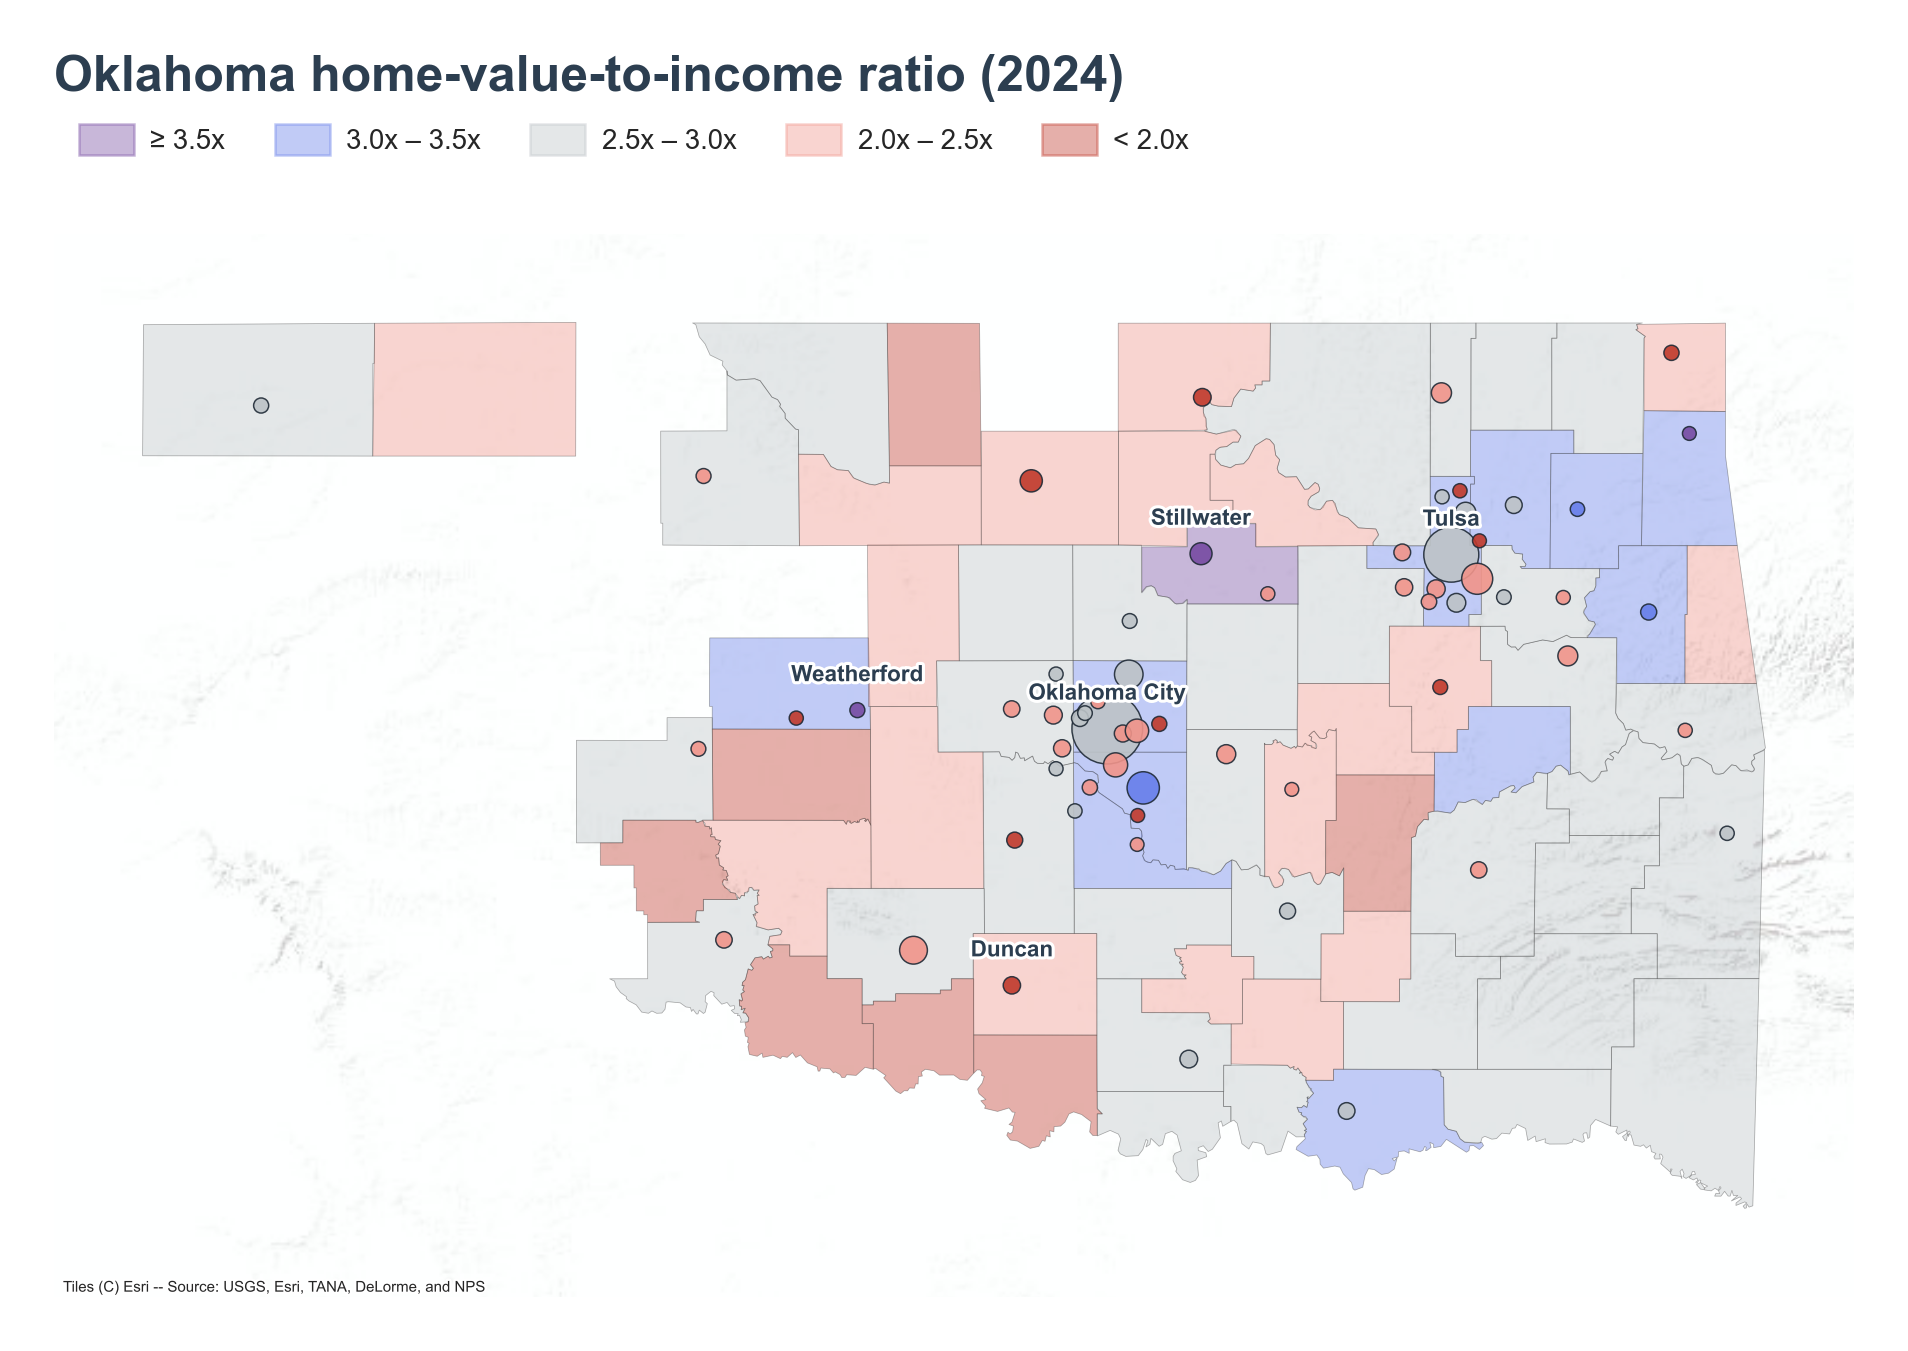
Stillwater tops the state at 5.43x, the only Oklahoma place in the highlights list at or above 4x. Stillwater is home to Oklahoma State University , whose large student population depresses measured household income relative to home values. Payne County, where Stillwater sits, leads all Oklahoma counties at 4.48x, consistent with the same university-town dynamic extending across the county.
Weatherford follows at 4.25x. It hosts Southwestern Oklahoma State University, a public university whose presence dates to 1901 as the Southwestern Normal School, according to Southwestern Oklahoma State University — another college-town setting where the ratio runs high.
Grove and Tahlequah round out the top places, at 4.14x and 3.74x respectively, with Pryor Creek close behind at 3.71x.
Among counties, Oklahoma County (3.34x) and Tulsa County (3.34x) — home to the state's two largest cities — sit well below Payne County, in line with the broader pattern of the ratio running highest around Stillwater and Weatherford rather than the state's metro cores.
Where the ratio runs lowest
Clinton has the lowest ratio among highlighted places, at 2.05x, followed by Duncan at 2.27x. Duncan is the birthplace of Halliburton , which was founded there before relocating its headquarters — an oilfield-services town where local incomes have kept pace with home values. Miami (2.32x), Noble (2.33x), and Okmulgee (2.35x) cluster just above Duncan.
At the county level, Alfalfa County is lowest at 1.57x, with Tillman County (1.63x), Jefferson County (1.70x), Greer County (1.84x), and Washita County (1.86x) all under 2x — all of them lie in the western half of the state, away from the Oklahoma City and Tulsa metros.
Home values are outrunning incomes
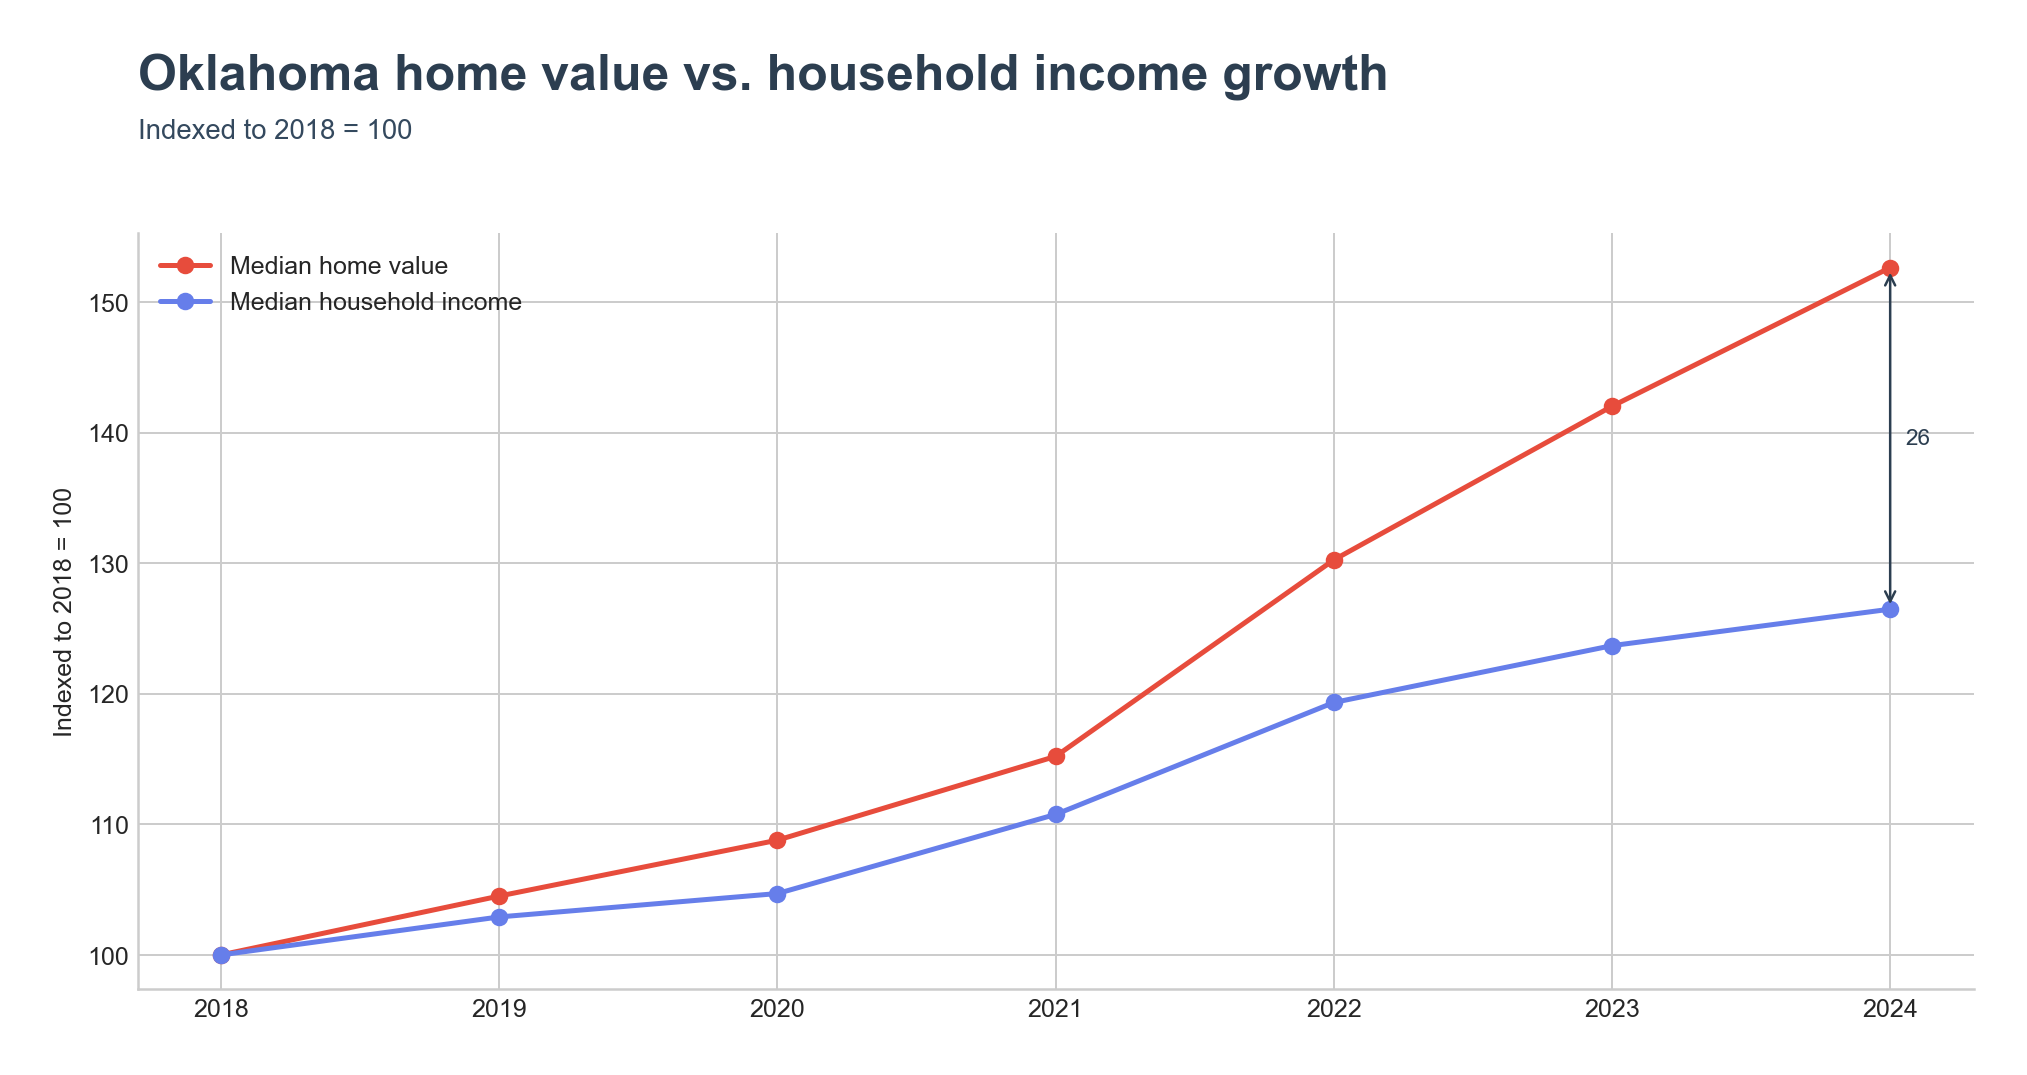
Indexed to 2018, Oklahoma's median home value and median household income tracked closely through 2020 before diverging: home value growth pulled ahead of income growth in the years that followed.
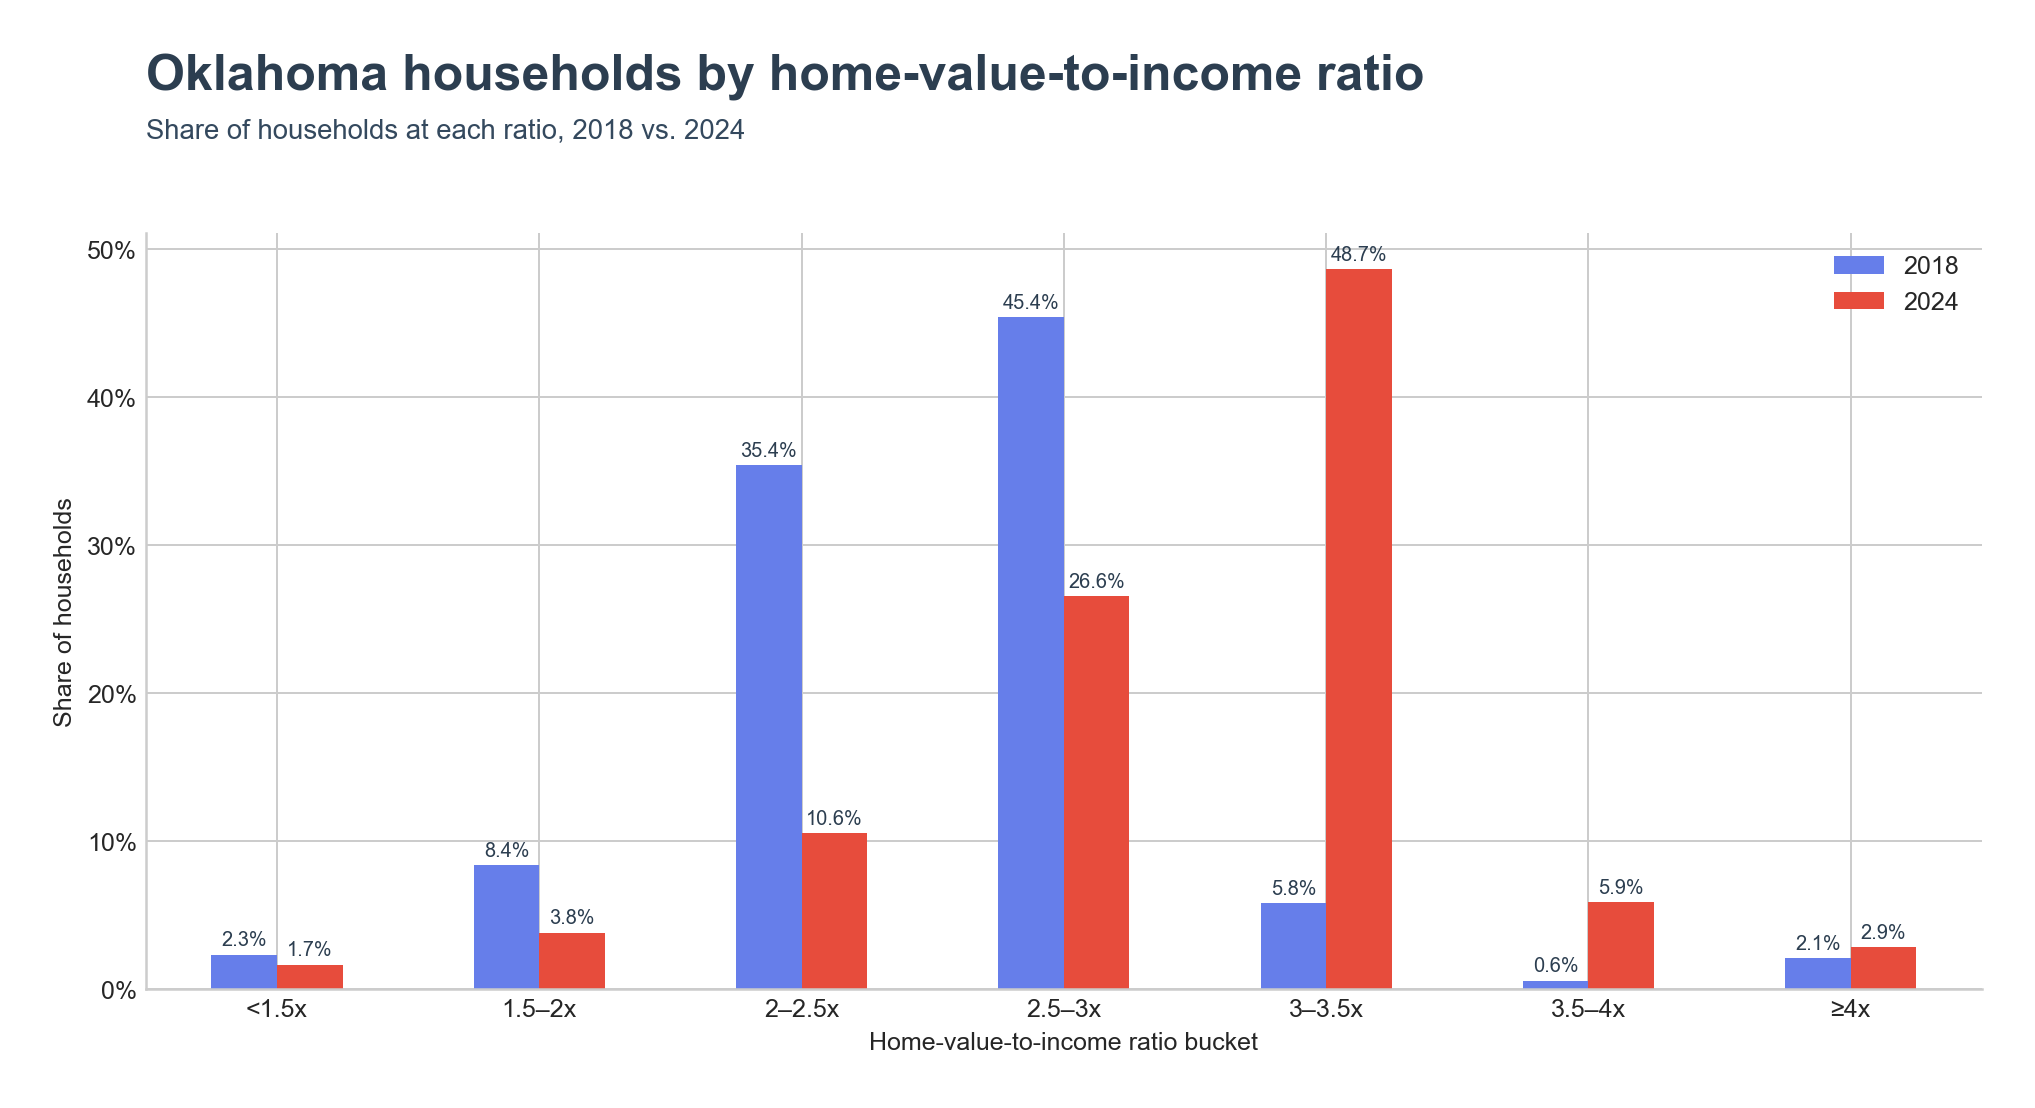
The household distribution shows the same shift. The share of households in the 3–3.5x band rose from 5.8% in 2018 to 48.7% in 2024, while the 2–2.5x band fell from 35.4% to 10.6% and the 2.5–3x band fell from 45.4% to 26.6%. The ≥4x band, essentially a rounding error in 2018 at 2.1%, grew to 2.9% by 2024.
Key Takeaways
- Oklahoma's home-value-to-income ratio rose from 2.55x in 2018 to 3.07x in 2024, while the US ratio rose from 3.40x to 4.12x over the same period, so the state remains more affordable than the nation and the gap between them widened.
- Stillwater (5.43x) and Payne County (4.48x) post the state's highest ratios, both anchored by Oklahoma State University's enrollment.
- Weatherford (4.25x), home to Southwestern Oklahoma State University, is the second-highest place.
- Clinton (2.05x) and Alfalfa County (1.57x) are the lowest-ratio place and county among the highlights.
- The share of Oklahoma households in the 3–3.5x ratio band grew from 5.8% to 48.7% between 2018 and 2024.