Virginia's home-value-to-income ratio reached 4.12x in 2024, matching the United States figure of 4.12x.
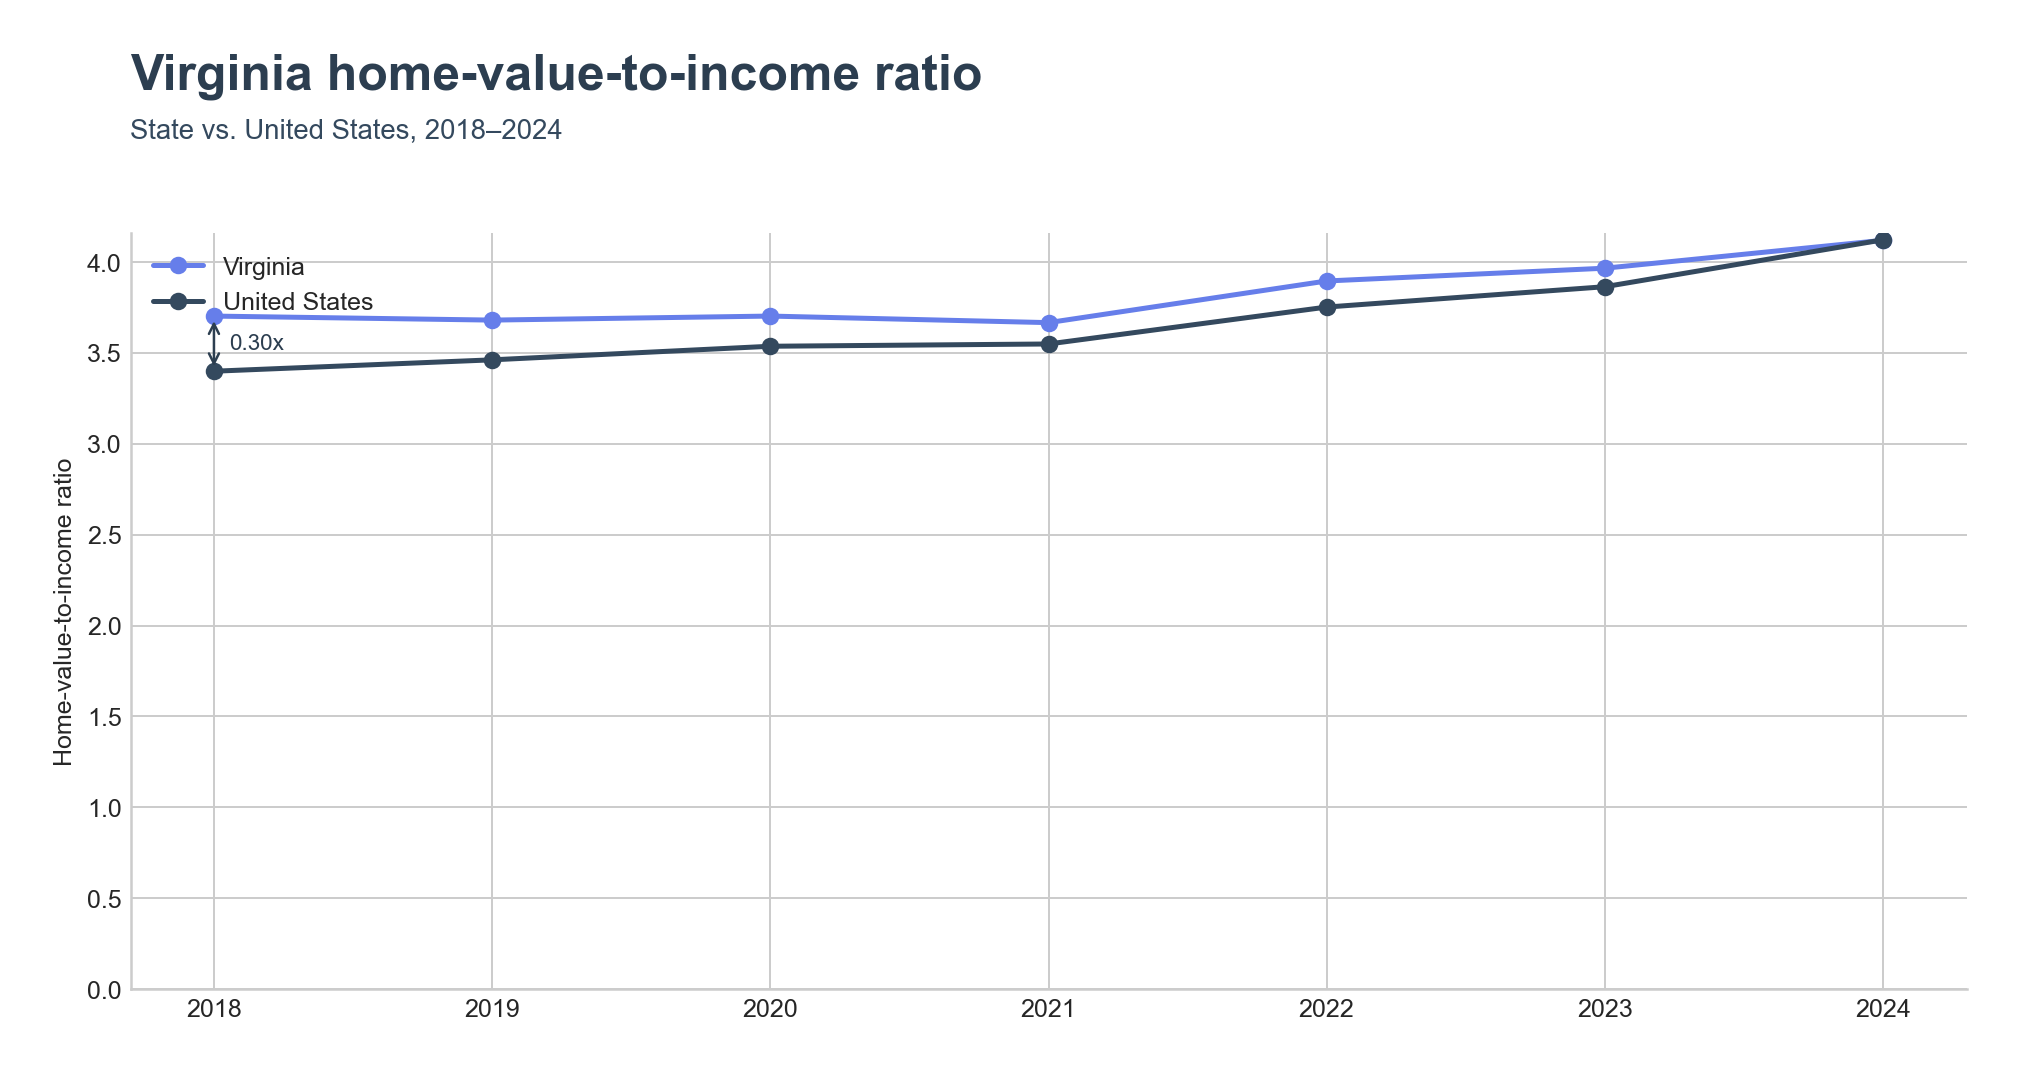
Virginia's ratio has tracked above the national line for most of the 2018–2024 window and only converged with it in the final year, when both reached 4.12x.
Highest ratios
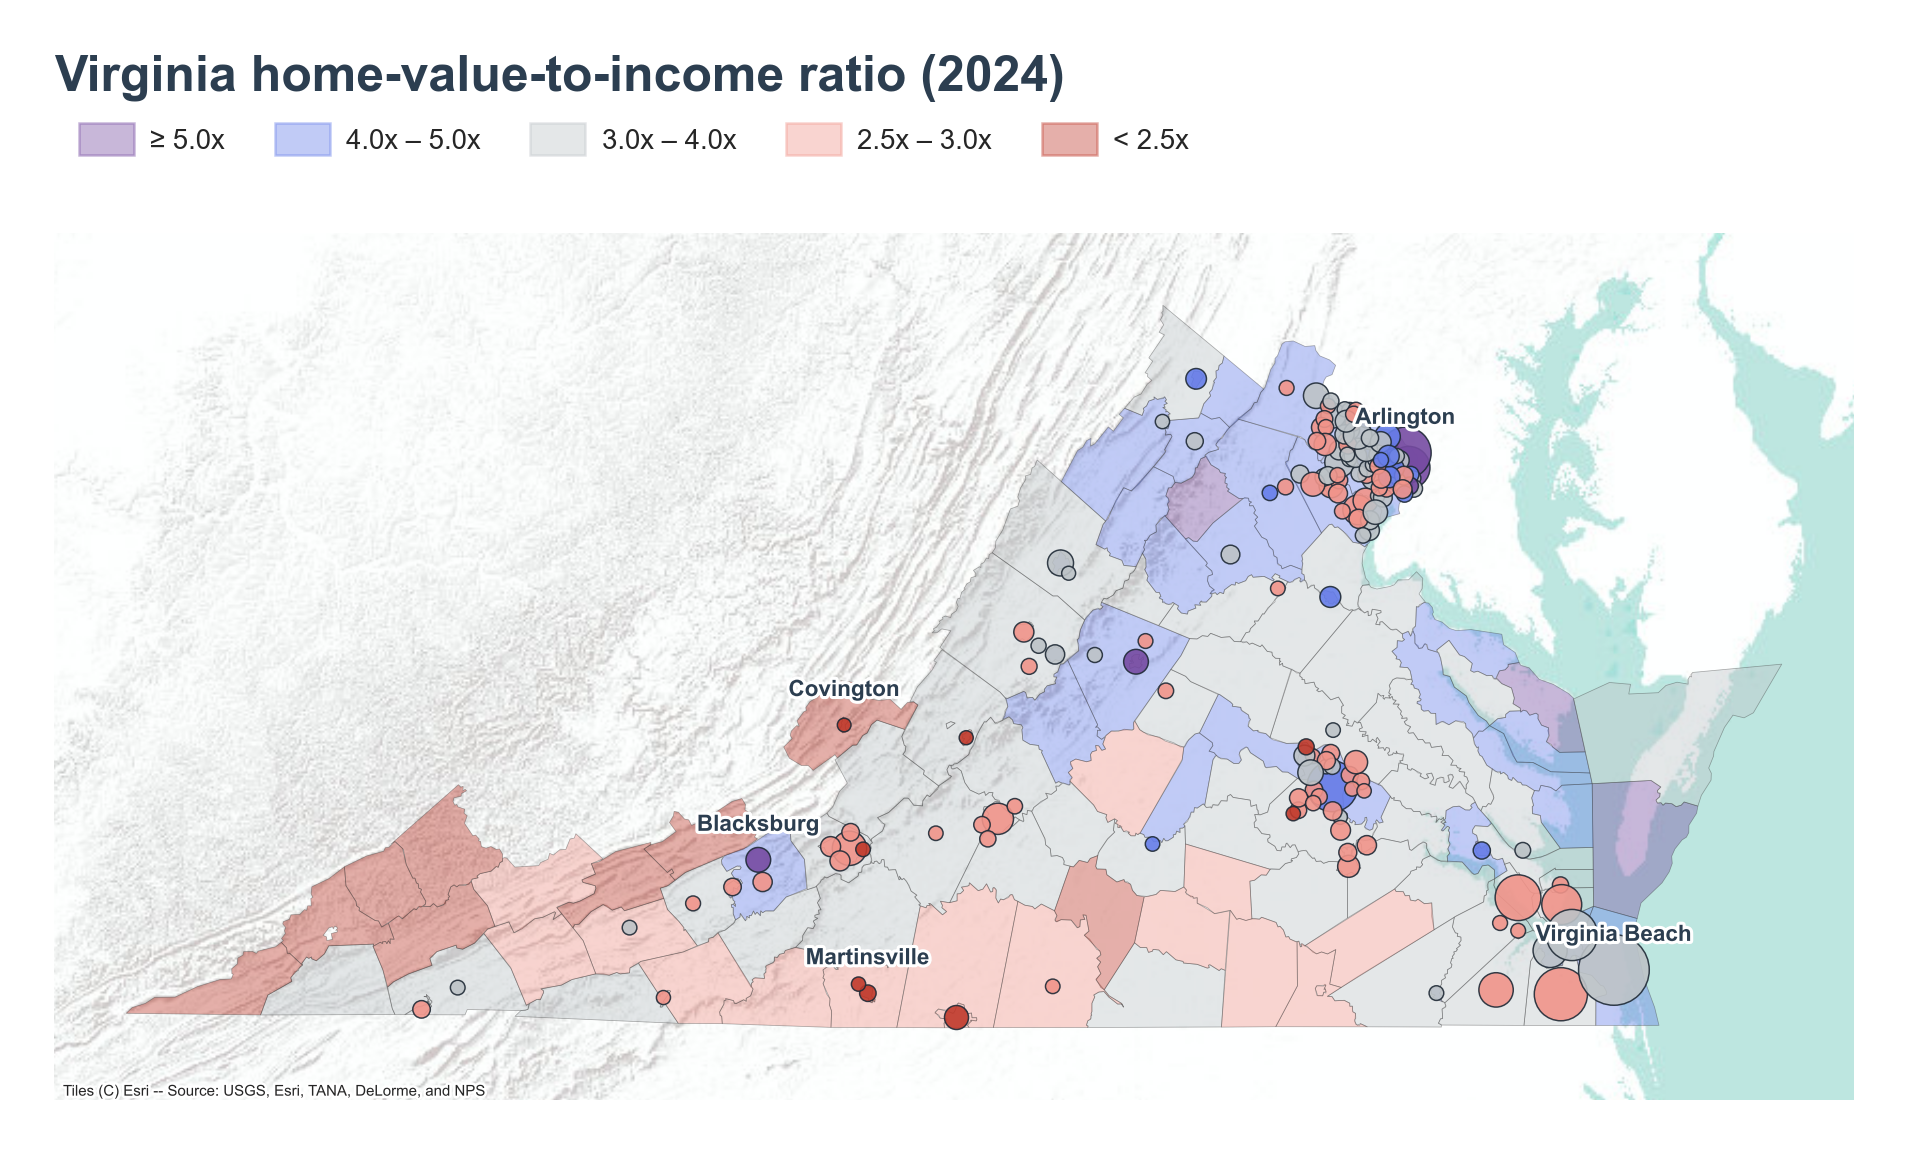
Blacksburg posts the state's highest home-value-to-income ratio at 8.89x, with a median home value of $446,300 against median household income of $50,182. Virginia Tech dominates Blacksburg economically and demographically, and is by far the town's largest employer — a driver of housing demand that outpaces local wages.
Falls Church, at both the place and county level, carries the second-highest ratio at 7.37x, on a median home value of $1,055,600 and median household income of $143,262 — the highest income among the state's highlighted places. Falls Church sits inside the Washington metropolitan area, where proximity to the national capital region drives home values well above income growth.
Charlottesville follows at 6.50x (home value $486,700, income $74,824). The University of Virginia , founded by Thomas Jefferson, anchors the city's economy much as Virginia Tech anchors Blacksburg's.
The remaining top places and counties — Idylwood (6.30x), Lake Barcroft (6.30x), Arlington County (6.30x), and Alexandria (6.14x) — cluster in the same northern Virginia corner of the map, around Arlington and Falls Church, alongside Rappahannock County (6.07x), just west of that cluster.
Lowest ratios
Covington, an independent city in western Virginia, anchors the state's low end at 1.99x, with a median home value of $83,500 against income of $41,944; surrounding Alleghany County sits at 2.24x. The WestRock paper mill has long been Covington's largest employer, and the map shows Covington and the surrounding county shaded deep red — the lowest-ratio band in the state.
Martinsville, also an independent city, is close behind at 2.11x (home value $98,400, income $46,727). Martinsville's economy ran on textile and furniture manufacturing for a century before those industries became economically unsustainable in the early 1990s, and the city has been rebuilding around technology and manufacturing since. On the map, Martinsville sits in the same dark-red band as Covington, in the southern part of the state.
Danville (2.68x), Buena Vista (2.70x), and Collinsville (2.81x) round out the bottom places, alongside Dickenson County (2.17x) and Buchanan County (2.21x) — the counties trace a band across the state's western and southern edges on the map, in contrast with the purple-and-blue cluster around Arlington and Falls Church in the northeast.
Distribution shift
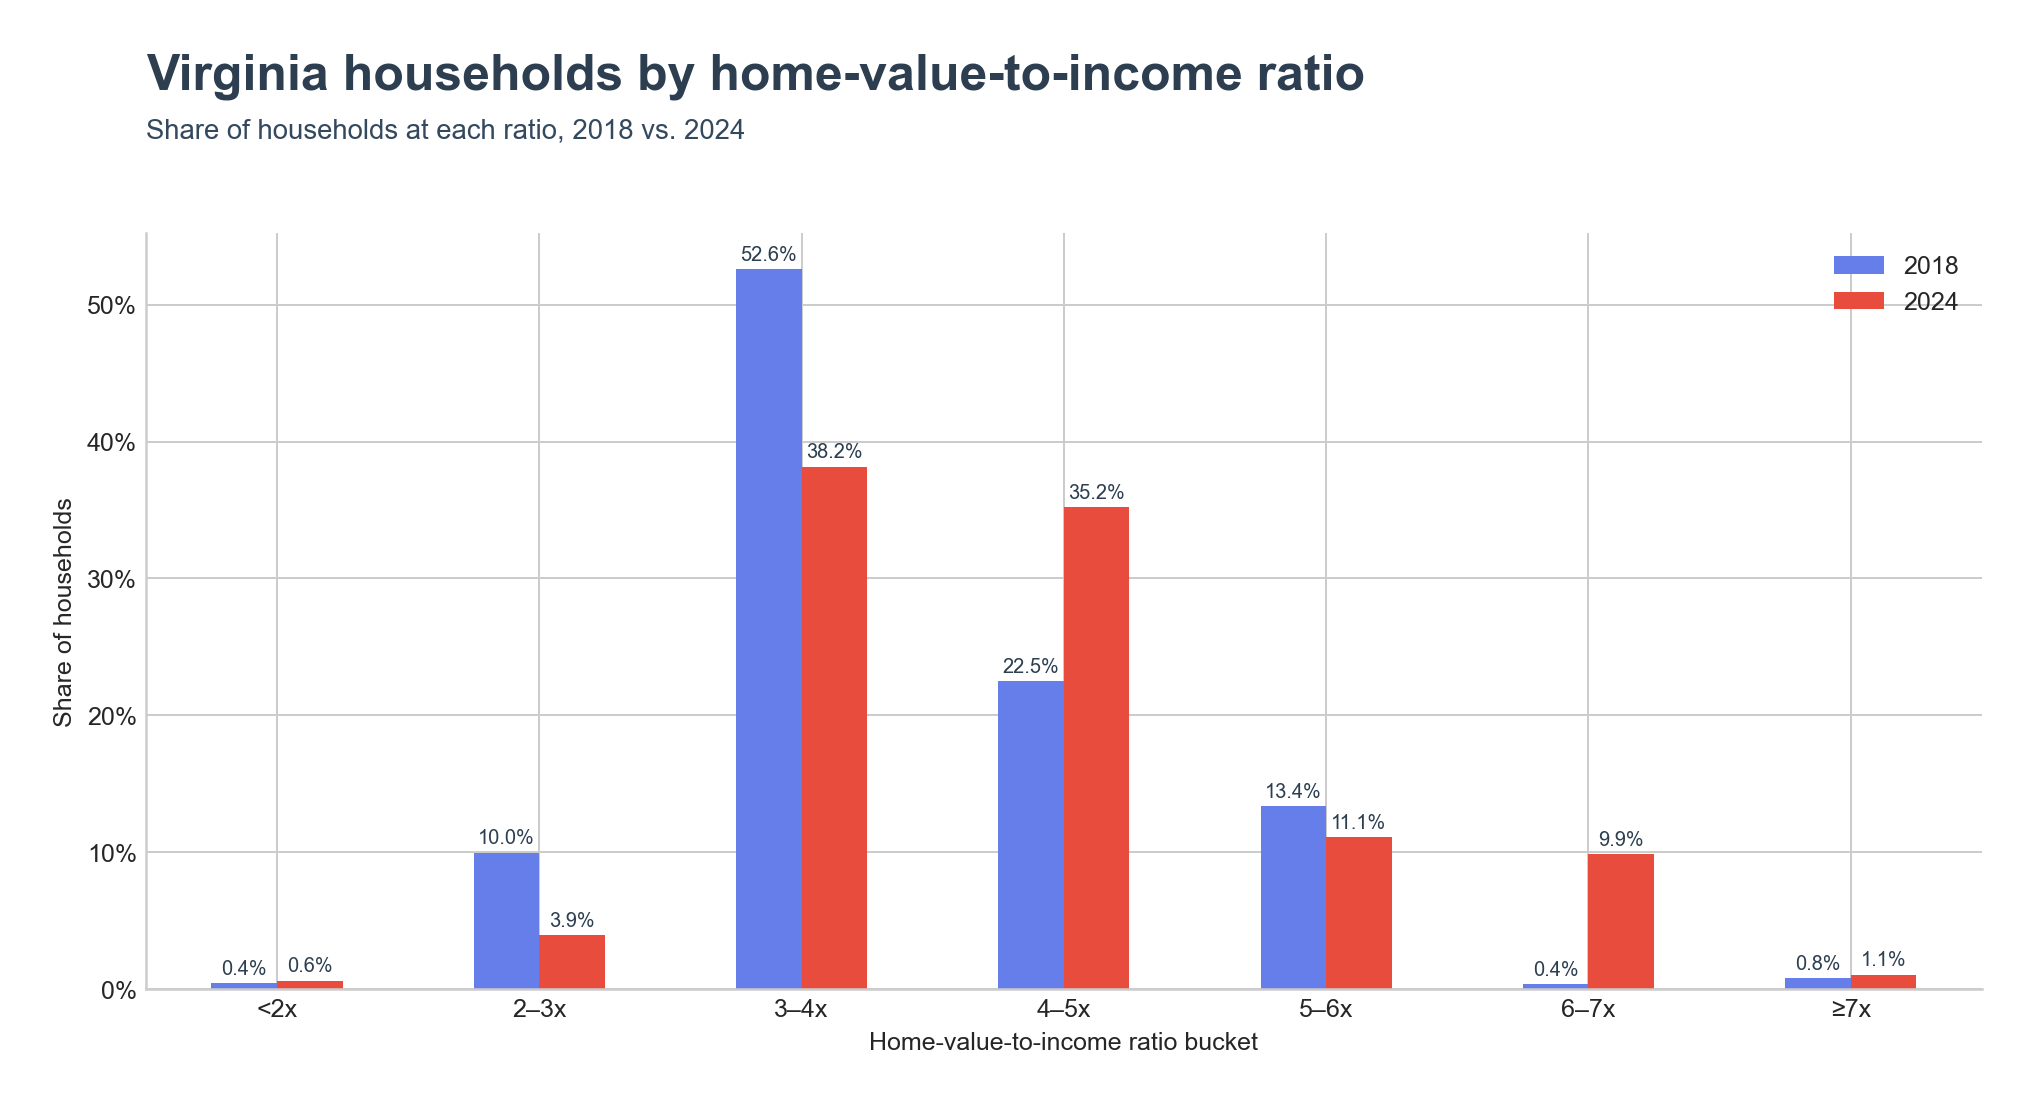
In 2018, 52.6% of Virginia households lived in places with a ratio between 3x and 4x, the single largest band. By 2024 that band's share fell to 38.2%, while the 4–5x band grew from 22.5% to 35.2%. The 6–7x band, negligible at 0.4% in 2018, grew to 9.9% by 2024 — a sign that a meaningful share of households now live in places well above the 2018 norm.
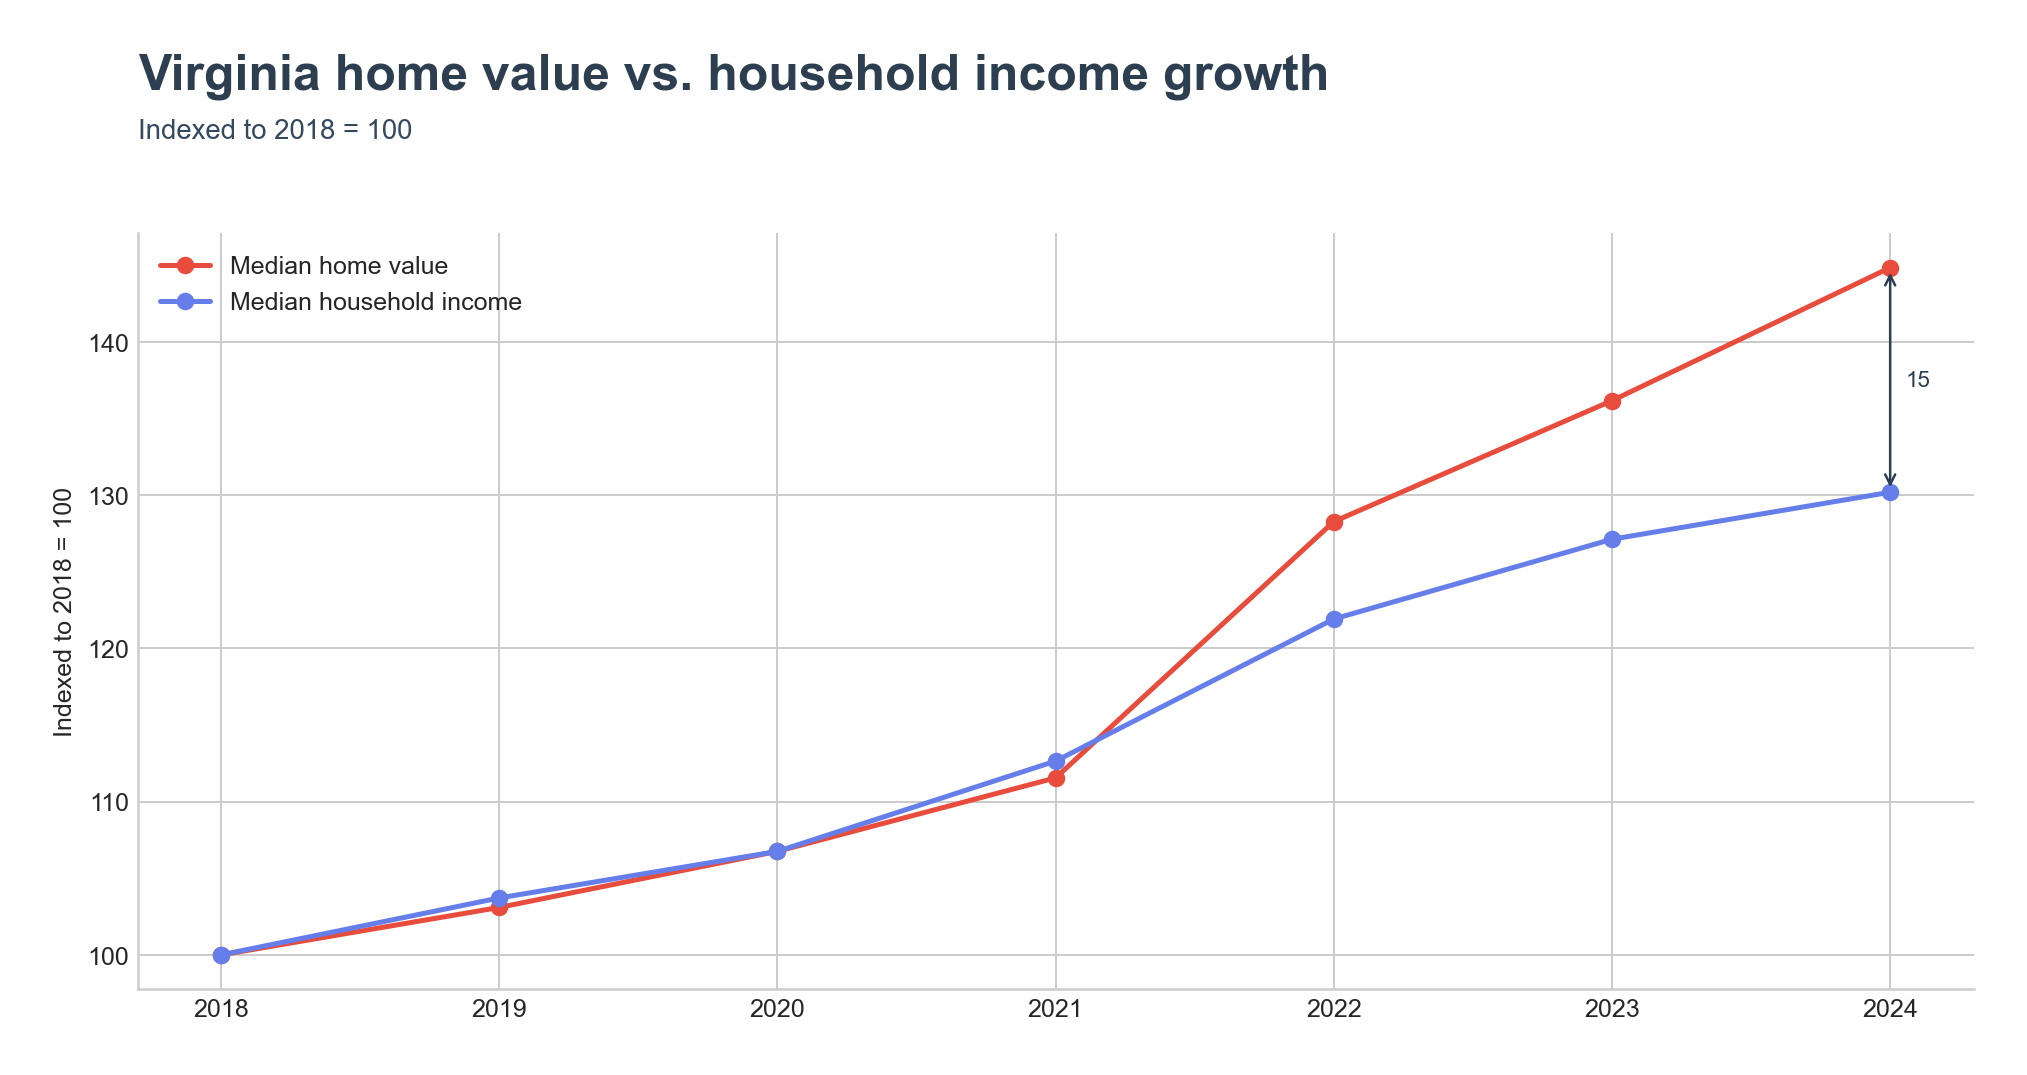
Indexed to 2018, Virginia's median home value reached 145 by 2024 while median household income reached 130 — a gap of 15 index points, most of which opened after 2021.
Key Takeaways
- Virginia's home-value-to-income ratio hit 4.12x in 2024, level with the United States figure of 4.12x.
- Blacksburg has the state's highest ratio, 8.89x, on a median home value of $446,300 and income of $50,182.
- Falls Church follows at 7.37x, with the highest median household income among highlighted places at $143,262.
- Covington has the state's lowest ratio at 1.99x; surrounding Alleghany County sits at 2.24x.
- The share of households in the 3–4x band fell from 52.6% in 2018 to 38.2% in 2024, while the 4–5x band grew from 22.5% to 35.2%.
- Indexed home value growth (145) outpaced indexed income growth (130) by 15 points between 2018 and 2024.