Indiana still buys more house per dollar of income than the country as a whole
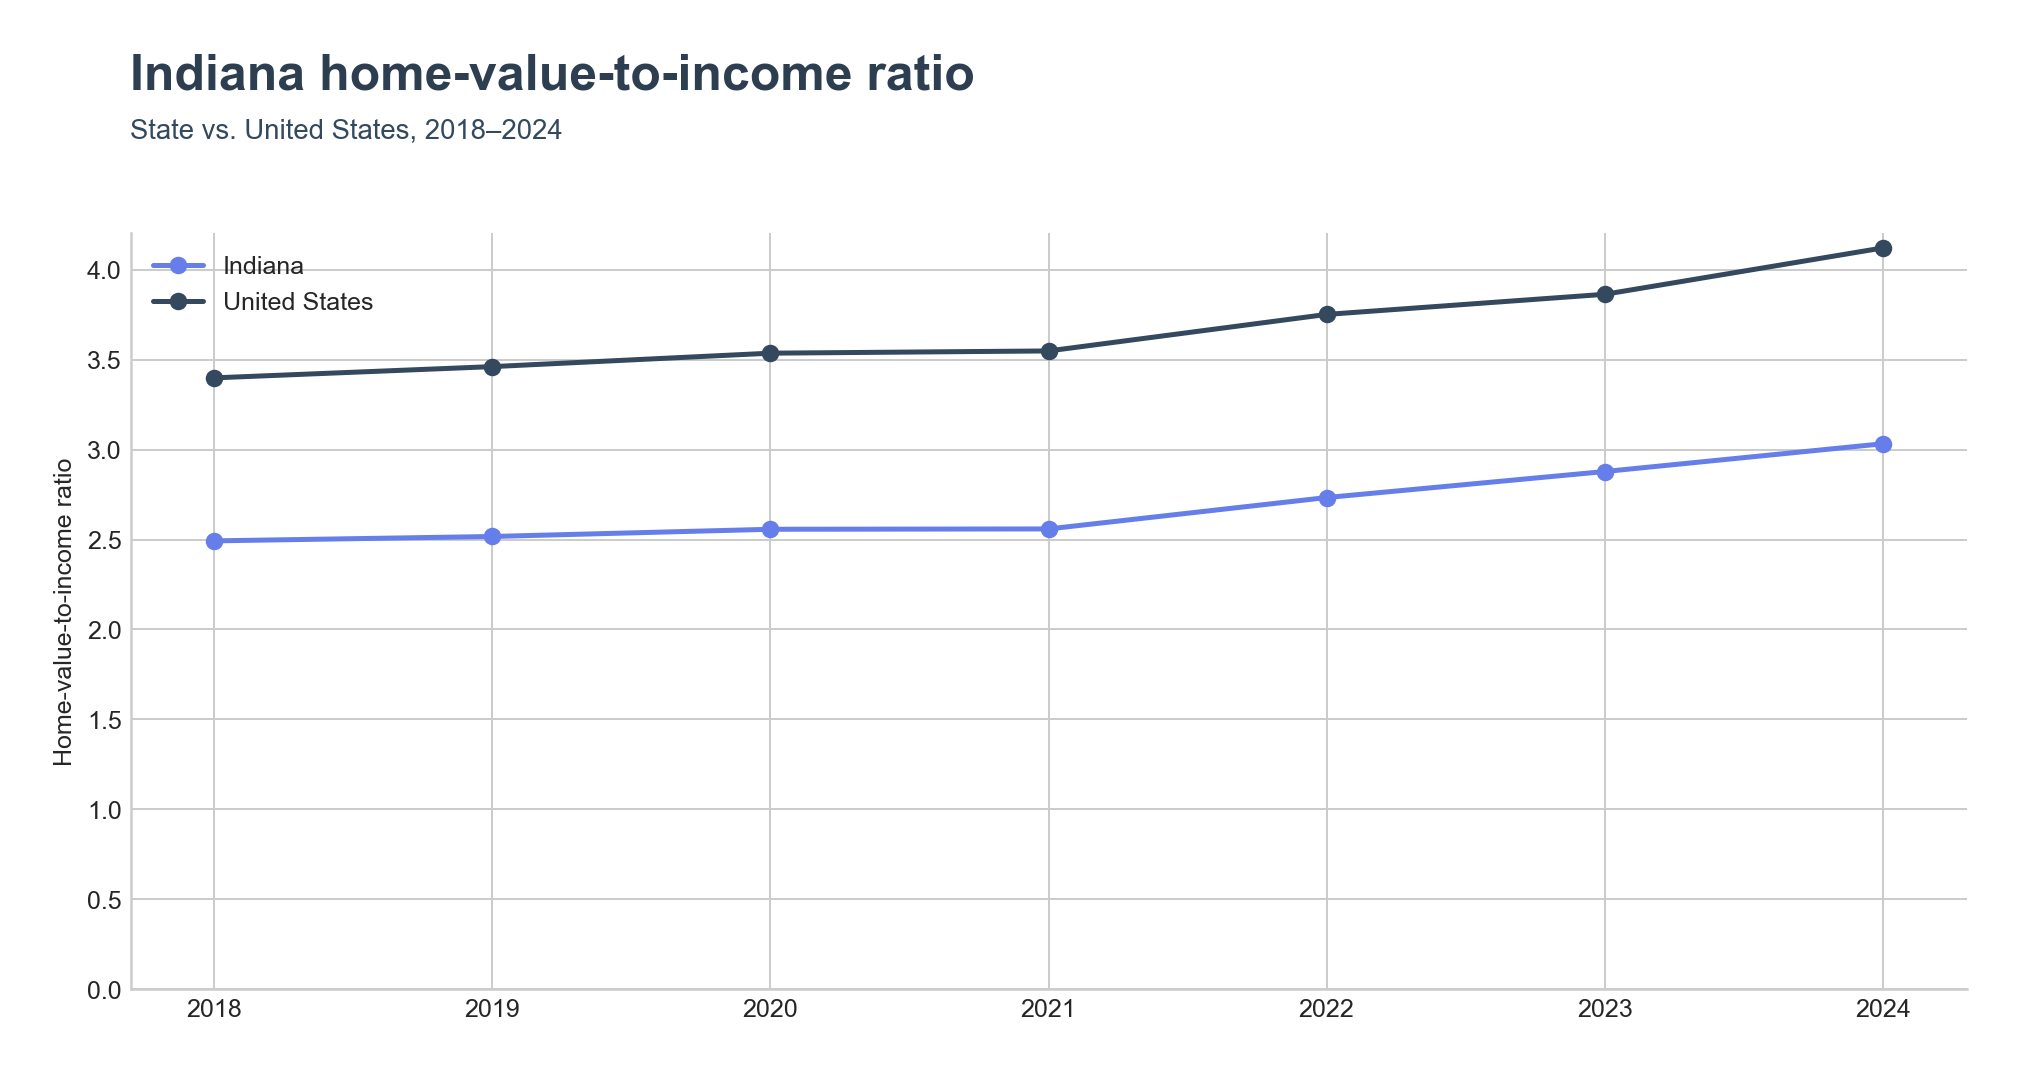
Indiana's home-value-to-income ratio reached 3.03x in 2024, well below the United States ratio of 4.12x. The gap has been consistent since 2018, when Indiana's ratio stood at 2.49x against a national 3.40x. Indiana homes remain cheaper relative to local incomes than the national norm, even as the state's ratio has climbed faster in percentage terms over the past two years.
University towns lead the state
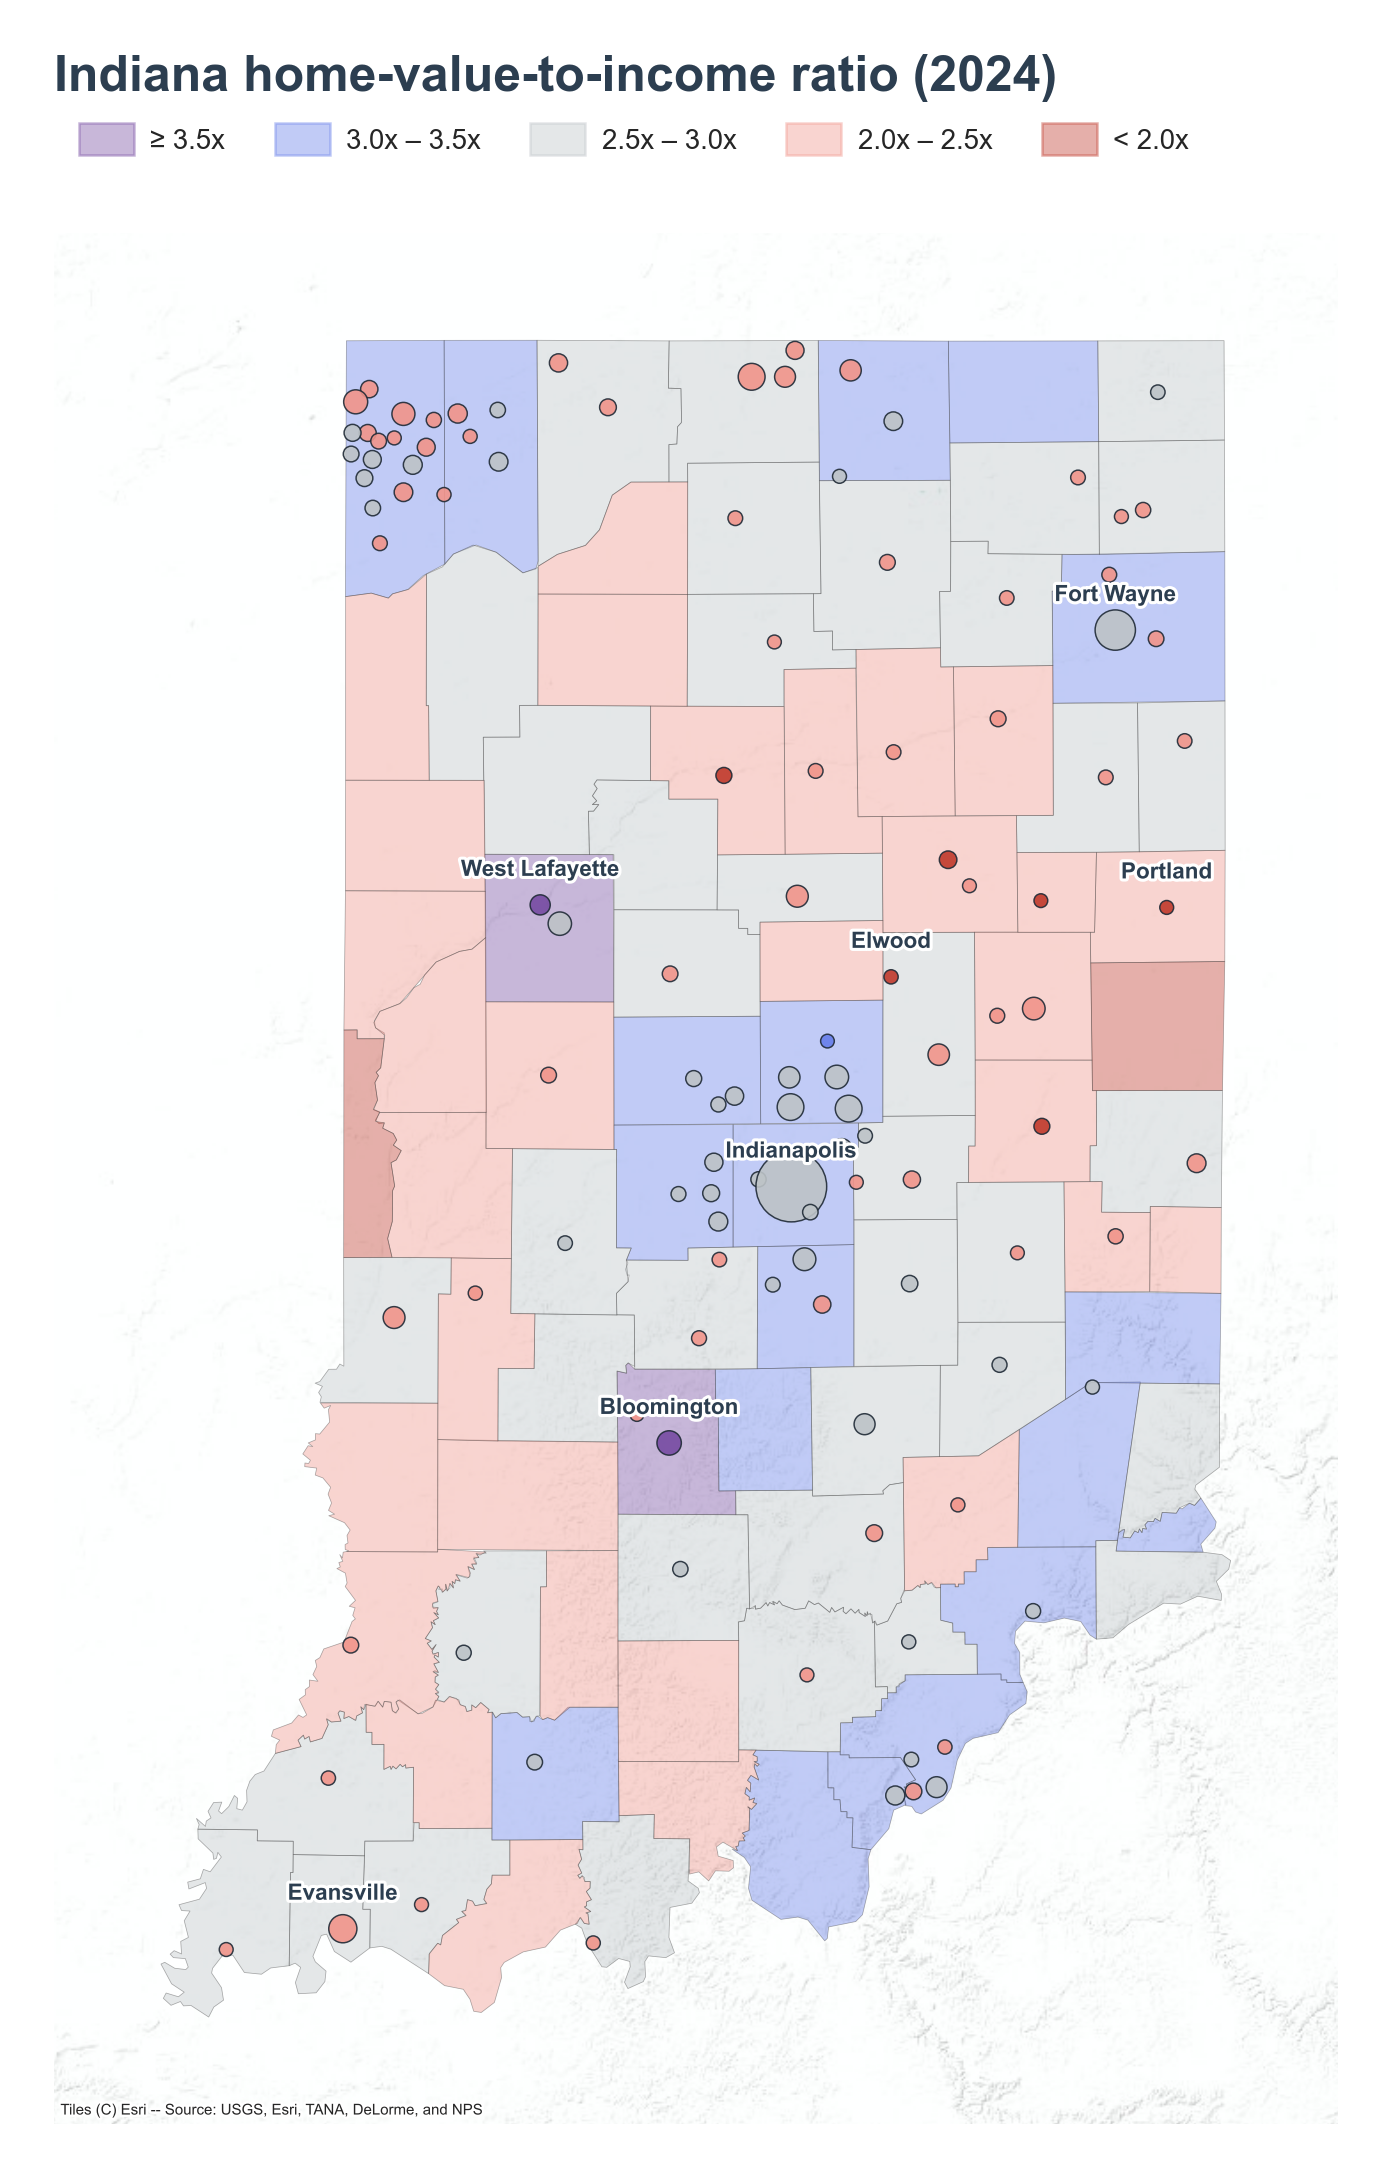
West Lafayette posts the highest ratio in Indiana at 10.03x, with a median home value of $350,000 against median household income of $34,891. The city sits on the Wabash River across from Lafayette and is home to Purdue University , whose large student population skews the city's income figures toward a large share of low-earning students and graduate researchers, while home values track a broader Tippecanoe County market. The map places West Lafayette in the ≥3.5x bracket in west-central Indiana, alongside Tippecanoe County itself, which ranks among the state's top counties at 3.95x.
Bloomington follows at 6.37x (home value $321,400, income $50,465), also shaded in the top bracket on the map, in south-central Indiana. Bloomington is the seat of Indiana University Bloomington , the flagship of the Indiana University system. Monroe County, which contains Bloomington, is the state's top-ranked county at 4.33x, and neighboring Brown County ranks third among counties at 3.43x.
Former Gas Belt towns sit at the bottom
The lowest ratios cluster in northeast and east-central Indiana, a region shaded red and pink on the map — territory that boomed during the state's 19th-century natural gas discoveries and built a manufacturing base that has since thinned out. Elwood , once known as the "Glass Capital of Indiana" after a natural gas discovery drew glass and tinplate manufacturers to the city, posts the lowest ratio among places at 1.84x (home value $97,800, income $53,280).
Portland , the Jay County seat, follows at 1.88x (home value $96,700, income $51,513); Jay County itself ranks among the lowest counties at 2.14x. New Castle , the Henry County seat that once manufactured sheet iron, steel, and automobiles, sits at 1.90x (home value $98,000, income $51,606). Logansport , the Cass County seat whose economy remains rooted in manufacturing and food processing, comes in at 1.95x (home value $92,200, income $47,291). Marion , the Grant County seat that was once called the "Queen City of the Gas Belt" before its natural gas reserves depleted, rounds out the bottom places at 1.97x (home value $85,300, income $43,343). At the county level, Randolph, Vermillion, Miami, Blackford, and Jay counties post the state's lowest ratios, ranging from 1.87x to 2.14x — all rural counties without a major metro anchor.
Indianapolis and its counties hold the middle-to-upper range
Marion County, home to Indianapolis, ranks among the state's top five counties at 3.38x (home value $224,000, income $66,346), on par with Boone County at the same 3.38x ratio (home value $376,200, income $111,250). Both counties appear in the 3.0x–3.5x band on the map, immediately surrounding the Indianapolis marker. Two Indianapolis-area places also rank among the state's top: Cicero at 4.21x (home value $282,100, income $66,934) and Bargersville at 3.84x (home value $438,900, income $114,231).
Home values are outrunning incomes statewide
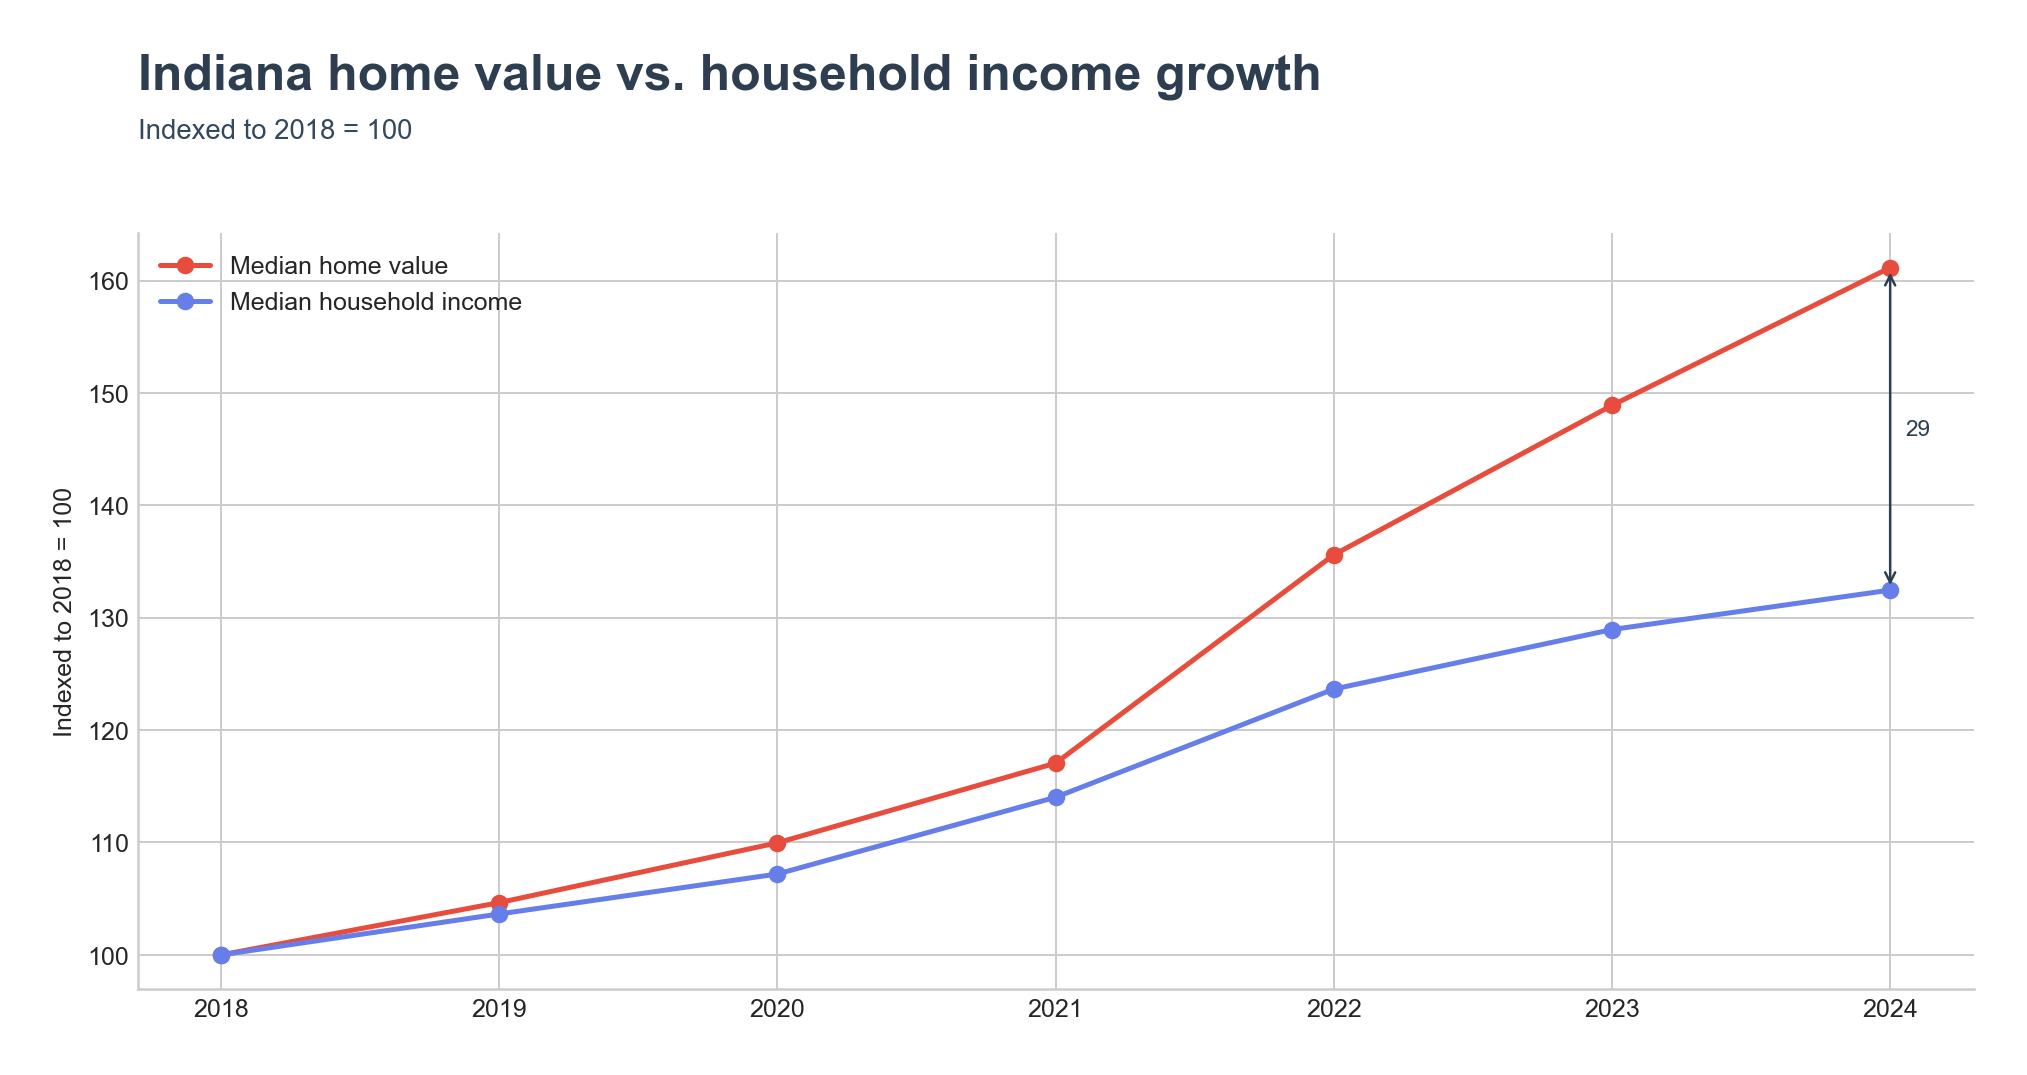
Indiana's median home value rose from $135,400 in 2018 to $218,200 in 2024, while median household income rose from $54,325 to $71,957 over the same span. Home value has grown faster than income each year since 2018, and the gap between the two, shown indexed to a common 2018 base below, widened sharply starting in 2021 — the same year Indiana's ratio began accelerating away from its 2018–2021 plateau near 2.5x.
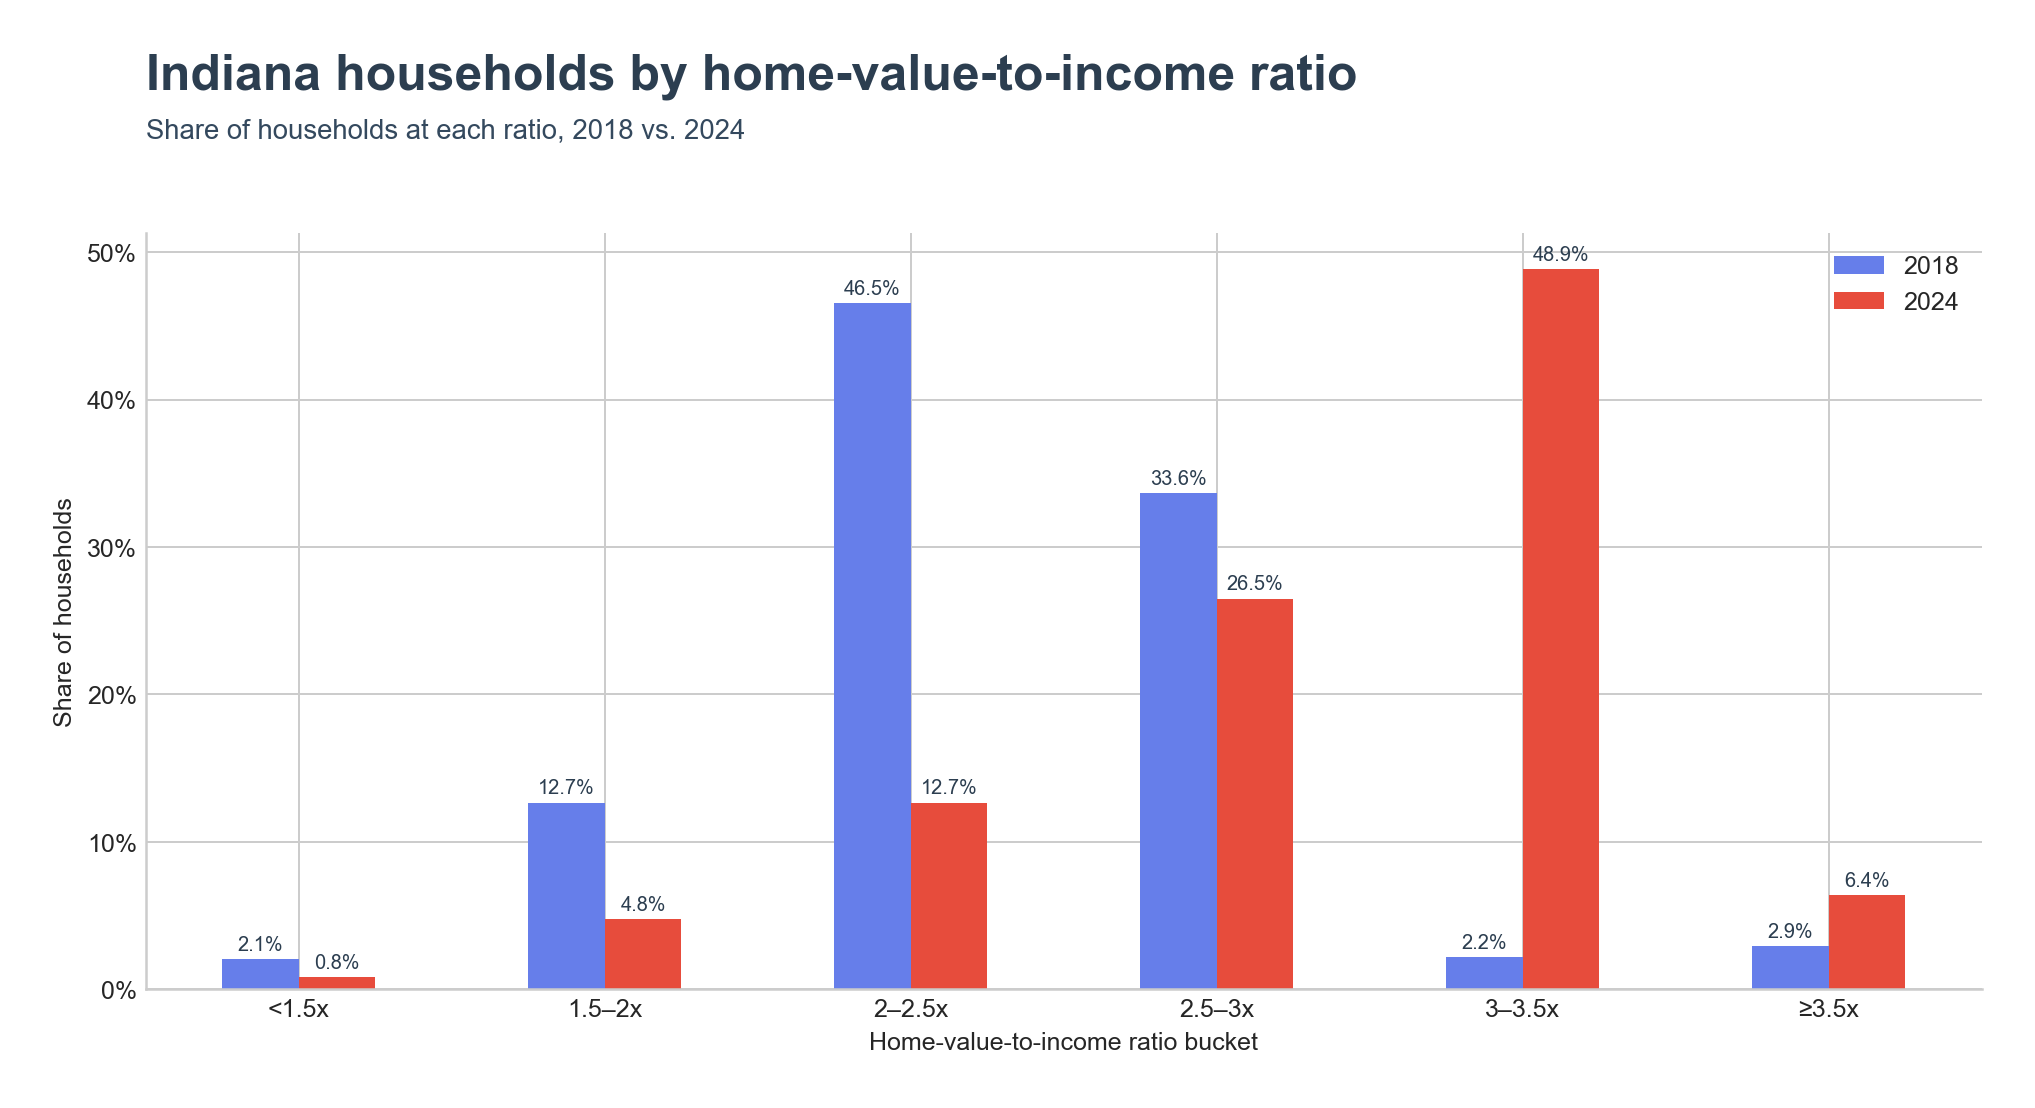
The share of Indiana households living in places with a ratio at or above 3.5x grew from 2.9% in 2018 to 6.4% in 2024, and the 3–3.5x band grew from 2.2% to 48.9% — now the single largest bracket in the state. Meanwhile, the share in the 2–2.5x band fell from 46.5% to 12.7%, and the 2.5–3x band fell from 33.6% to 26.5%. The distribution as a whole shifted decisively toward higher ratios.
Key Takeaways
- Indiana's home-value-to-income ratio was 3.03x in 2024, versus 4.12x for the United States.
- West Lafayette posted the state's highest ratio at 10.03x; Bloomington followed at 6.37x.
- Elwood had the state's lowest ratio at 1.84x, followed by Portland at 1.88x and New Castle at 1.90x.
- Monroe County ranked the state's top county at 4.33x; Randolph County ranked the lowest at 1.87x.
- Indiana's median home value rose from $135,400 to $218,200 between 2018 and 2024, while median household income rose from $54,325 to $71,957.
- The share of Indiana households in the ≥3.5x ratio bracket rose from 2.9% to 6.4% between 2018 and 2024.