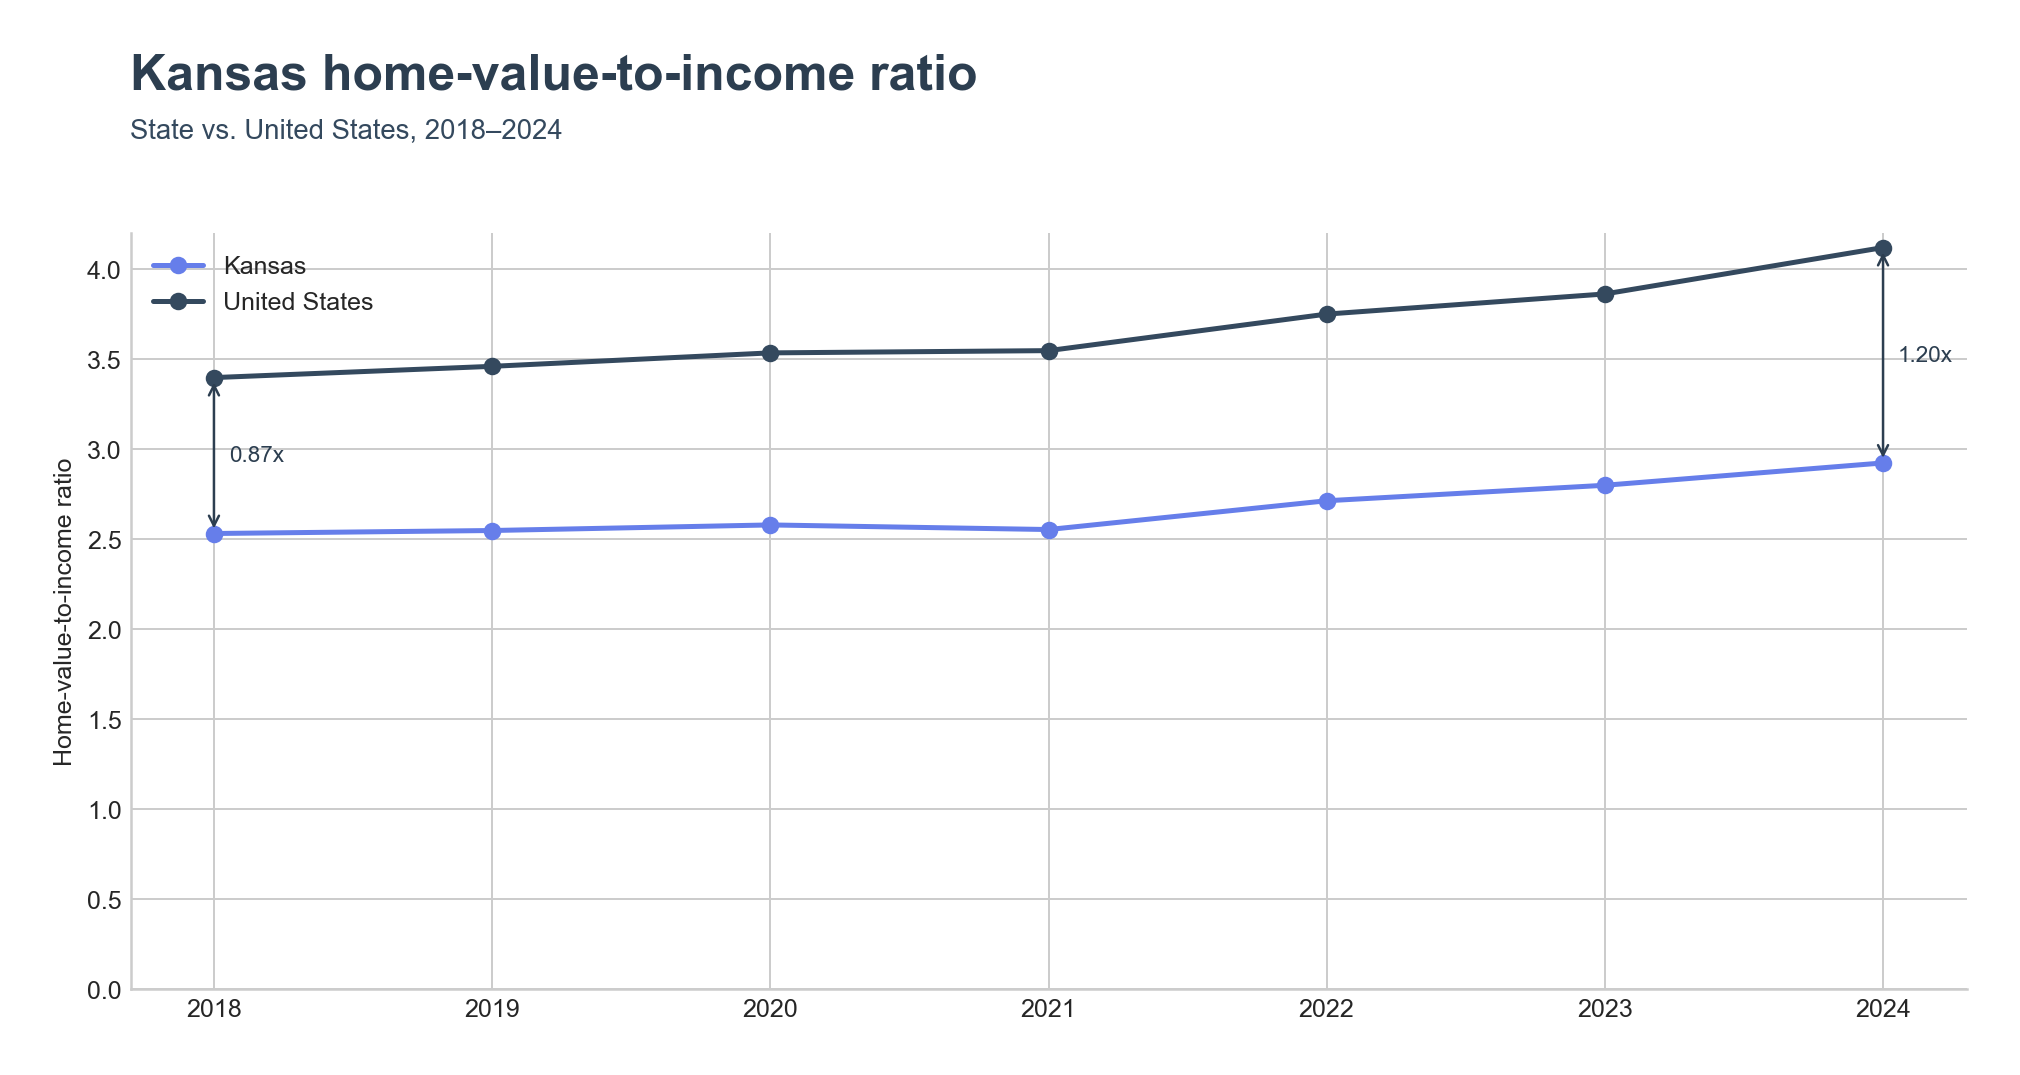
Kansas's home-value-to-income ratio reached 2.92x in 2024, well below the United States figure of 4.12x. The gap between the two has widened since 2018, when Kansas stood at 2.53x against a national 3.40x; the national ratio has climbed faster in every year since. The state's home-value-to-income ratio rose from 2.53x to 2.92x over the period, but the national ratio climbed faster, from 3.40x to 4.12x, pulling further ahead.
Where the ratio runs highest
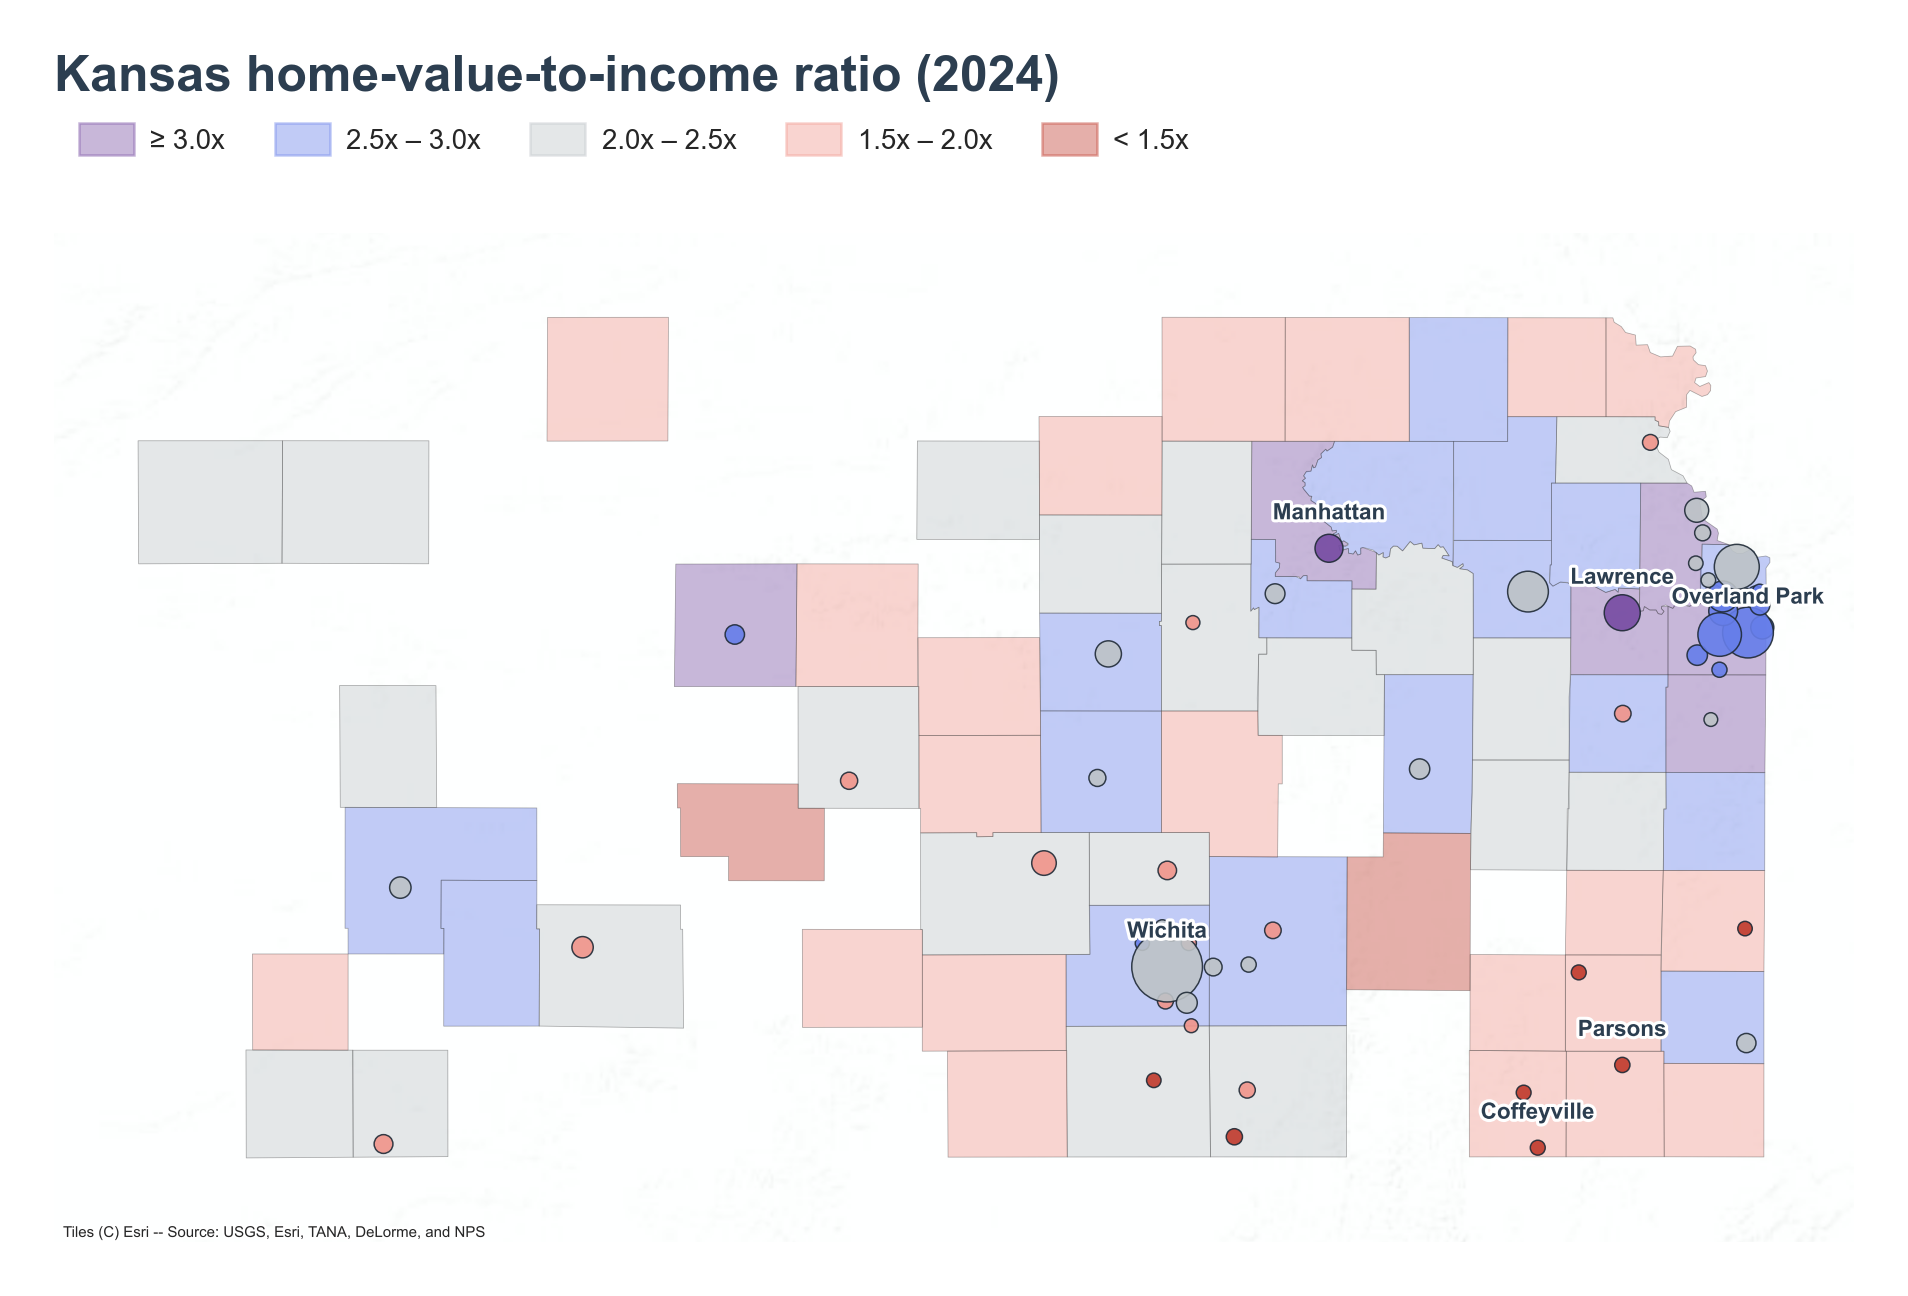
Lawrence tops the state at 4.50x, the highest of any place or county analyzed. The city is home to the University of Kansas , and Douglas County, which contains Lawrence, follows close behind at 4.44x.
Manhattan reaches 4.10x, the second-highest place figure. Kansas State University has its main campus in the city, and Riley County, which contains it, posts 3.88x.
Overland Park, in Johnson County in the northeastern corner of the state, comes in at 3.95x. It is the largest Kansas-side suburb of Kansas City, Missouri. Johnson County itself sits lower, at 3.58x. Hays (3.86x) and Prairie Village (3.84x) round out the top places, with Ellis County (3.43x) and Miami County (3.23x) rounding out the top counties.
Where the ratio runs lowest
Coffeyville, in southeast Kansas, posts the lowest figure in the state at 1.33x. Apart from a refinery , the industries that once anchored its economy are gone. Parsons, also in southeast Kansas, follows at 1.37x, and Chanute at 1.53x.
Independence (1.74x) and Arkansas City (1.75x) are the next-lowest places. Among counties, Pawnee (1.46x), Greenwood (1.48x), Wilson (1.54x), Harper (1.57x), and Rice (1.64x) form a cluster of low-ratio rural counties across southern and central Kansas.
The affordability shift since 2018
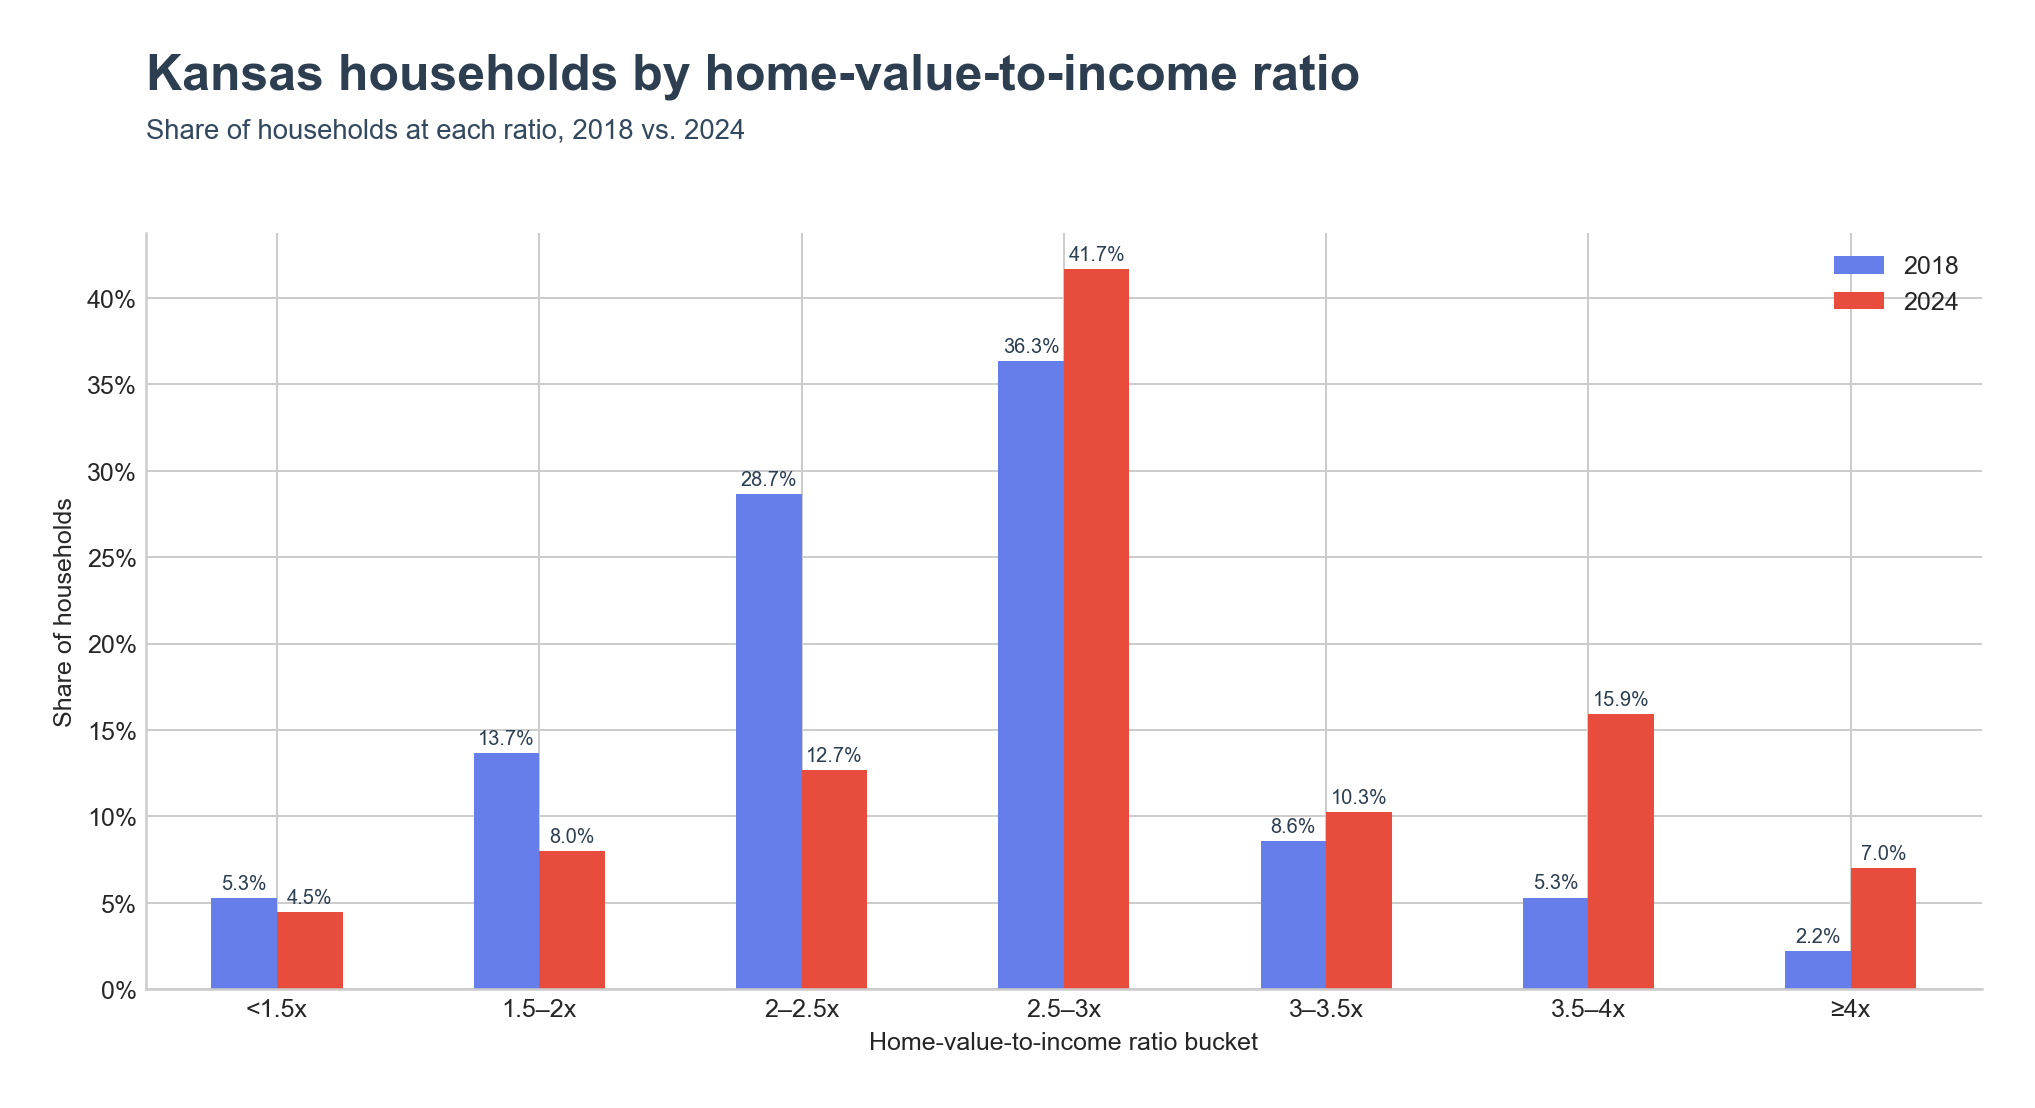
The share of Kansas households in the lowest ratio bands has shrunk: households below a 1.5x ratio fell from 5.3% to 4.5%, and the 1.5–2x band fell from 13.7% to 8.0%. The 2–2.5x band also fell, from 28.7% to 12.7%.
Meanwhile, the share of households at higher ratios grew. The 2.5–3x band, now the largest, grew from 36.3% to 41.7%. The 3.5–4x band grew from 5.3% to 15.9%, and the ≥4x band grew from 2.2% to 7.0%.
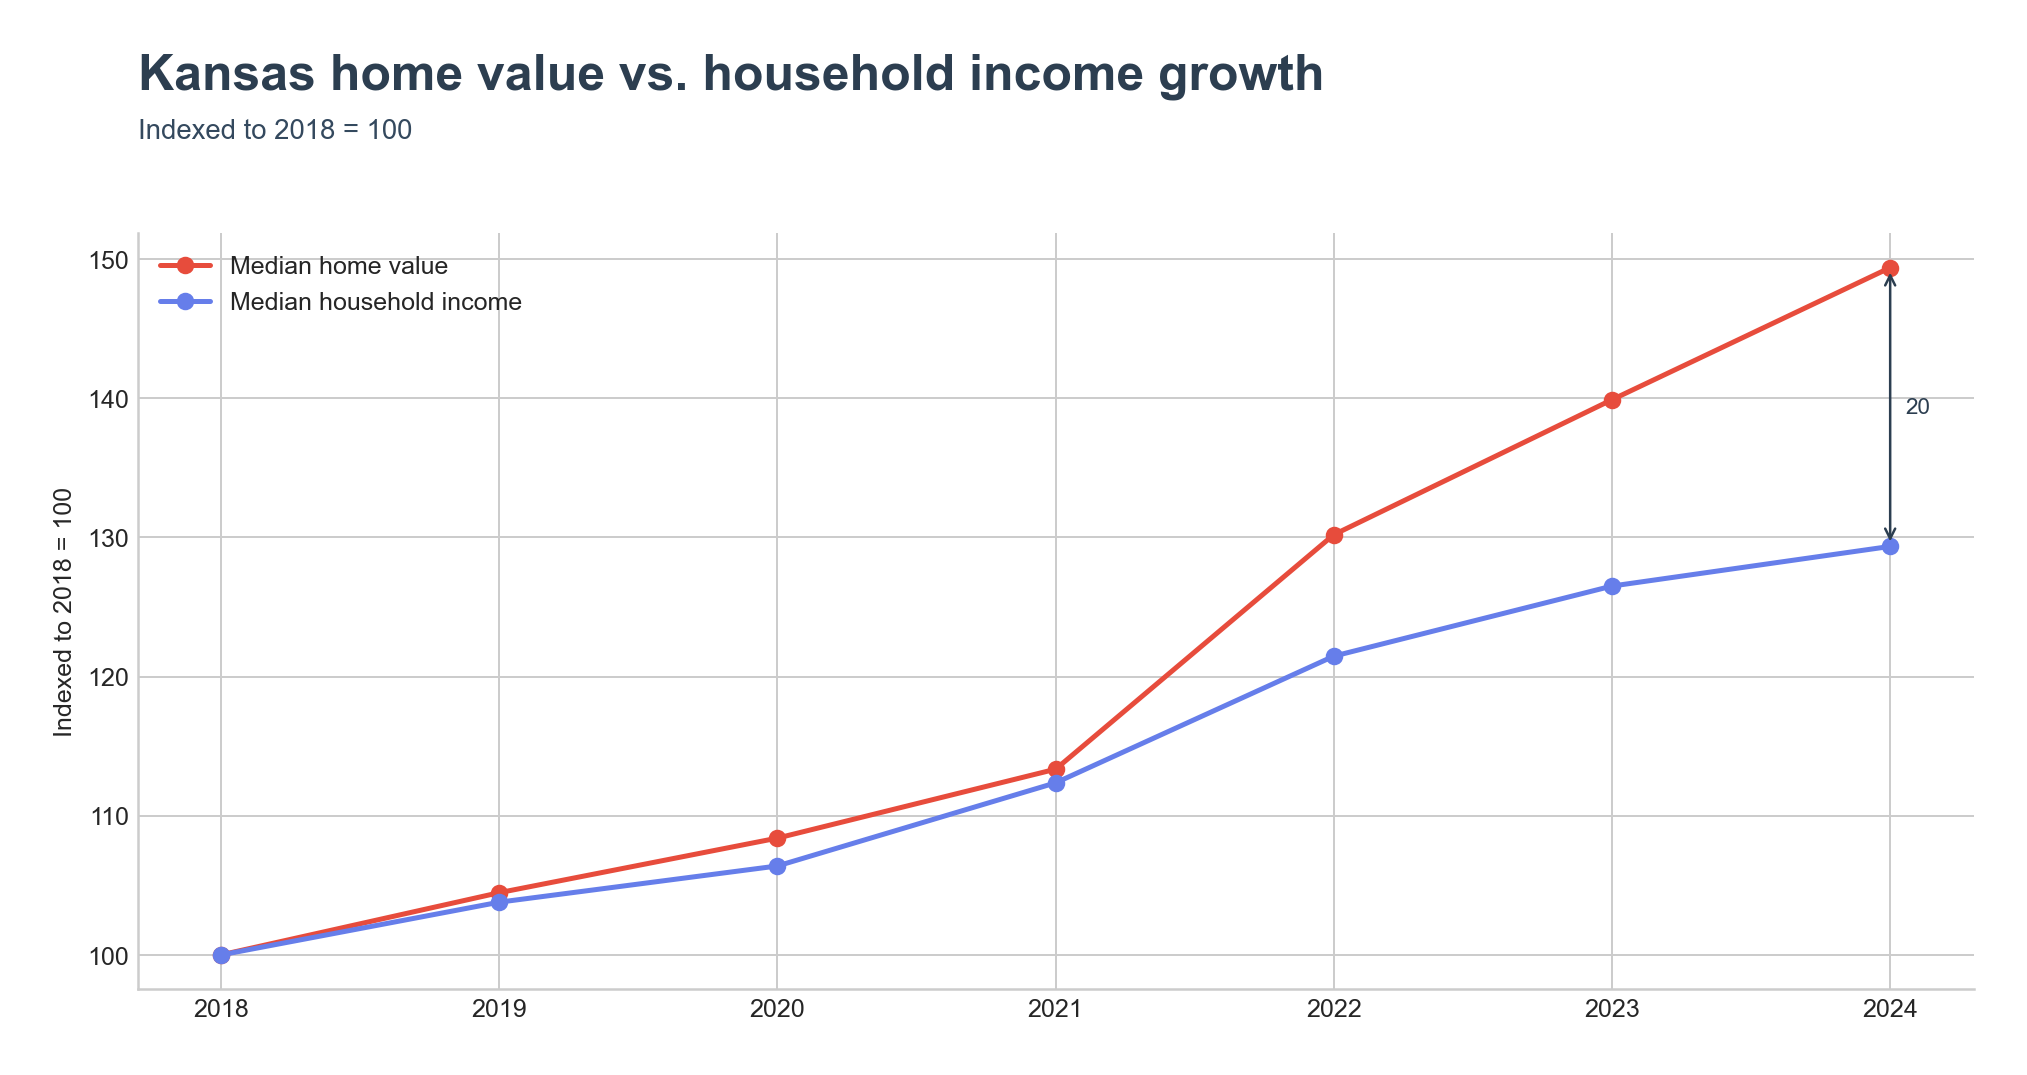
Underlying the ratio's rise, Kansas's median home value grew faster than its median household income. Indexed to 2018, home value reached 149 by 2024 while household income reached 129.
Key Takeaways
- Kansas's home-value-to-income ratio was 2.92x in 2024, against a United States ratio of 4.12x.
- The gap between Kansas and the United States widened between 2018 and 2024: the state moved from 2.53x to 2.92x while the nation moved from 3.40x to 4.12x.
- Lawrence had the highest ratio in the state at 4.50x; Coffeyville had the lowest at 1.33x.
- The share of households in the ≥4x band grew from 2.2% in 2018 to 7.0% in 2024.
- Median home value in Kansas grew to an index of 149 (2018 = 100) by 2024, while median household income grew to an index of 129.