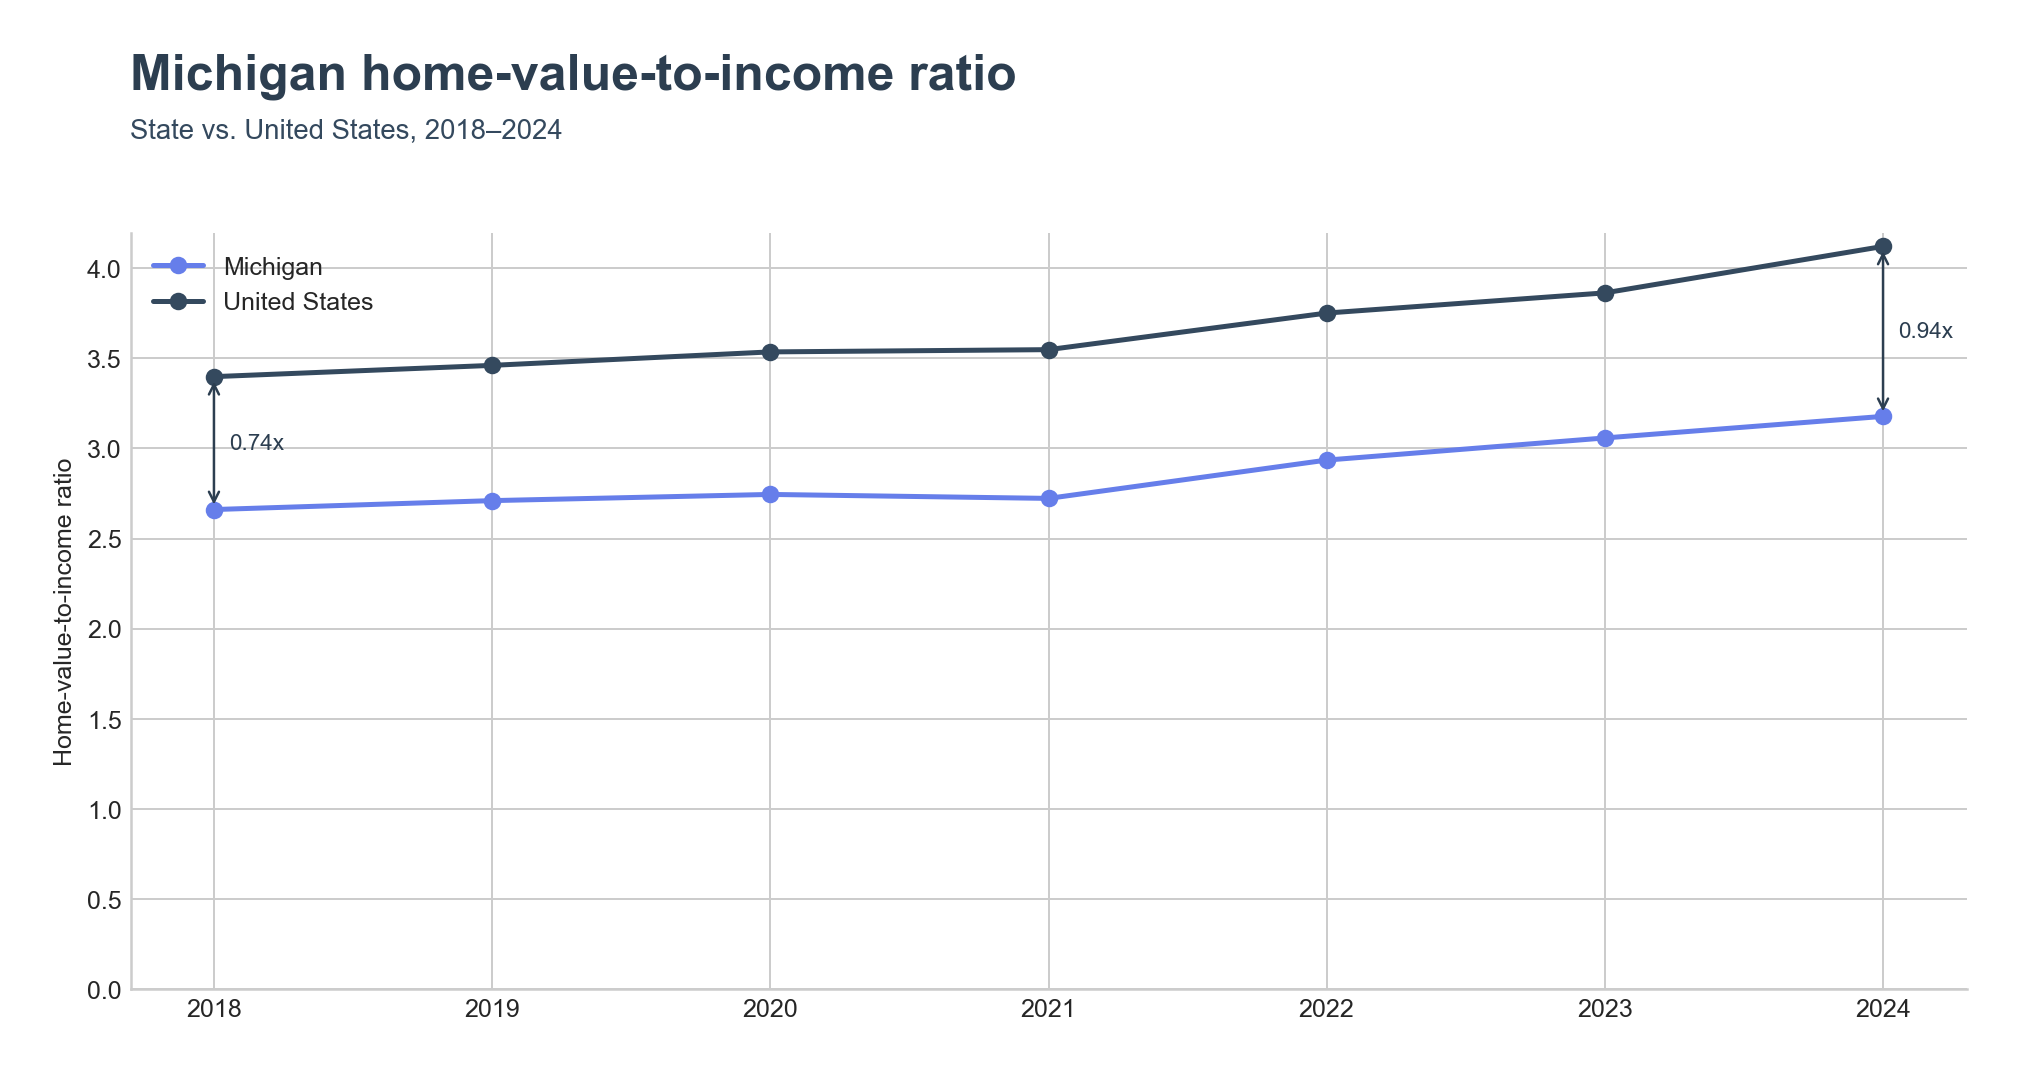
Michigan's home-value-to-income ratio reached 3.18x in 2024, still below the United States figure of 4.12x. The state started 2018 0.74x below the national ratio and closed 2024 0.94x below it, widening the gap as national home values outran incomes faster than Michigan's did.
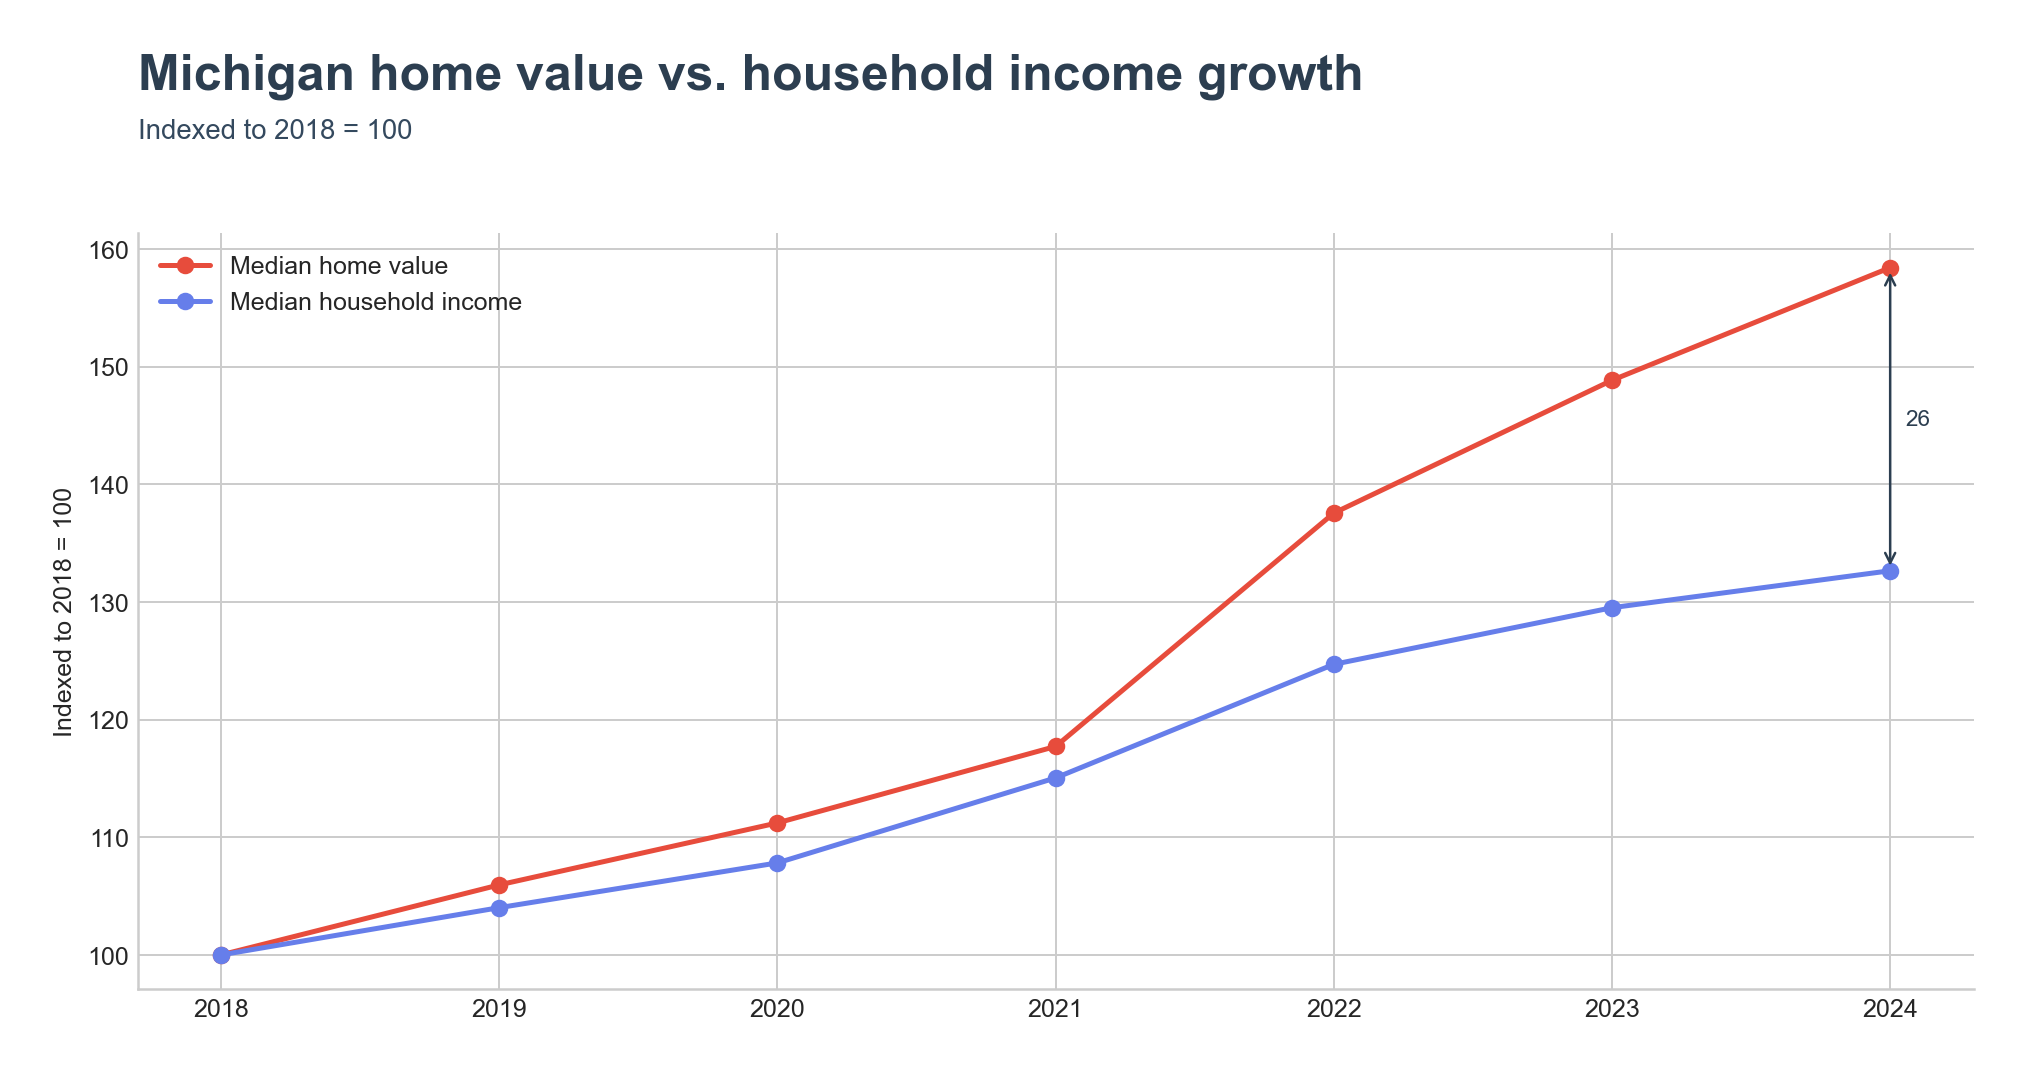
Michigan's median home value rose to an index of 158 (2018 = 100) by 2024, while median household income rose to only 132 over the same period, a 26-point gap between the two lines.
Where the ratio runs highest
East Lansing tops the state at 5.93x, driven by a median home value of $270,800 against median household income of just $45,687. The city's population is dominated by Michigan State University, whose enrollment has run close to the size of the city itself, and several neighborhoods near campus have adopted rental-restriction zones that have expanded since 2004, a dynamic that keeps owner-occupied home prices high relative to a largely student, lower-income household base (Wikipedia ).
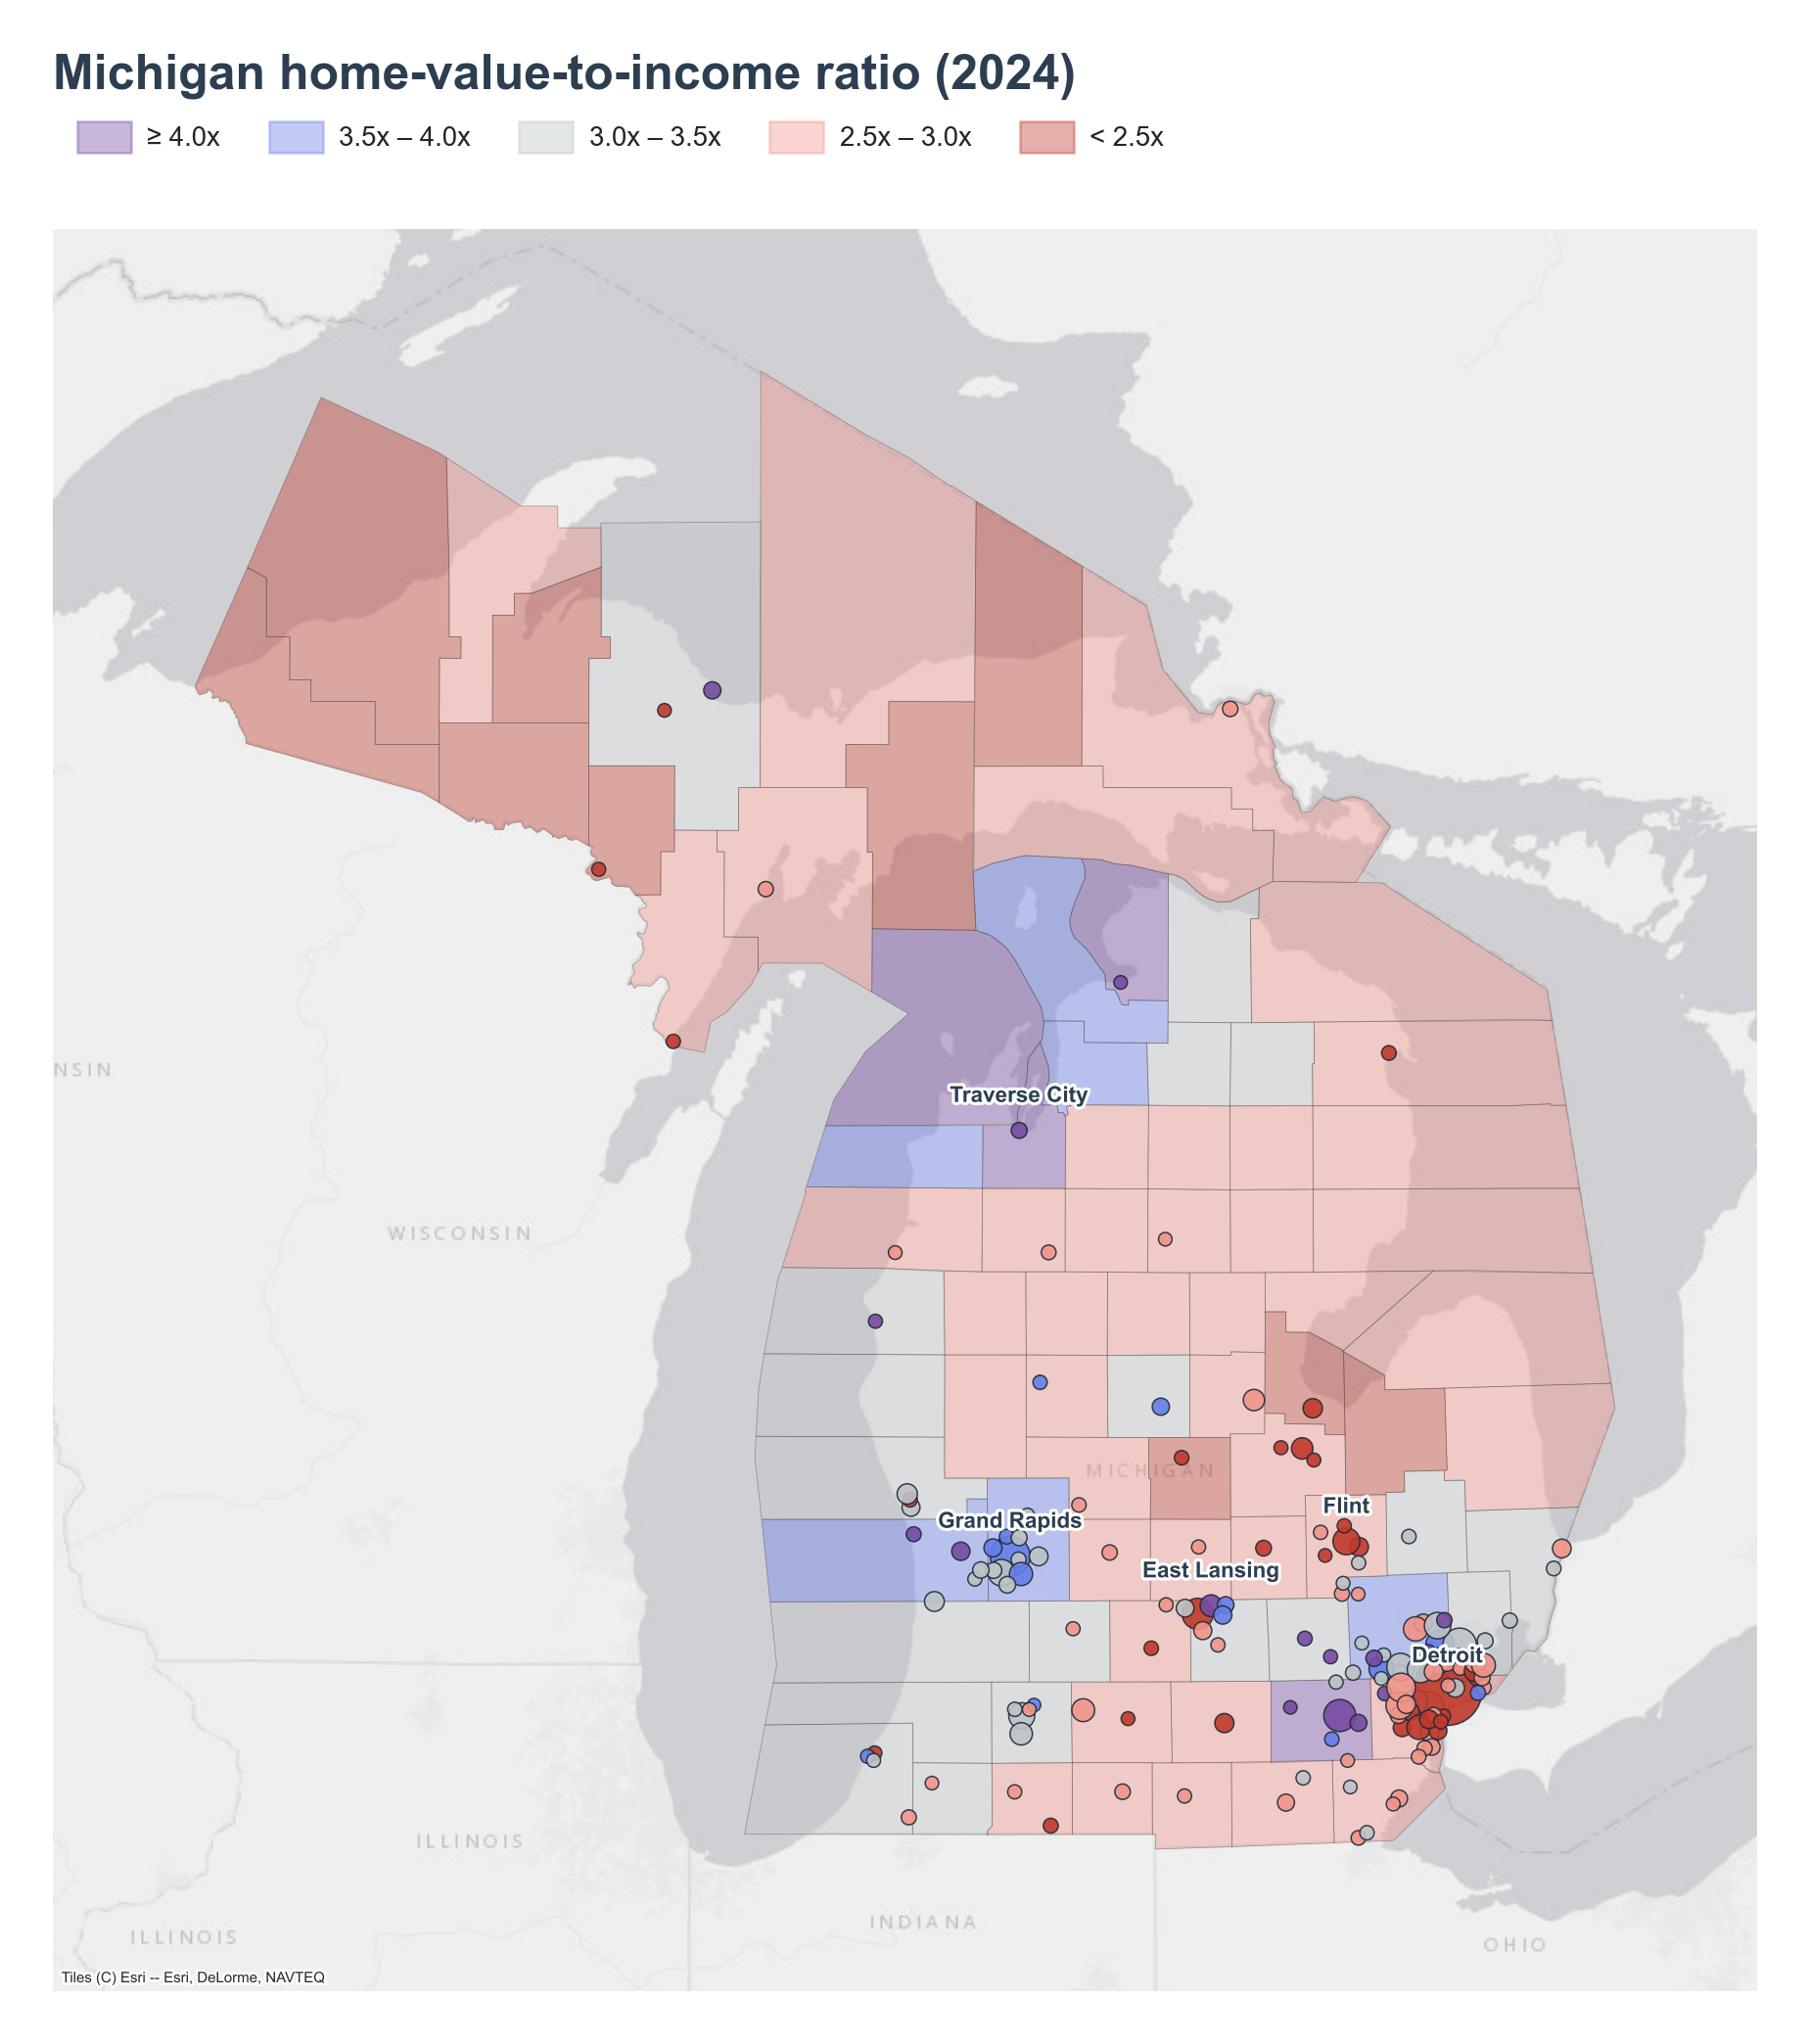
Traverse City follows at 5.61x (home value $415,400, income $74,087). Most of the city's economy runs on tourism, and its population swells many times over during the National Cherry Festival (Wikipedia ), a seasonal draw that helps push home values well above what year-round local incomes would otherwise support. On the map, Traverse City and its home county, Grand Traverse County (4.16x), sit inside a cluster of purple and blue ratio bands along the Lake Michigan shoreline in the northwestern Lower Peninsula, alongside Leelanau County (4.61x, the state's highest county figure) and Benzie County (3.82x).
Wixom (5.58x, home value $365,200, income $65,485) and the Ann Arbor–Ypsilanti pair round out the top of the list. Ann Arbor sits at 5.52x (home value $453,400, income $82,212) and Ypsilanti at 4.99x (home value $232,700, income $46,588). The University of Michigan is Ann Arbor's largest employer and occupies a substantial share of downtown land, and the city has grappled with rising land values and gentrification pressure for decades (Wikipedia ) — pressure visible on the map as a cluster of purple, high-ratio markers around Washtenaw County (4.19x), southwest of Detroit.
Where the ratio runs lowest
Beecher, an unincorporated community on the map just north of Flint, posts the state's lowest ratio at 1.37x (home value $51,500, income $37,515). Flint itself follows at 1.42x (home value $53,500, income $37,646). Flint's population has fallen by more than half since 1960 as General Motors cut local employment by orders of magnitude over the same period (Wikipedia ) — the resulting disinvestment shows up directly in home values that have not kept pace with even modest local incomes.
Saginaw (1.56x), River Rouge (1.59x), and Ecorse (1.63x) form the rest of the bottom five. On the map, River Rouge and Ecorse sit in the deep-red, sub-2.5x cluster immediately along the Detroit riverfront, distinct from the high-ratio suburbs further out.
At the county level, the lowest ratios are concentrated in Michigan's Upper Peninsula: Iron County (1.95x), Gogebic County (2.03x), Luce County (2.04x), and Ontonagon County (2.05x) — all shown in the reddish, low-ratio shading in the map's northwestern reaches. Gratiot County (2.32x), in the central Lower Peninsula, is the only bottom-five county outside the Upper Peninsula.
How the distribution has shifted
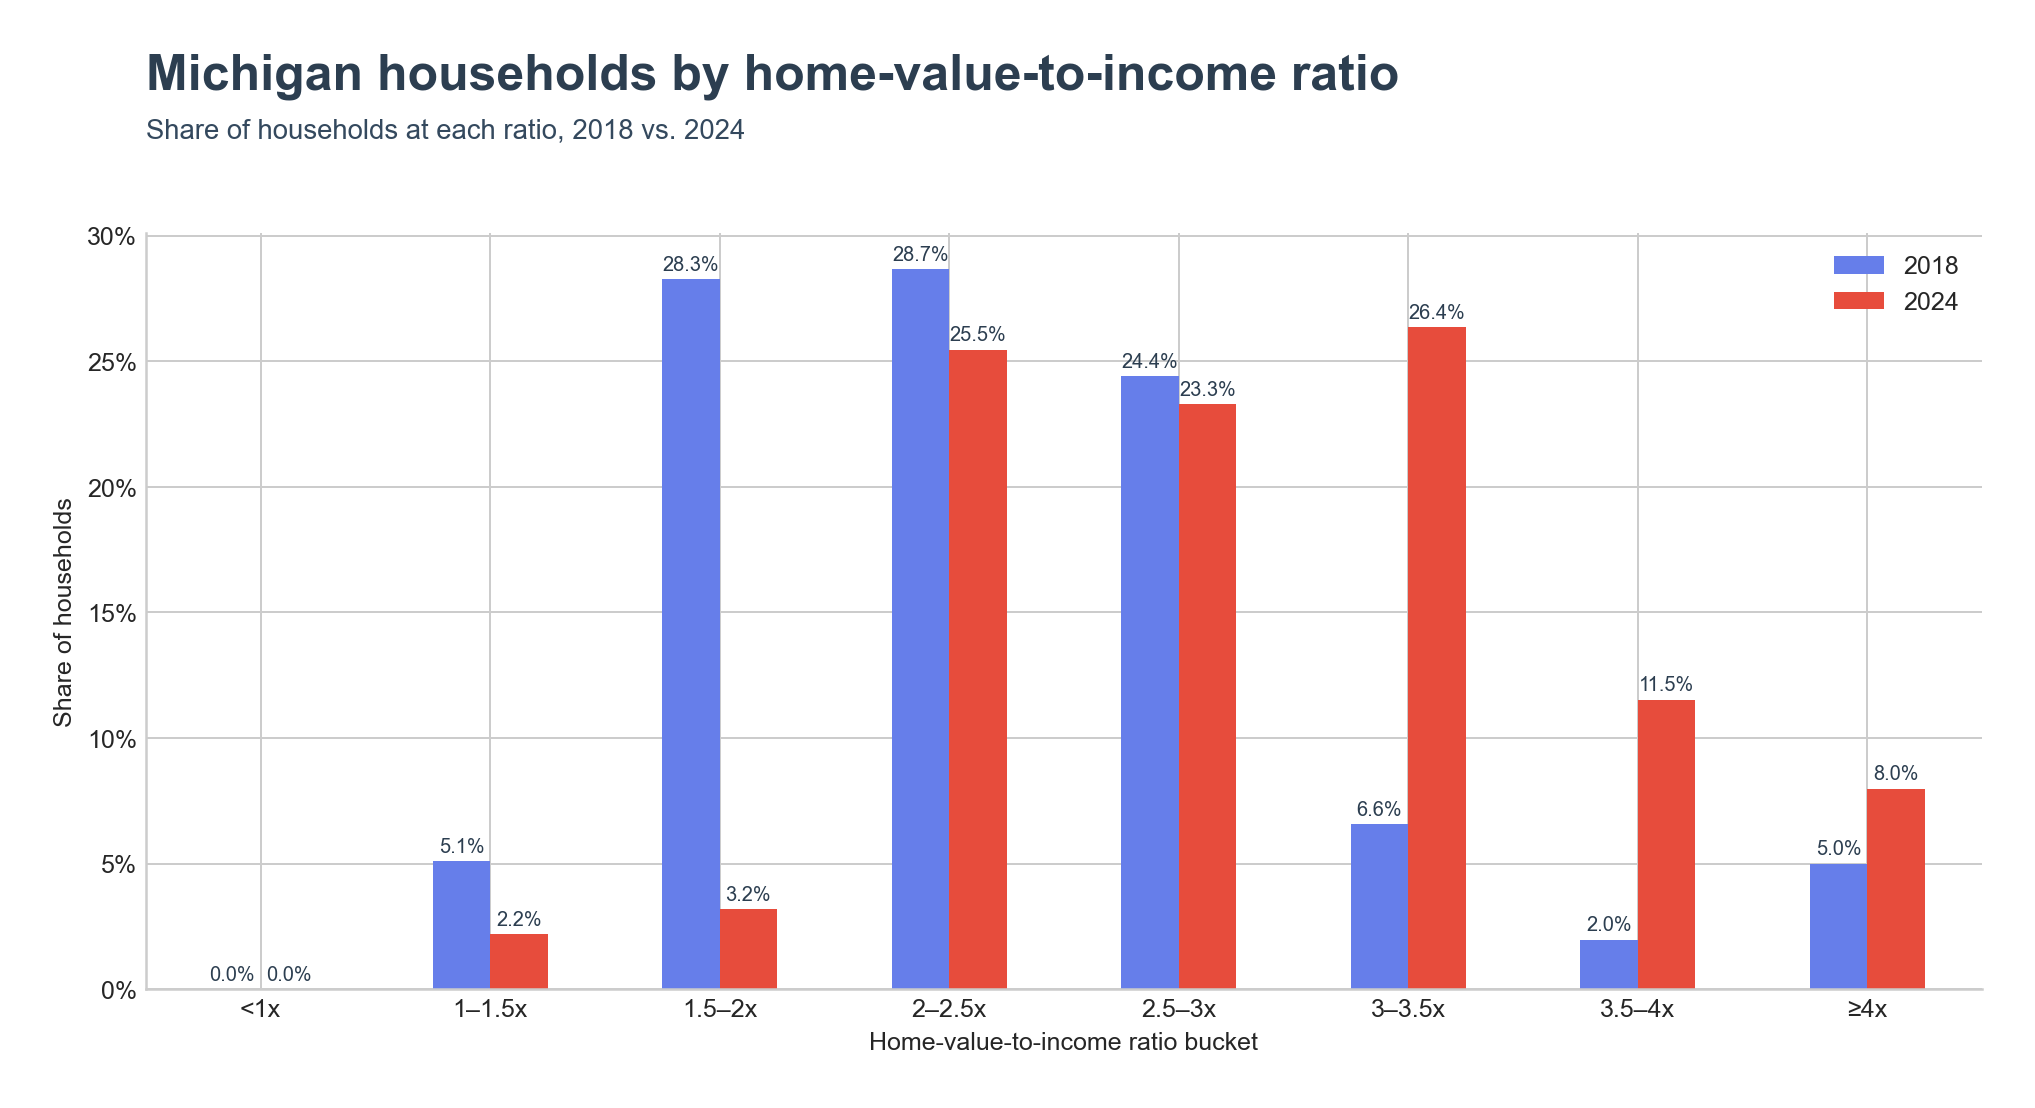
In 2018, most Michigan households clustered in the 1.5–2x and 2–2.5x bands (28.3% and 28.7% of households respectively). By 2024, those bands had thinned to 3.2% and 25.5%, while the 3–3.5x band grew from 6.6% to 26.4% of households and the ≥4x band grew from 5.0% to 8.0%.
Key Takeaways
- Michigan's home-value-to-income ratio was 3.18x in 2024, up from 2.66x in 2018, and remains below the US figure of 4.12x.
- The state's shortfall against the US figure widened from 0.74x in 2018 to 0.94x in 2024.
- Michigan's median home value indexed to 158 by 2024 versus 132 for median household income, a 26-point gap.
- East Lansing (5.93x), Traverse City (5.61x), and Wixom (5.58x) post the state's highest place-level ratios.
- Beecher (1.37x) and Flint (1.42x) post the state's lowest place-level ratios.
- The 3–3.5x household share grew from 6.6% in 2018 to 26.4% in 2024, the largest gain of any band; the 1.5–2x band posted the largest decline, from 28.3% to 3.2%.