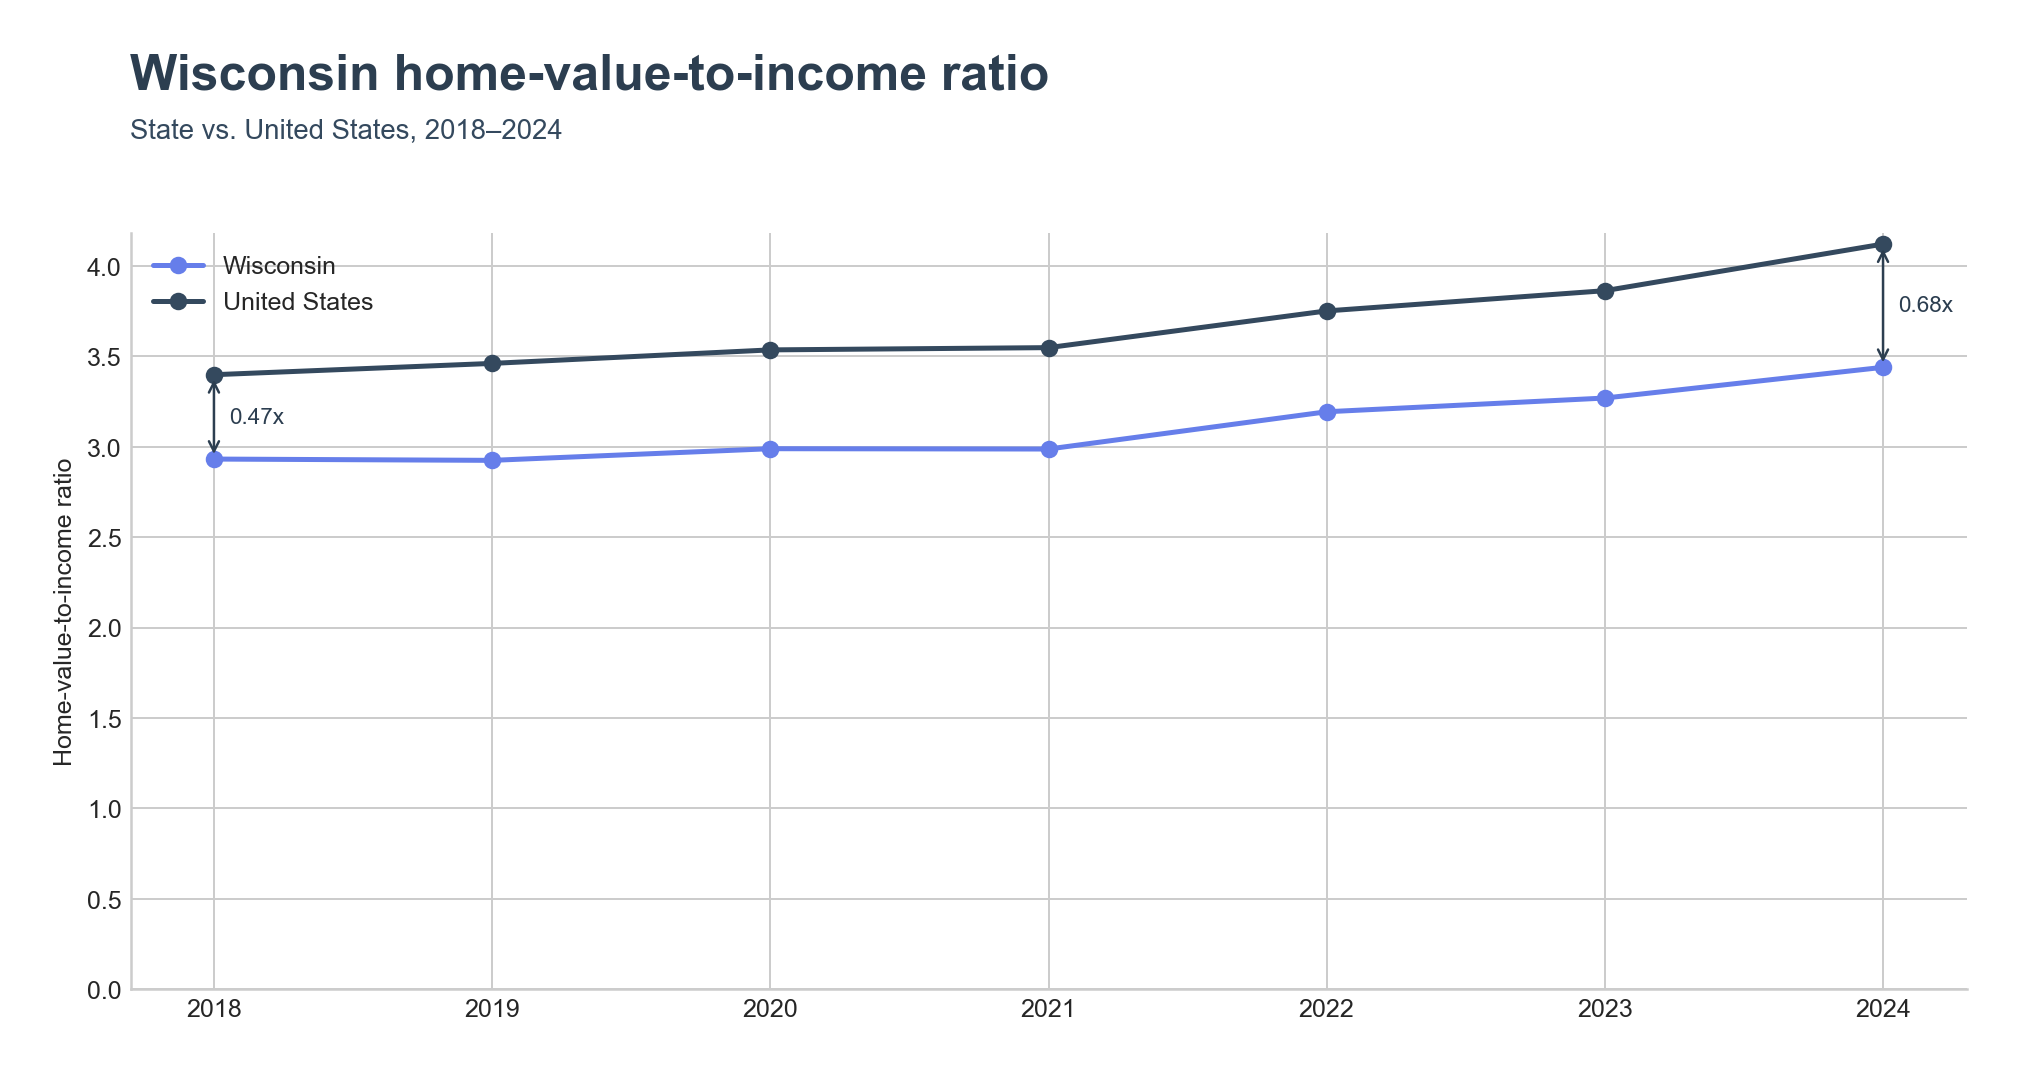
Wisconsin's home-value-to-income ratio stood at 3.44x in 2024, below the United States figure of 4.12x. That distance has grown, not shrunk: in 2018 Wisconsin's ratio of 2.93x sat against a national 3.40x, a smaller separation than the one that exists today.
Where affordability is tightest
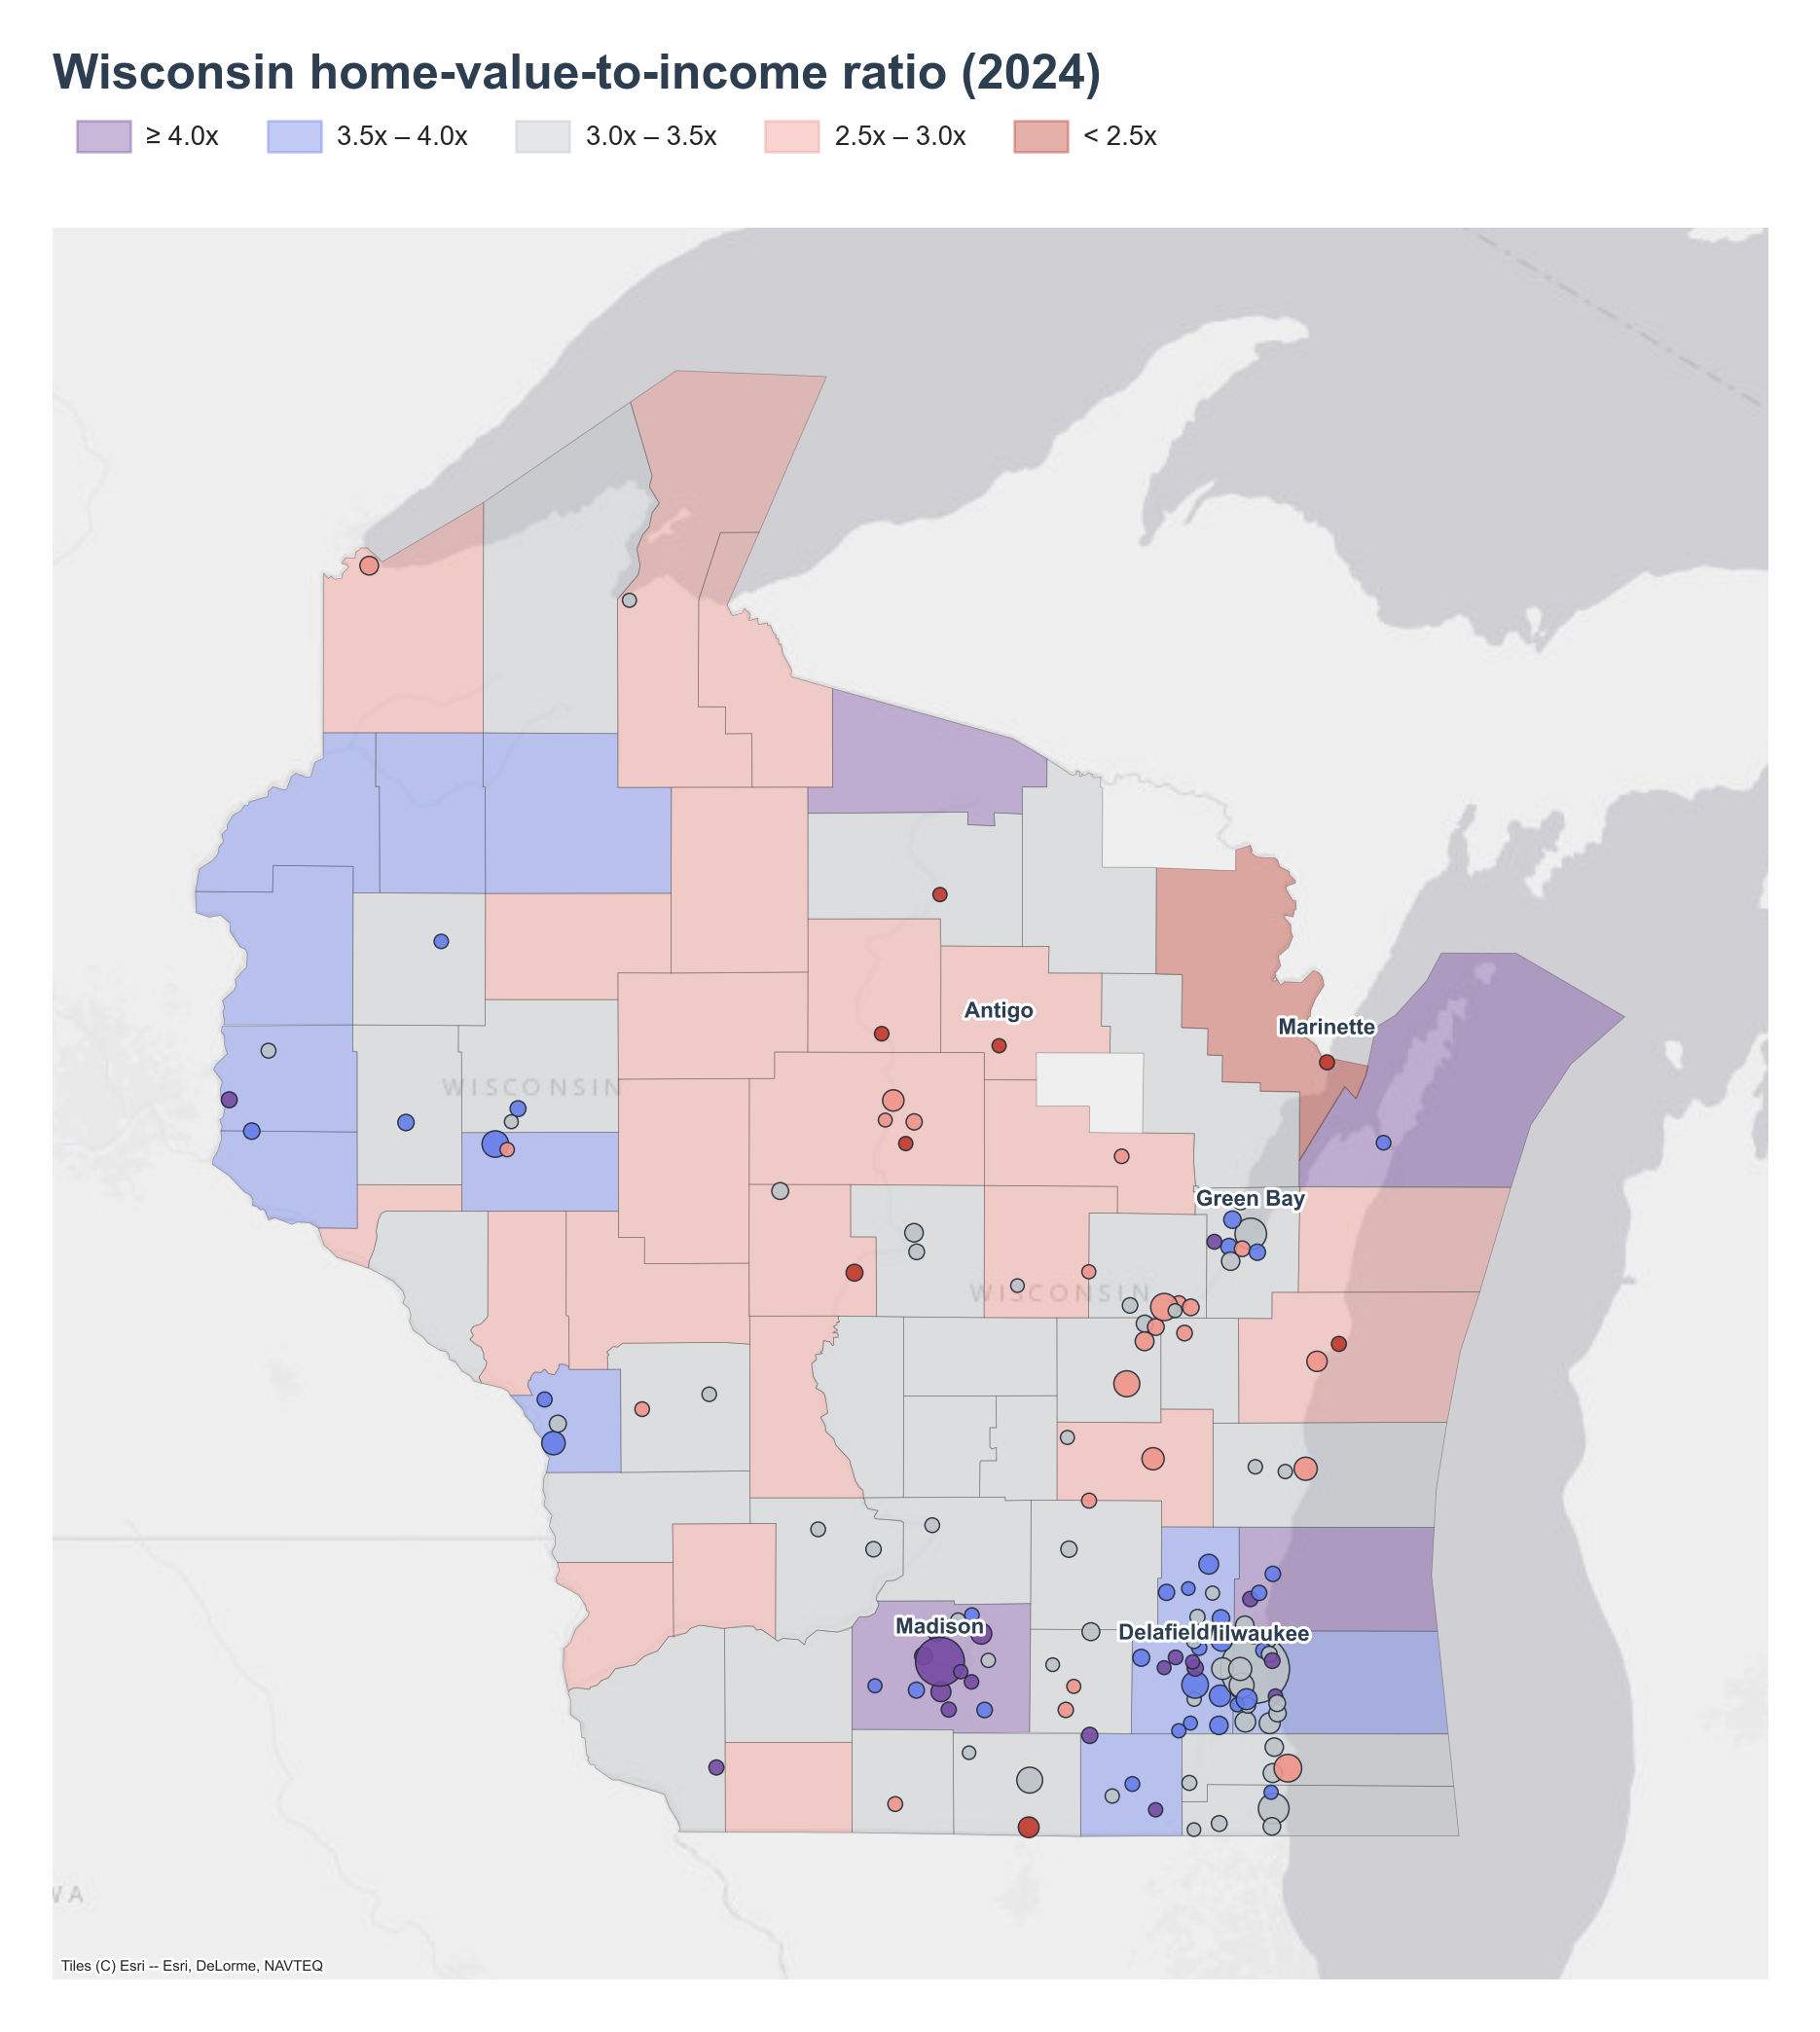
Delafield tops the state at 5.86x, on a median home value of $555,800 against median household income of $94,806. It sits in the Lake Country area of Waukesha County, in the Milwaukee suburban cluster on the map's southeast corner. Delafield grew up as a resort and residential town on Lake Nagawicka , a lake-town character that keeps home values elevated well above local incomes.
Middleton follows at 5.41x (home value $484,200, income $89,524), part of the purple cluster around Madison. Middleton is a suburb of the state capital, and its economy leans on the same research and technical-services base that anchors Madison's economy , pulling home values up alongside strong local incomes.
The rest of the top places cluster in the same two metro areas: Shorewood (5.12x), Cedarburg (4.97x), and Monona (4.88x) all sit inside the Madison or Milwaukee suburban rings visible on the map. Two counties stand out for reasons tied to recreation rather than commuting. Door County, the peninsula northeast of Green Bay, posts the highest county ratio at 4.58x — consistent with its identity as one of Wisconsin's most visited tourist destinations, drawing summer visitors to its state parks and shoreline . Vilas County, in the far north near the Michigan border, ranks third among counties at 4.38x, just behind Dane County at 4.39x; it holds more lakes than any other Wisconsin county and its economy runs on lake-based tourism , with much of its housing stock held seasonally rather than by year-round residents.
Where affordability is loosest
Marinette, on the state's northeastern border, has the lowest ratio among places at 2.05x (home value $120,200, income $58,638). It is a working industrial city on Green Bay, where home values have stayed low relative to local incomes. Antigo follows at 2.30x (home value $104,800, income $45,520), and Merrill at 2.33x (home value $123,800, income $53,148) — both in the reddish central-north band on the map. Marinette County itself is also the lowest-ranked county, at 2.49x.
Kronenwetter (2.38x) and Wisconsin Rapids (2.39x) round out the bottom places, both in central Wisconsin. Kronenwetter's case is distinct from the others: its median household income of $115,044 is the highest of any bottom-ranked place, so its low ratio reflects strong local income rather than depressed home values.
A widening gap, not a narrowing one
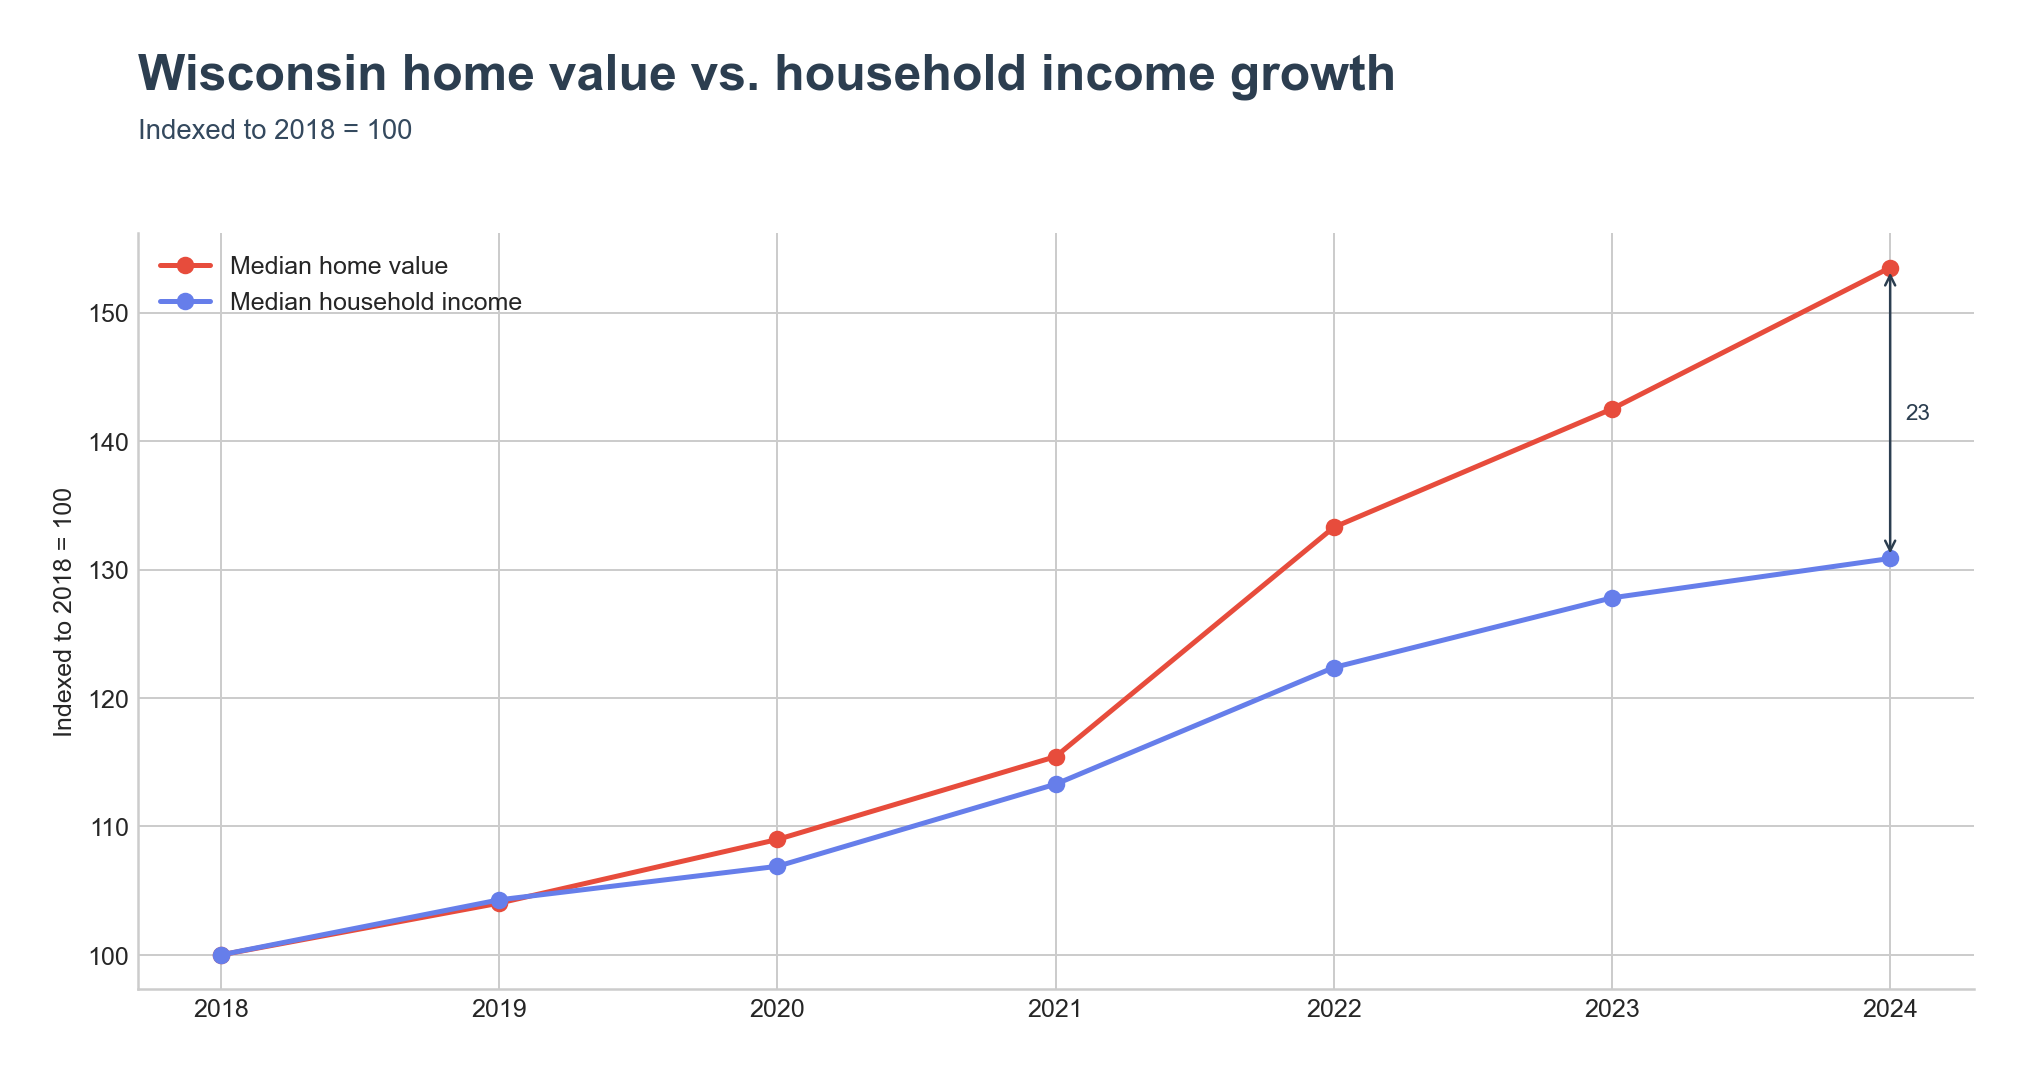
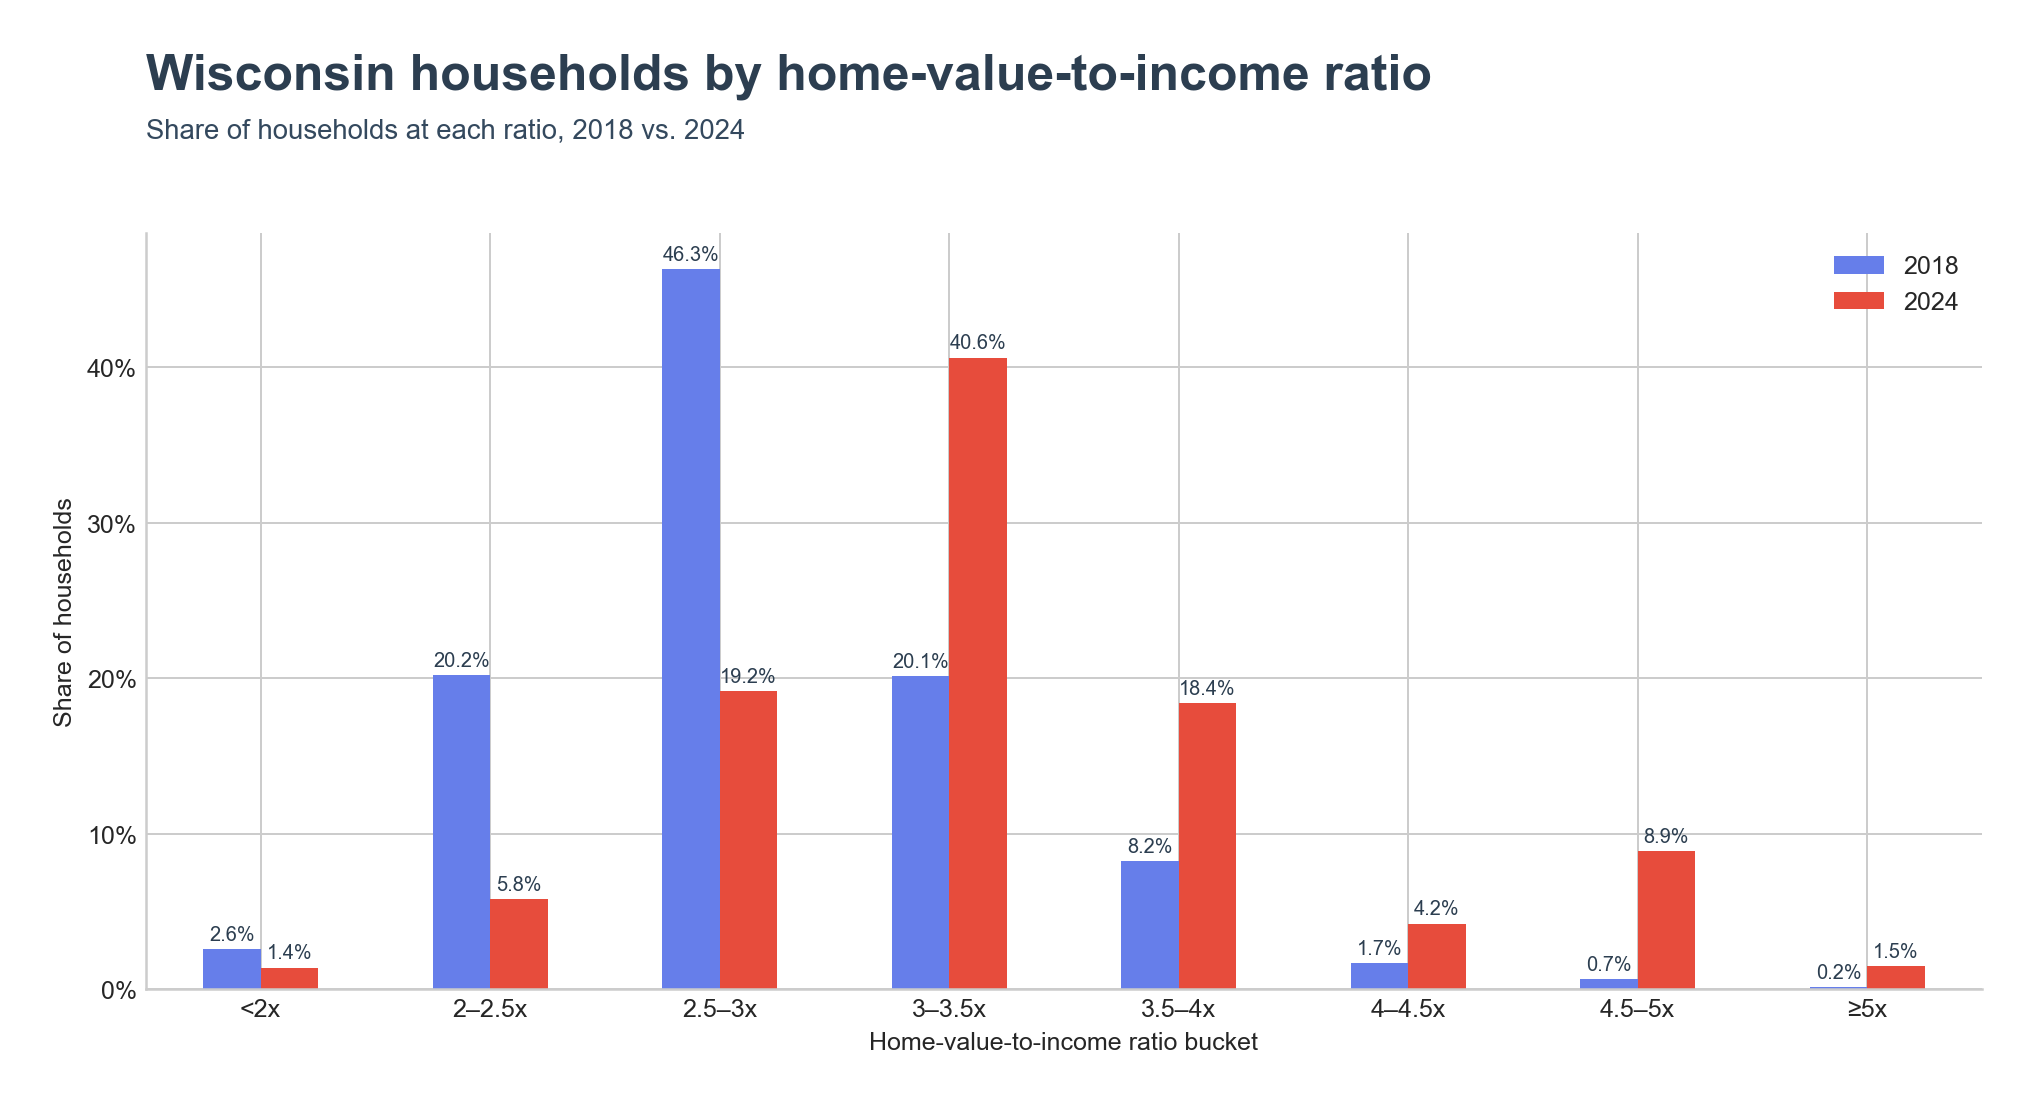
Statewide, home values and incomes have grown at different speeds since 2018. The distribution of households by ratio bucket shifted accordingly: the share of Wisconsin households in the 2.5x–3x range fell from 46.3% in 2018 to 19.2% in 2024, while the 3x–3.5x range grew from 20.1% to 40.6%. The share of households above 4.5x rose from 0.7% to 8.9% (4.5x–5x) and from 0.2% to 1.5% (≥5x), showing more households have moved into higher-ratio territory even as the state overall remains below the national figure.
Key Takeaways
- Wisconsin's 2024 home-value-to-income ratio was 3.44x, below the United States figure of 4.12x.
- Delafield had the state's highest ratio among places, at 5.86x, followed by Middleton at 5.41x.
- Door County led all counties at 4.58x, followed by Dane County at 4.39x and Vilas County at 4.38x.
- Marinette had the lowest ratio among places, at 2.05x; Marinette County was the lowest-ranked county, at 2.49x.
- The share of Wisconsin households above a 4.5x ratio rose from 0.7% in 2018 to 8.9% in 2024 (the 4.5x–5x band alone).