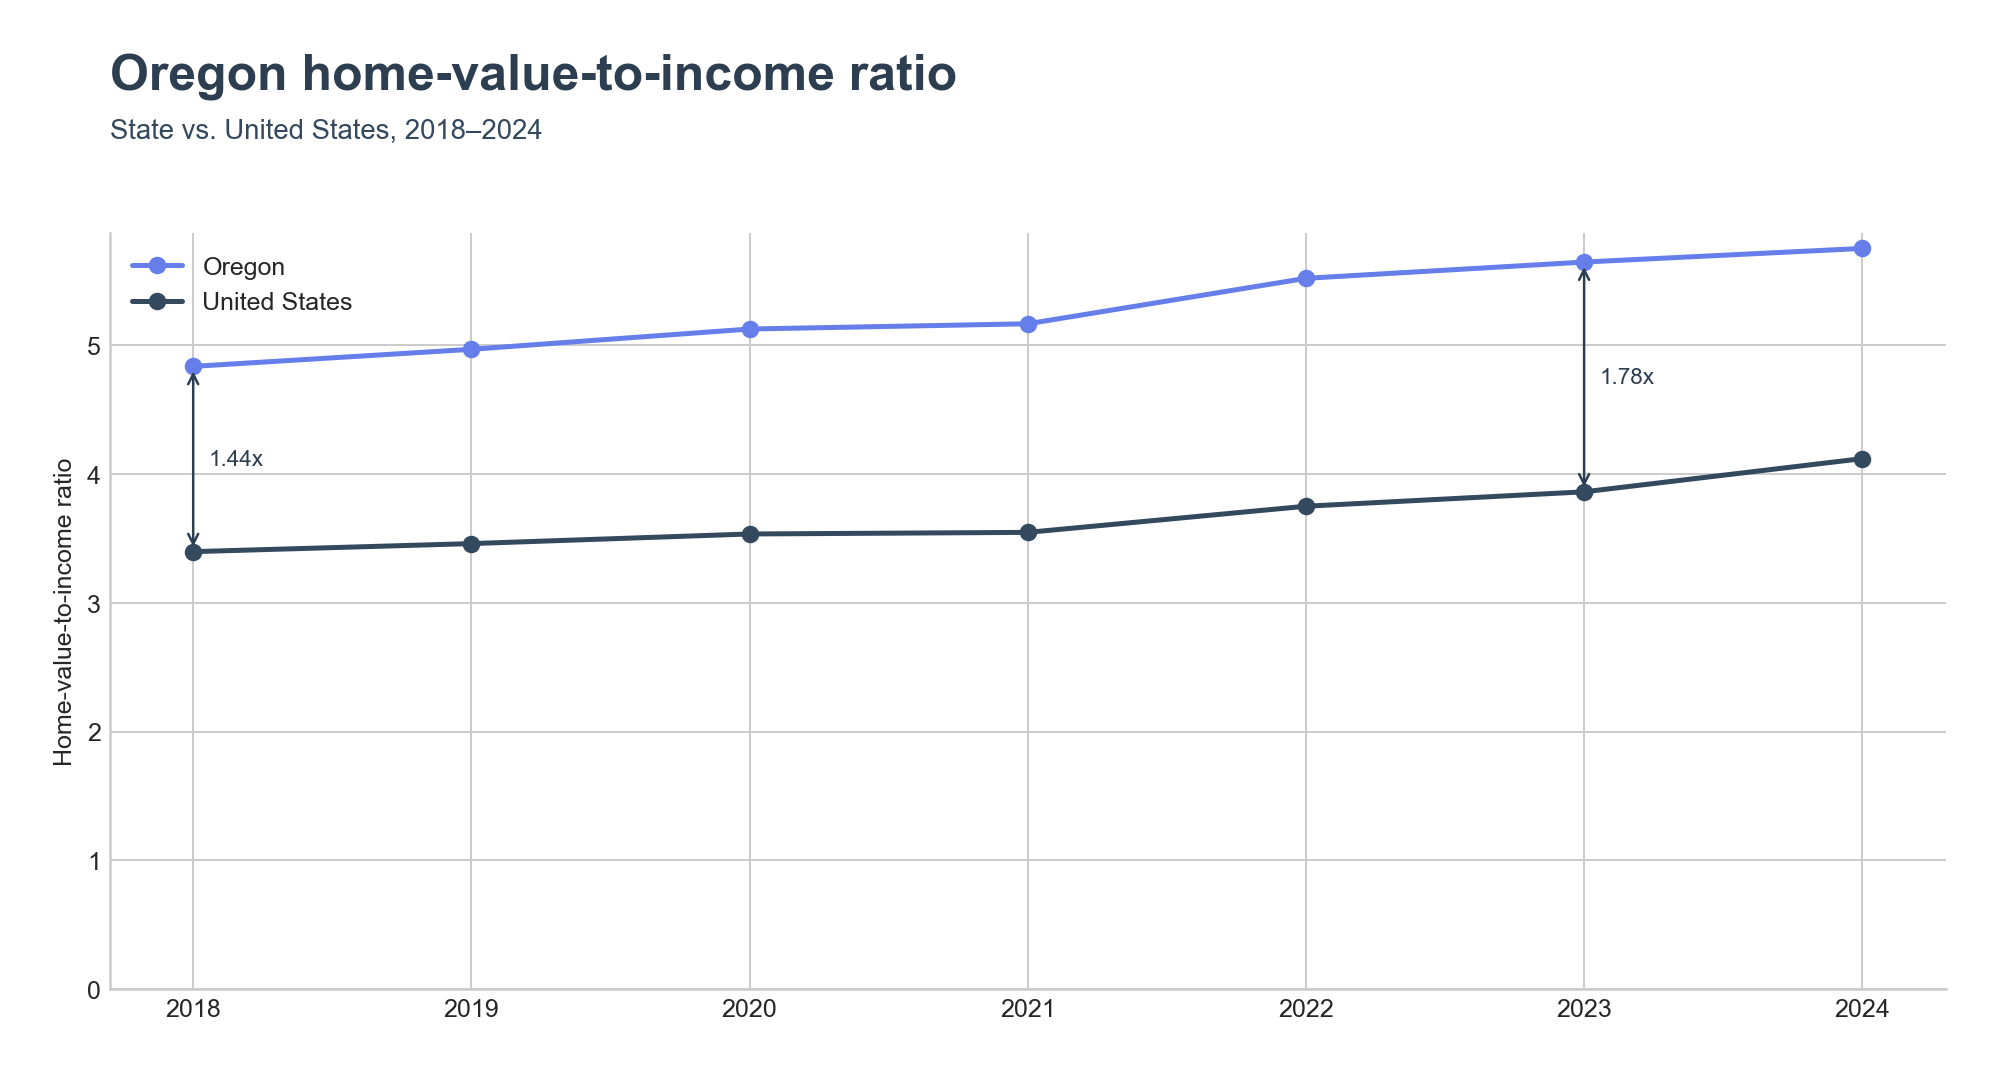
Oregon's home-value-to-income ratio reached 5.75x in 2024, well above the United States figure of 4.12x. The state has sat above the national ratio every year since 2018, when Oregon stood at 4.84x against a national 3.40x — and that gap has widened, not narrowed, through 2024.
Coastal and college towns lead
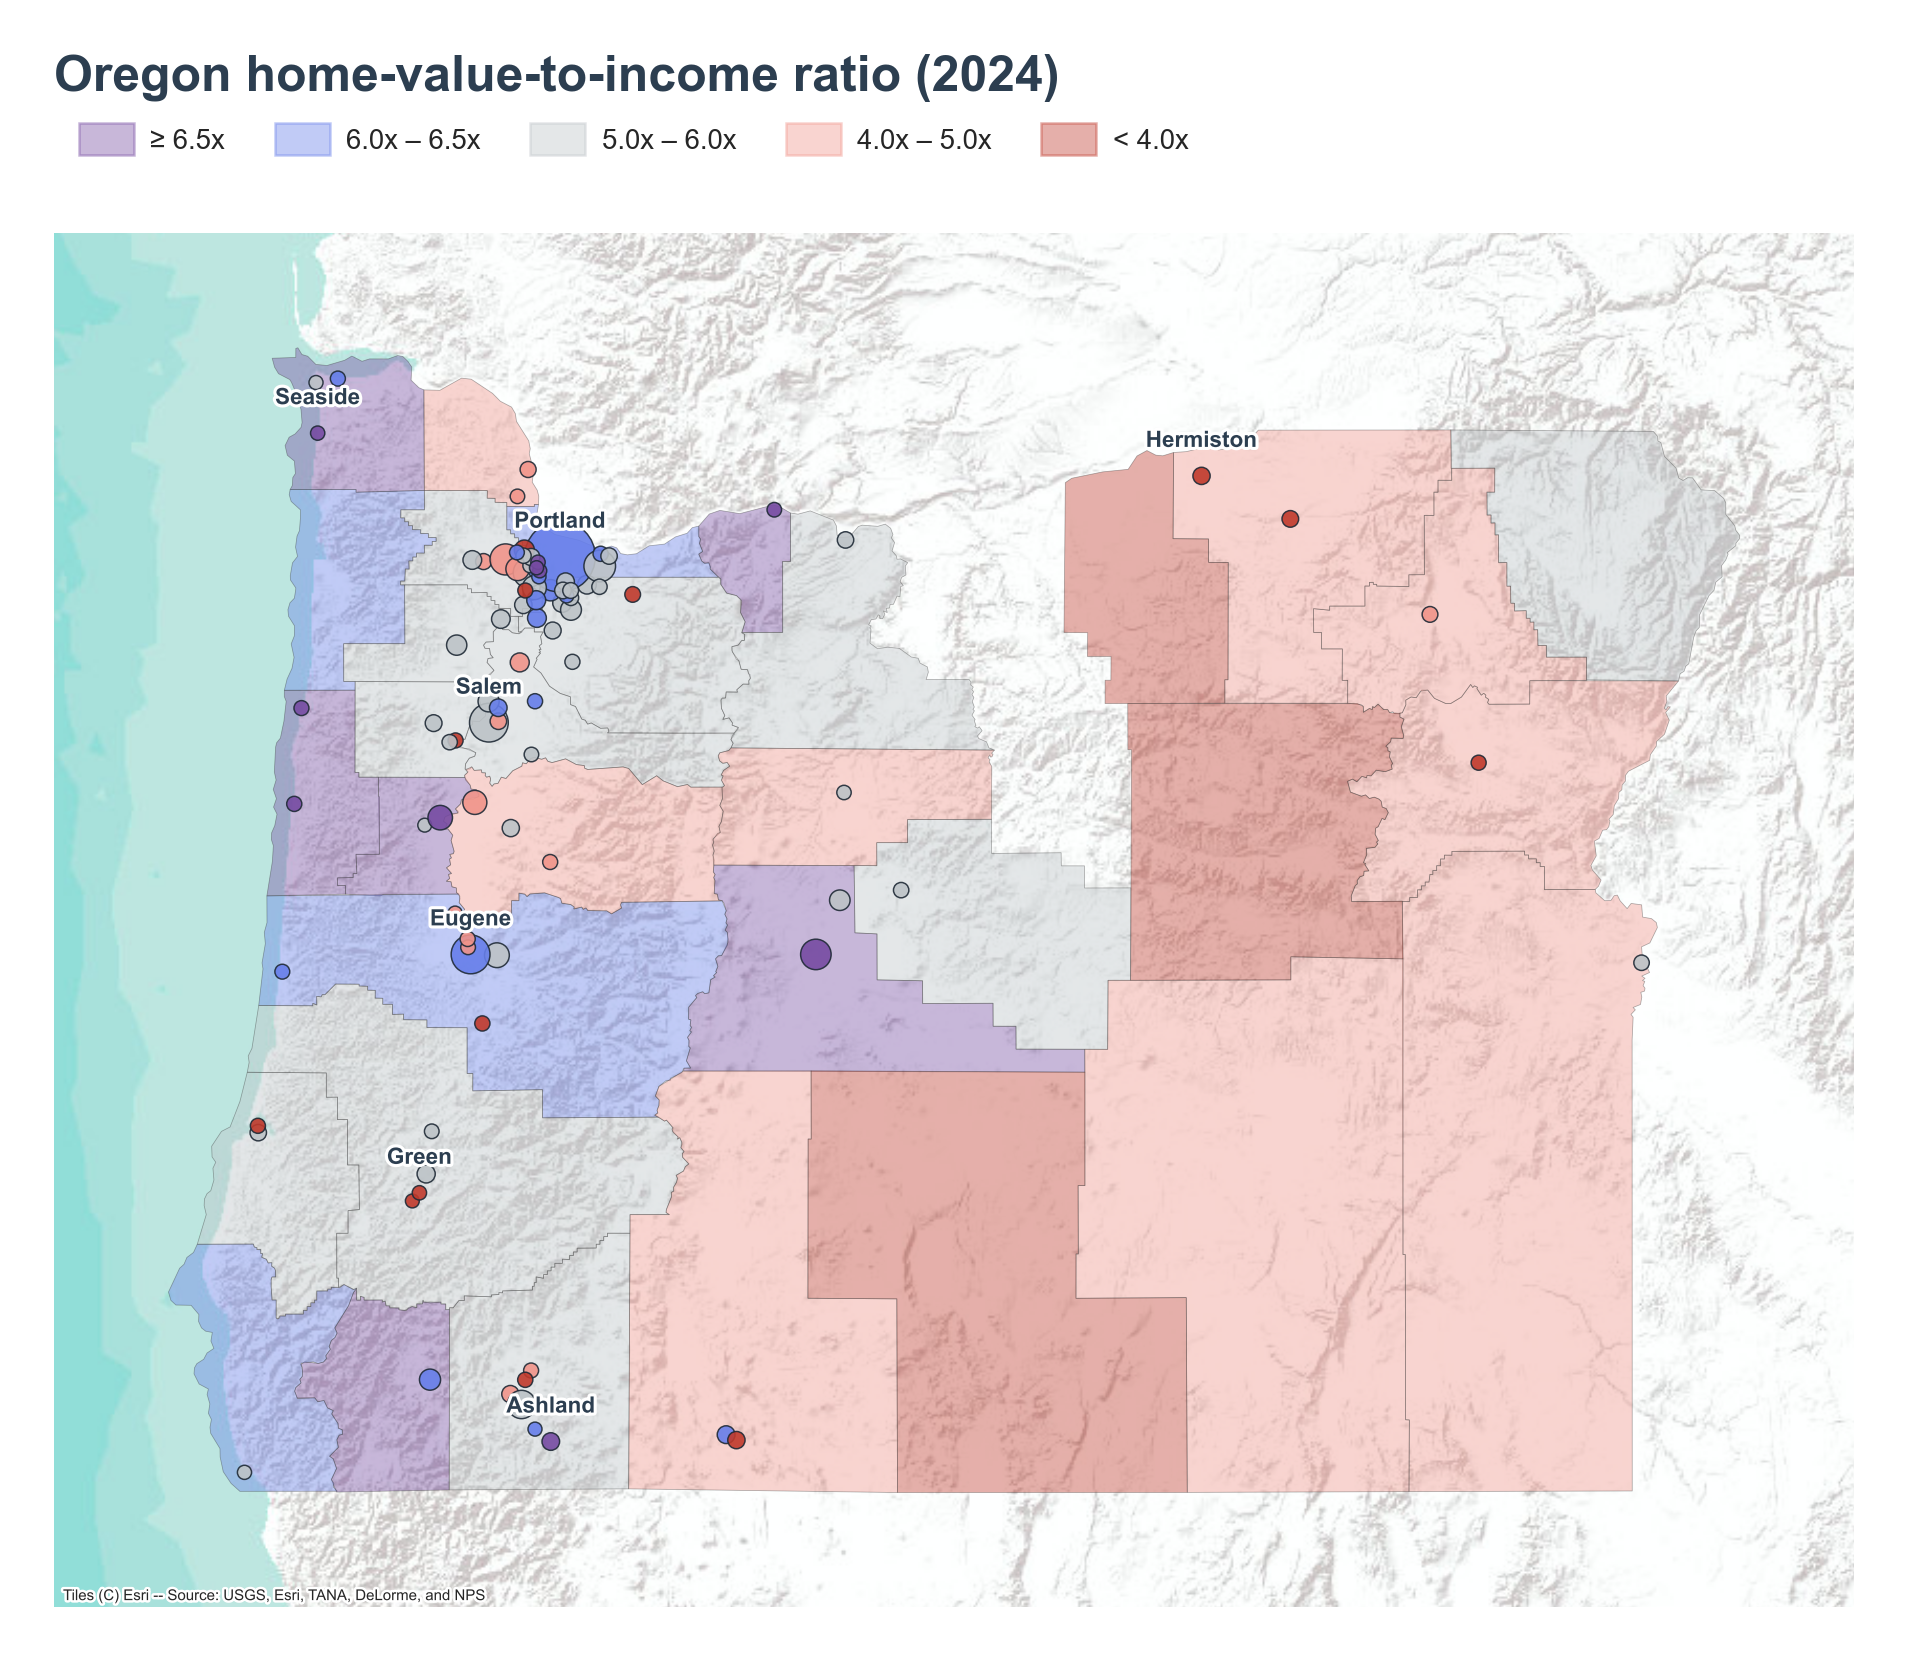
Seaside tops the state at 9.70x, the highest ratio among Oregon places, with a median home value of $459,500 against median household income of $47,361. Seaside sits on the north coast in Clatsop County, an area built around tourism to its beaches and the Seaside Aquarium . Clatsop County itself posts a countywide ratio of 6.52x.
Ashland follows at 8.58x ($583,800 home value, $68,028 income), home to Southern Oregon University and the Oregon Shakespeare Festival , a repertory season that runs most of the year and anchors the city's visitor economy.
Hood River ranks third among places at 7.99x ($684,100 home value, $85,647 income). The city carries the nickname "Windsurfing Capital of the World" for the Columbia River Gorge conditions at Hood River Waterfront Park , and the surrounding Hood River Valley is one of the world's largest pear-growing areas. Hood River County leads all counties at 7.42x ($660,000 home value, $88,947 income).
Corvallis rounds out the top place-level highlights at 7.74x ($502,900 home value, $65,012 income), home to Oregon State University , the city's dominant institution and employer. Benton County, where Corvallis sits, posts a ratio of 6.60x.
Raleigh Hills, in the Portland metro area, also ranks among the top places at 7.61x, with a home value of $913,700 against a household income of $120,000 — the highest income among the highlighted places, but not enough to offset its home values.
Deschutes County, seat of Bend, ranks second among counties at 7.02x ($650,900 home value, $92,758 income). Wikipedia notes Deschutes is the political and economic hub of Central Oregon. Josephine County follows at 6.73x ($404,300 home value, $60,098 income).
Eastern and rural Oregon sits lowest
The lowest ratios cluster in eastern Oregon. Morrow County posts the state's lowest county ratio at 3.19x ($240,400 home value, $75,448 income), followed by Lake County at 3.50x ($219,500 home value, $62,787 income) and Grant County at 3.86x ($229,700 home value, $59,450 income). Umatilla County, at 4.17x ($282,600 home value, $67,728 income), includes Hermiston , the largest city in eastern Oregon, which posts a place-level ratio of 3.98x ($266,700 home value, $66,998 income). Harney County closes out the bottom counties at 4.39x ($242,100 home value, $55,208 income).
Among places, Green posts the lowest ratio at 3.97x ($265,500 home value, $66,813 income), just below Hermiston. Bull Mountain, in the Portland metro area, follows at 4.21x, with the highest household income among any highlighted place at $165,426 against a home value of $696,600. White City comes in at 4.25x ($302,400 home value, $71,175 income), and Altamont matches closely at 4.25x ($249,200 home value, $58,629 income).
Where the gap widened
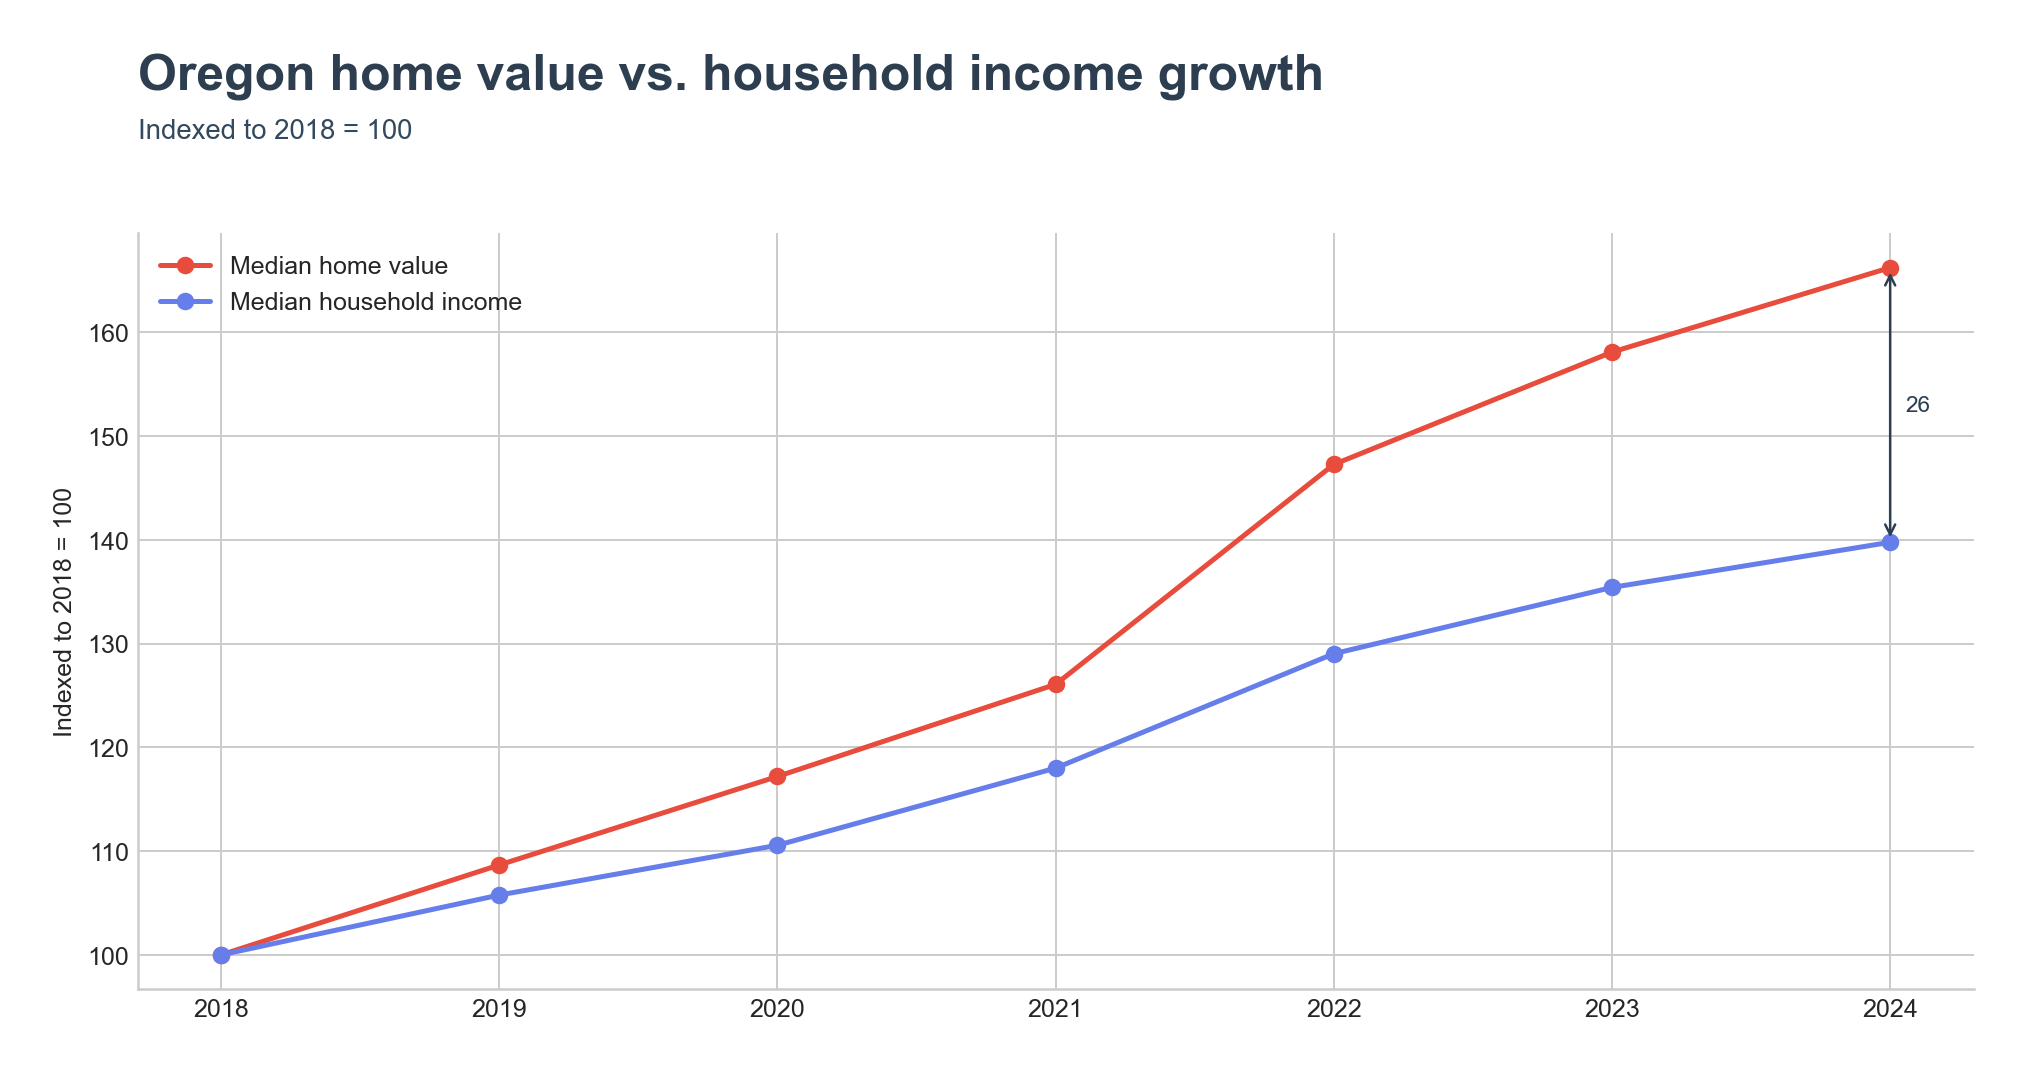
Oregon's median home value rose from $287,300 in 2018 to $477,600 in 2024, while median household income rose from $59,393 to $83,011 over the same period. Home value grew faster than income throughout, and the trend line shows the state's ratio climbing steadily each year — from 4.84x in 2018 to 5.75x in 2024 — while the national ratio moved from 3.40x to 4.12x. The distance between the two lines grew over the period rather than closed.
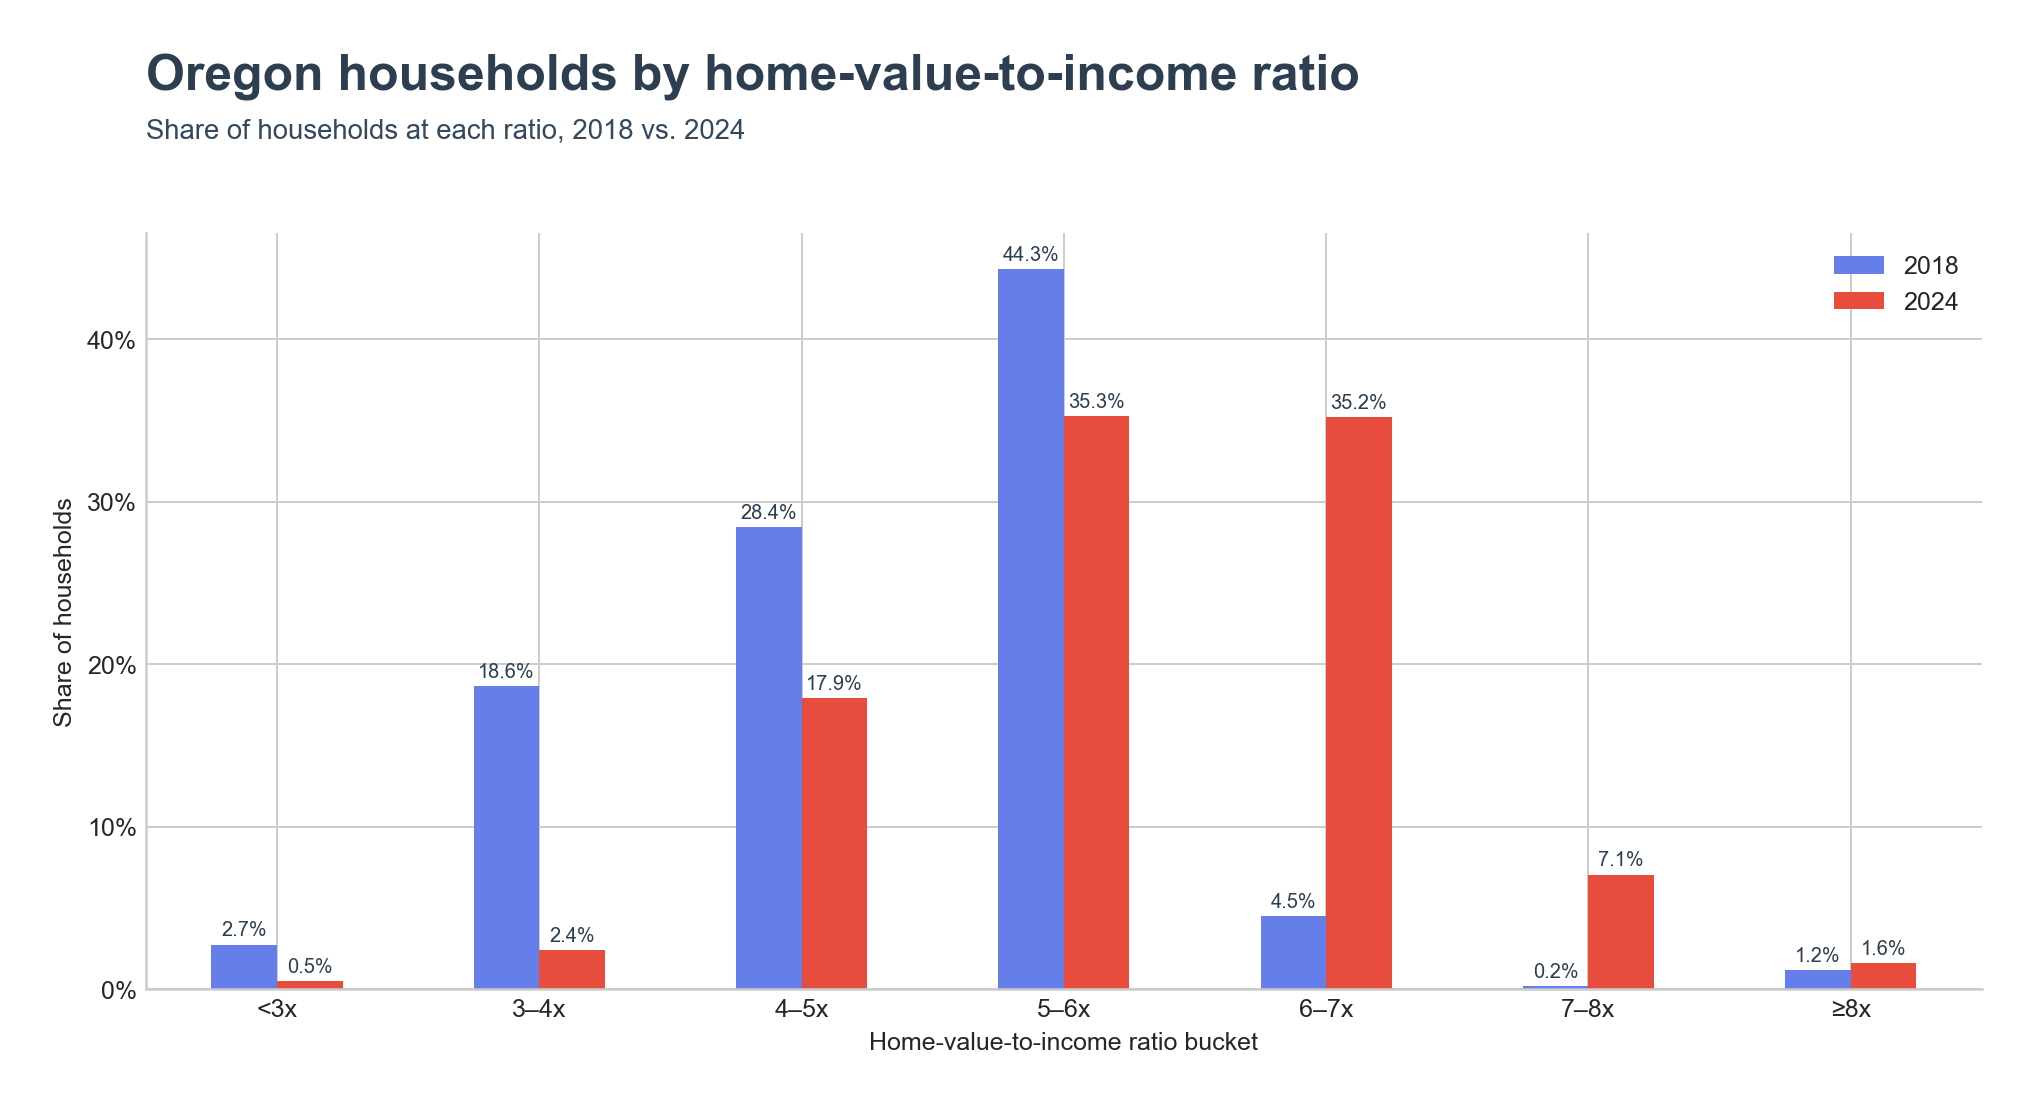
The distribution of households across ratio bands shifted higher between 2018 and 2024. In 2018, 44.3% of households lived in places with a ratio between 5x and 6x, the largest single band. By 2024, that band's share fell to 35.3%, while the 6x–7x band grew to 35.2% of households, up from 4.5% in 2018. The share of households in places below 3x fell from 2.7% to 0.5%.
Key Takeaways
- Oregon's home-value-to-income ratio stood at 5.75x in 2024, above the United States figure of 4.12x.
- The gap between Oregon and the national ratio widened from 2018 to 2024, not narrowed.
- Seaside posts the highest place-level ratio in the state at 9.70x, followed by Ashland at 8.58x and Hood River at 7.99x.
- Morrow County posts the lowest county-level ratio at 3.19x; Green posts the lowest place-level ratio at 3.97x.
- The share of Oregon households in the 6x–7x ratio band grew from 4.5% in 2018 to 35.2% in 2024.