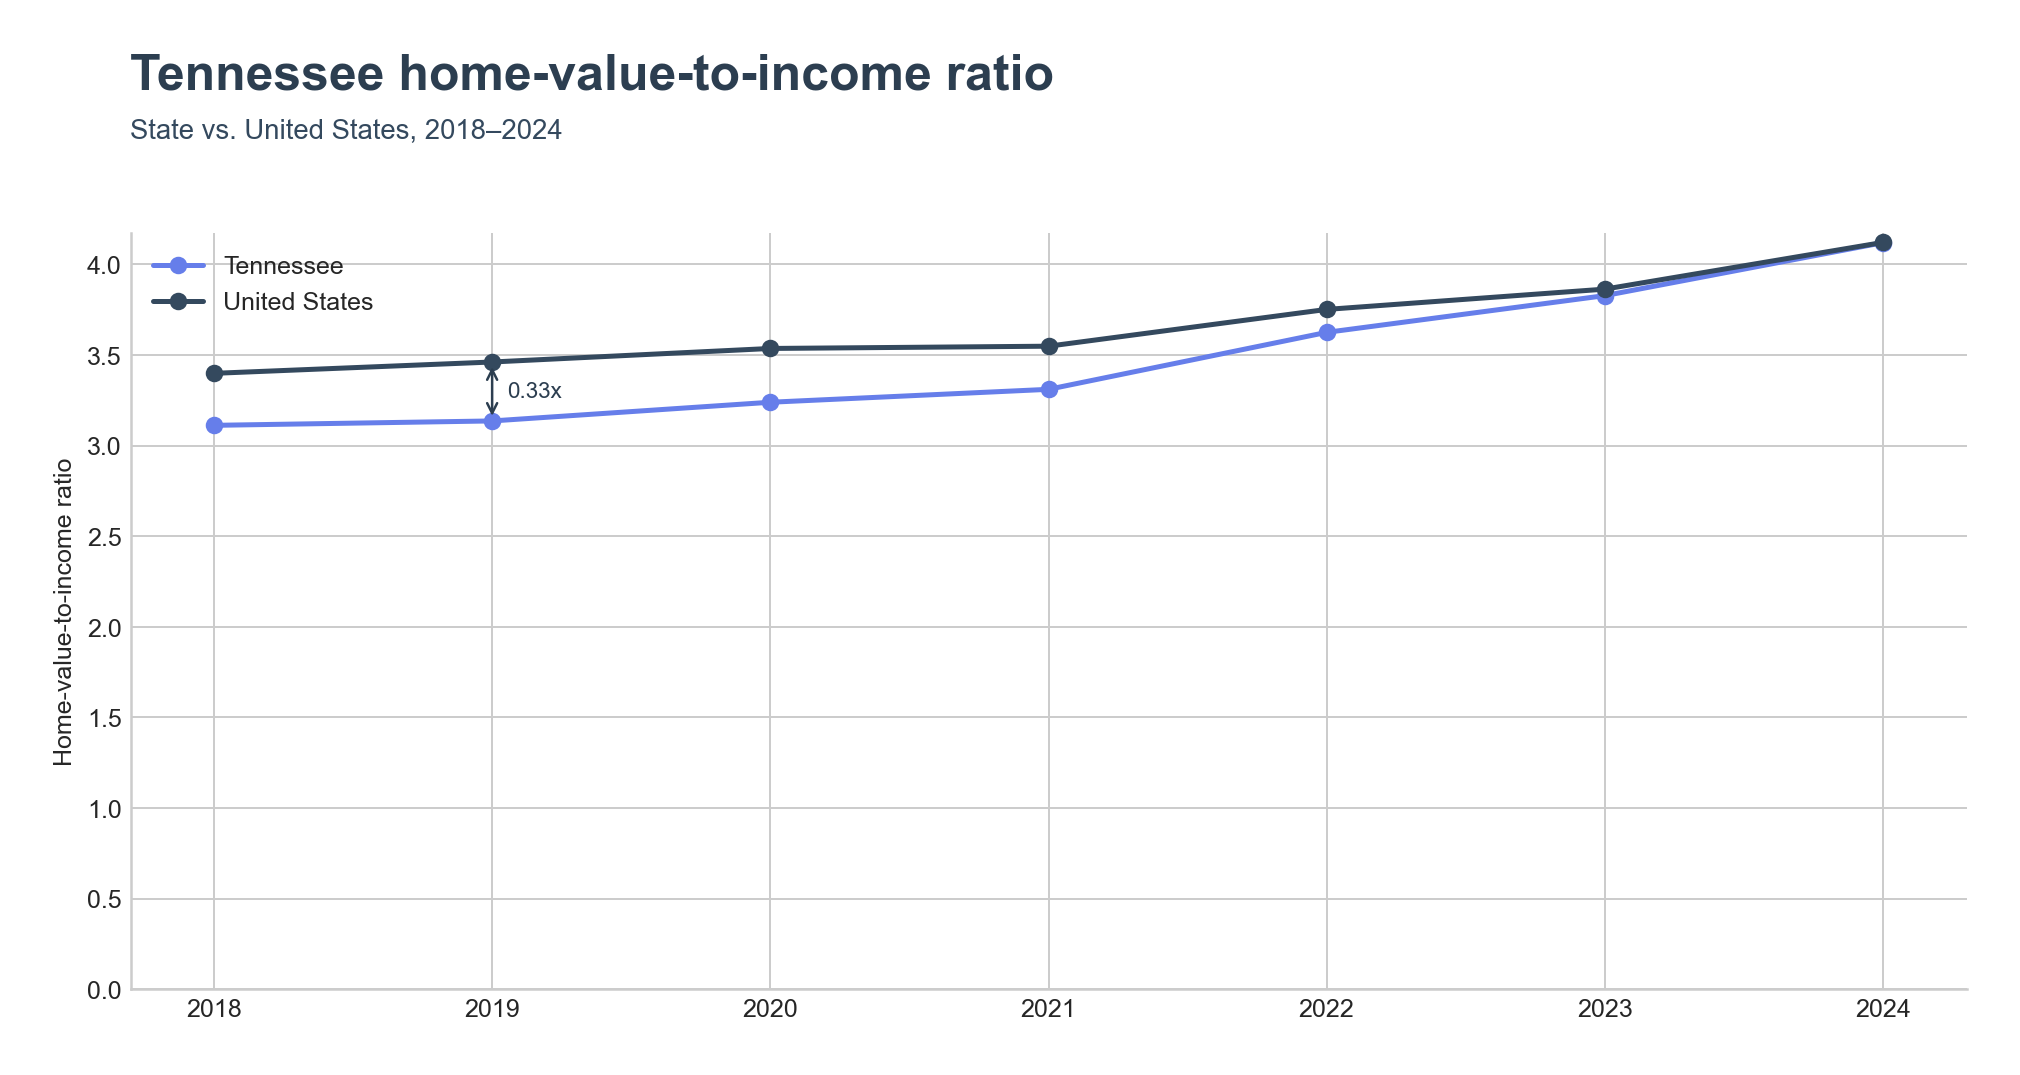
Tennessee's home-value-to-income ratio reached 4.12x in 2024, converging with the United States reference value of 4.12x. In 2018, Tennessee's ratio stood at 3.11x, well below the national 3.40x; the state has since closed that gap entirely.
Value outrunning income
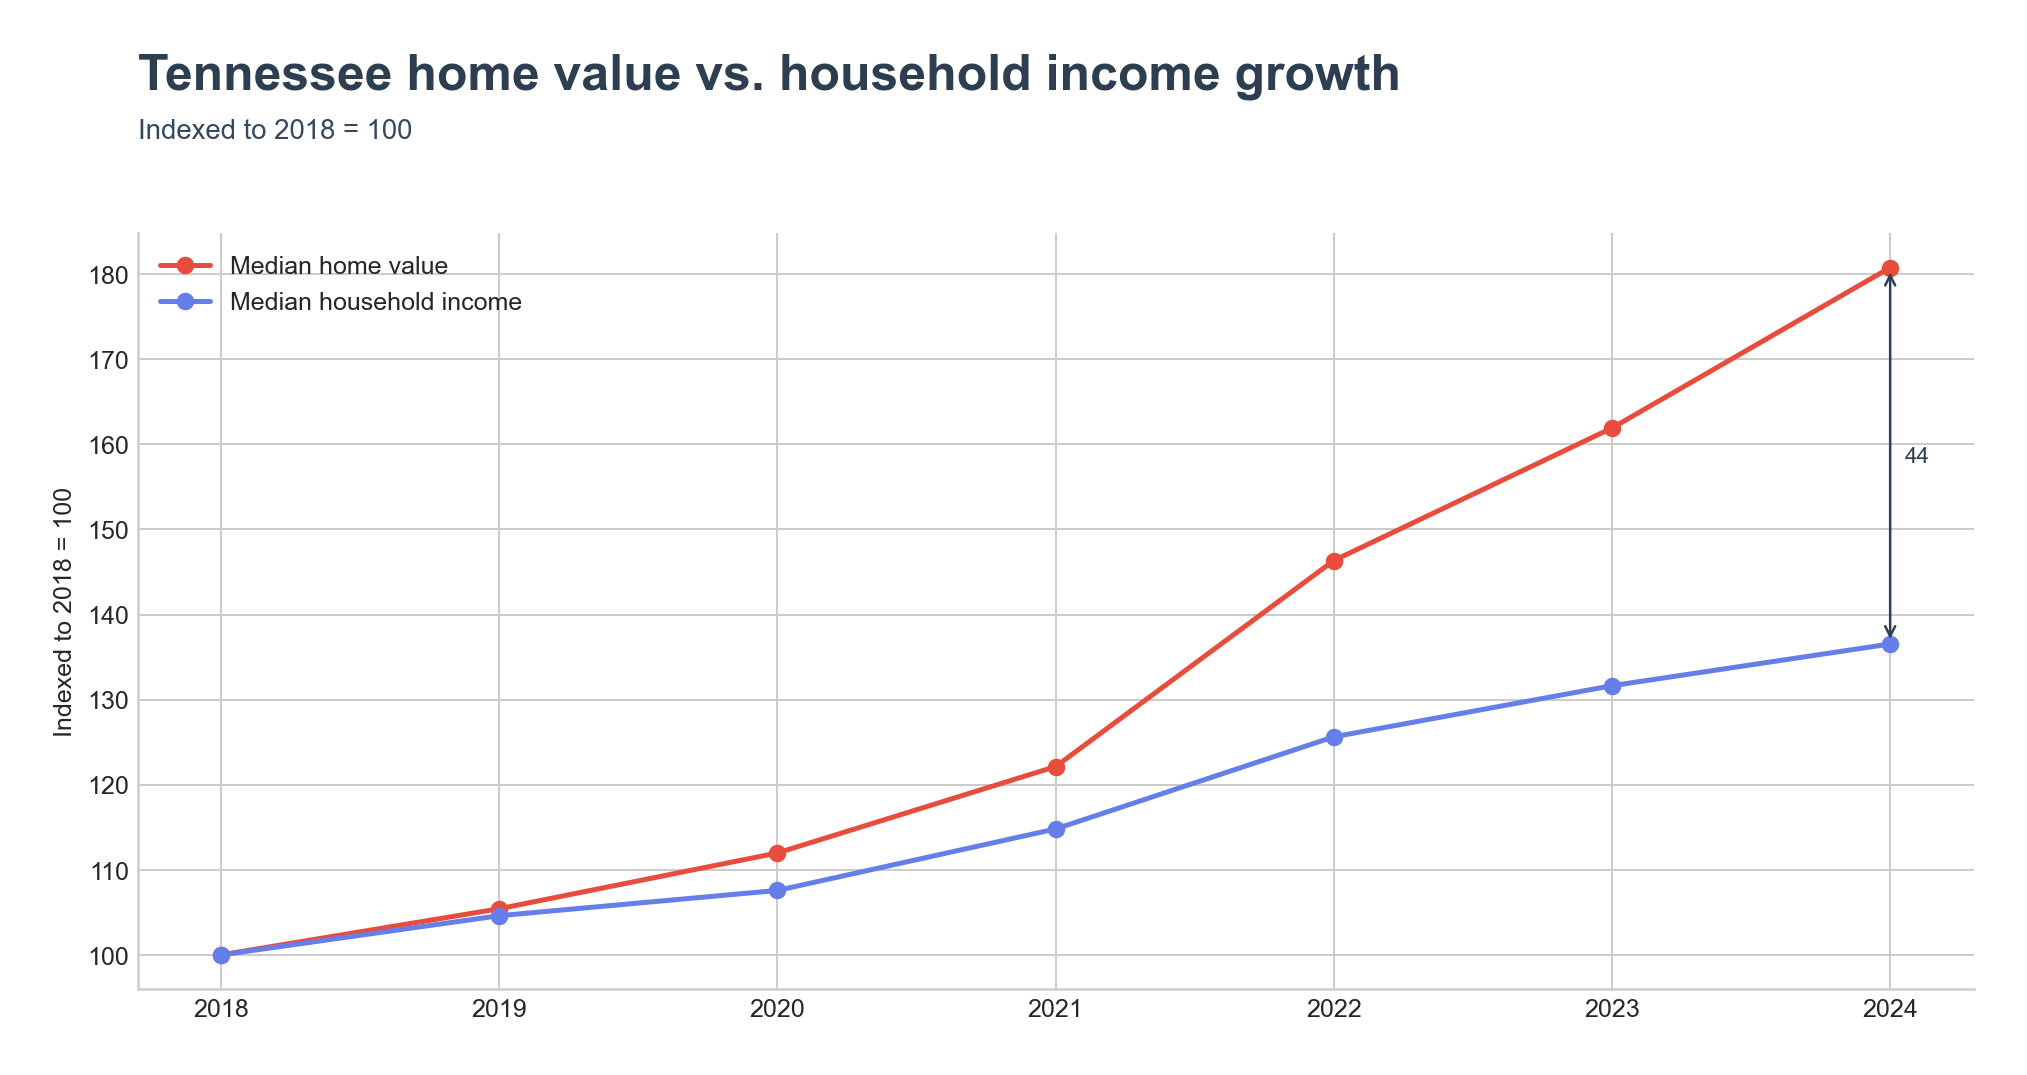
Tennessee's median home value went from $158,600 in 2018 to $286,700 in 2024, while median household income moved from $50,972 to $69,595 over the same period — home values growing much faster than incomes, as the indexed chart below shows.
Where the ratio runs highest
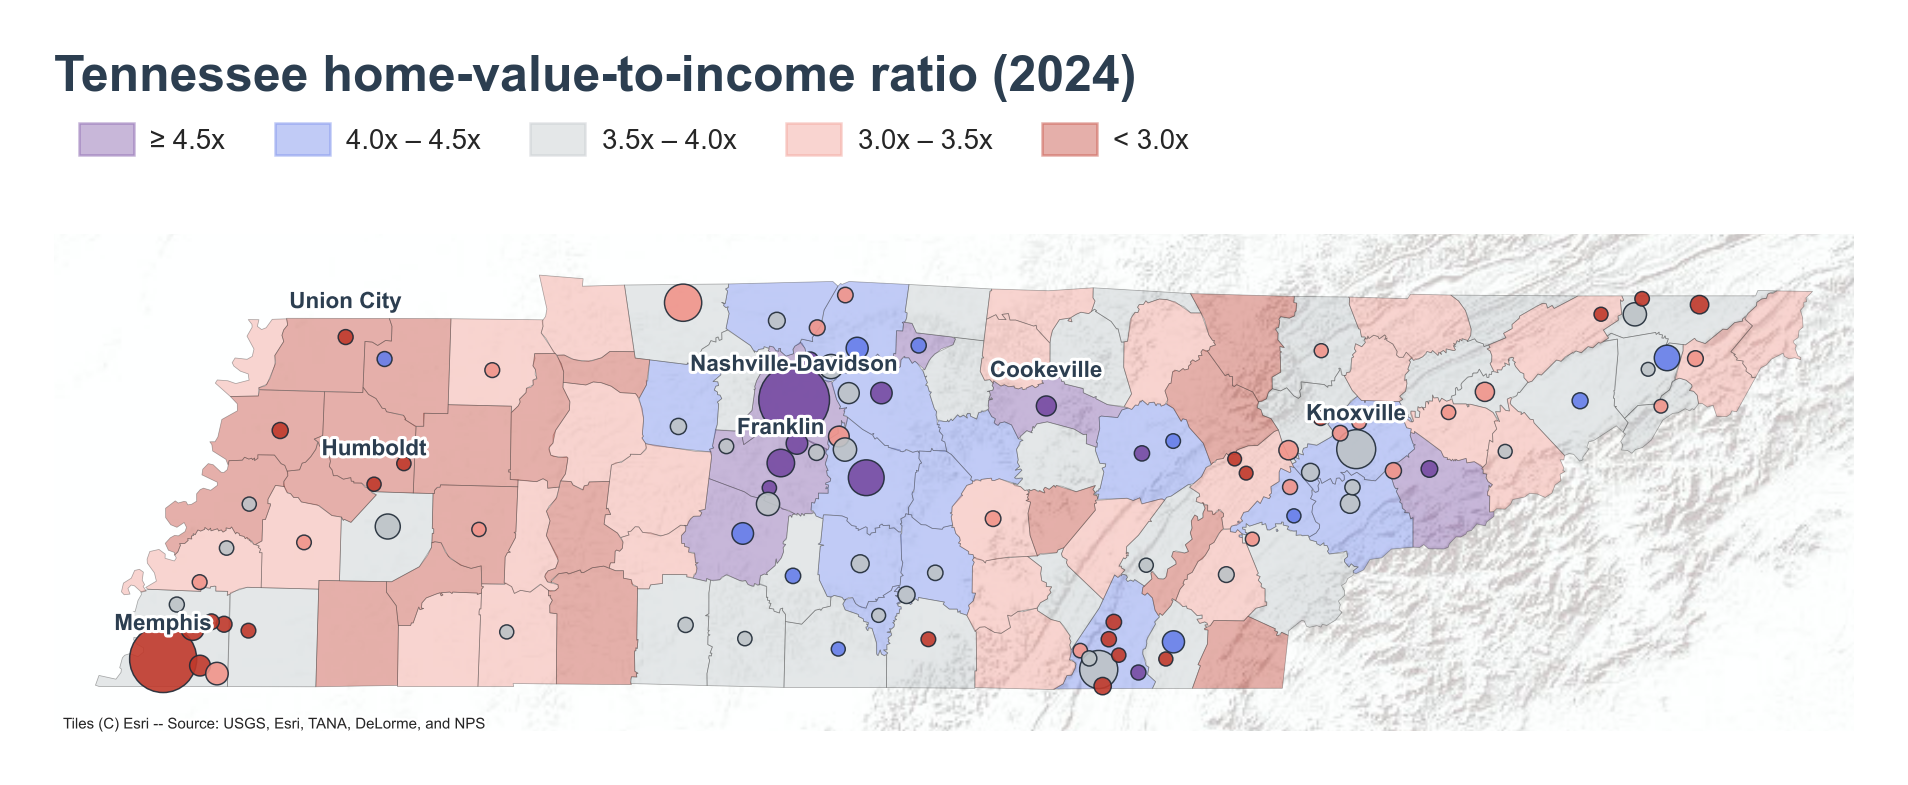
Cookeville posted the state's highest ratio at 5.94x, on a median home value of $305,400 against median household income of $51,375. Cookeville is a college town built around Tennessee Technological University , and its ratio is driven by a home value well above the state median paired with an income well below it. On the map, Cookeville sits as its own purple cluster east of Nashville-Davidson, in Putnam County, which also ranks among the state's top counties at 4.80x.
Three more of the top places — Franklin (5.90x), Brentwood (5.66x), and Goodlettsville (5.40x) — sit in the purple band immediately around Nashville-Davidson on the map. Franklin and Brentwood are both in Williamson County, the state's top-ranked county at 5.55x, seat of Franklin, Tennessee , a Nashville-area city that has drawn rapid growth as part of the Nashville metropolitan area. Unlike Cookeville, Franklin and Brentwood combine high home values ($705,400 and $1,031,300) with high incomes ($119,528 and $182,088) — their elevated ratios reflect Nashville-area price growth outrunning even well-above-average local pay.
Sevierville ranks fourth at 5.52x, with a home value of $289,600 against income of $52,421. Sevierville sits in Sevier County, itself the state's fourth-highest county at 4.78x, shown as a purple region on the map near Knoxville. Sevierville is one of the gateway towns to the Great Smoky Mountains National Park , a tourism-driven economy that has pushed local home values up faster than year-round local wages.
Nashville-Davidson itself (Davidson County) ranks second among counties at 5.36x, with a home value of $417,400 against income of $77,853.
Where the ratio runs lowest
Humboldt has the state's lowest ratio at 1.93x — a home value of $102,300 against income of $52,917. Union City follows at 2.87x, with a home value of $146,000 against income of $50,870. Both are labeled on the map in the state's northwest corner, in a red-shaded band well below the 3.0x line; both are historic railroad towns, according to Humboldt, Tennessee and Union City, Tennessee , where home values have stayed low relative to local income.
Bartlett (3.04x) and Germantown (3.14x) sit near the opposite end of the income scale from Humboldt and Union City. Both are Shelby County suburbs near Memphis, according to Germantown, Tennessee ; their low ratios come from high incomes ($102,070 and $149,920) rather than low home values ($310,400 and $470,800). Kingston (3.07x) and the counties Perry (2.27x), Obion (2.45x), Wayne (2.50x), Gibson (2.50x), and Morgan (2.52x) round out the bottom group with lower home values relative to income, spread across the rural, red-and-pink-shaded counties visible across the western and middle sections of the map.
A widening distribution
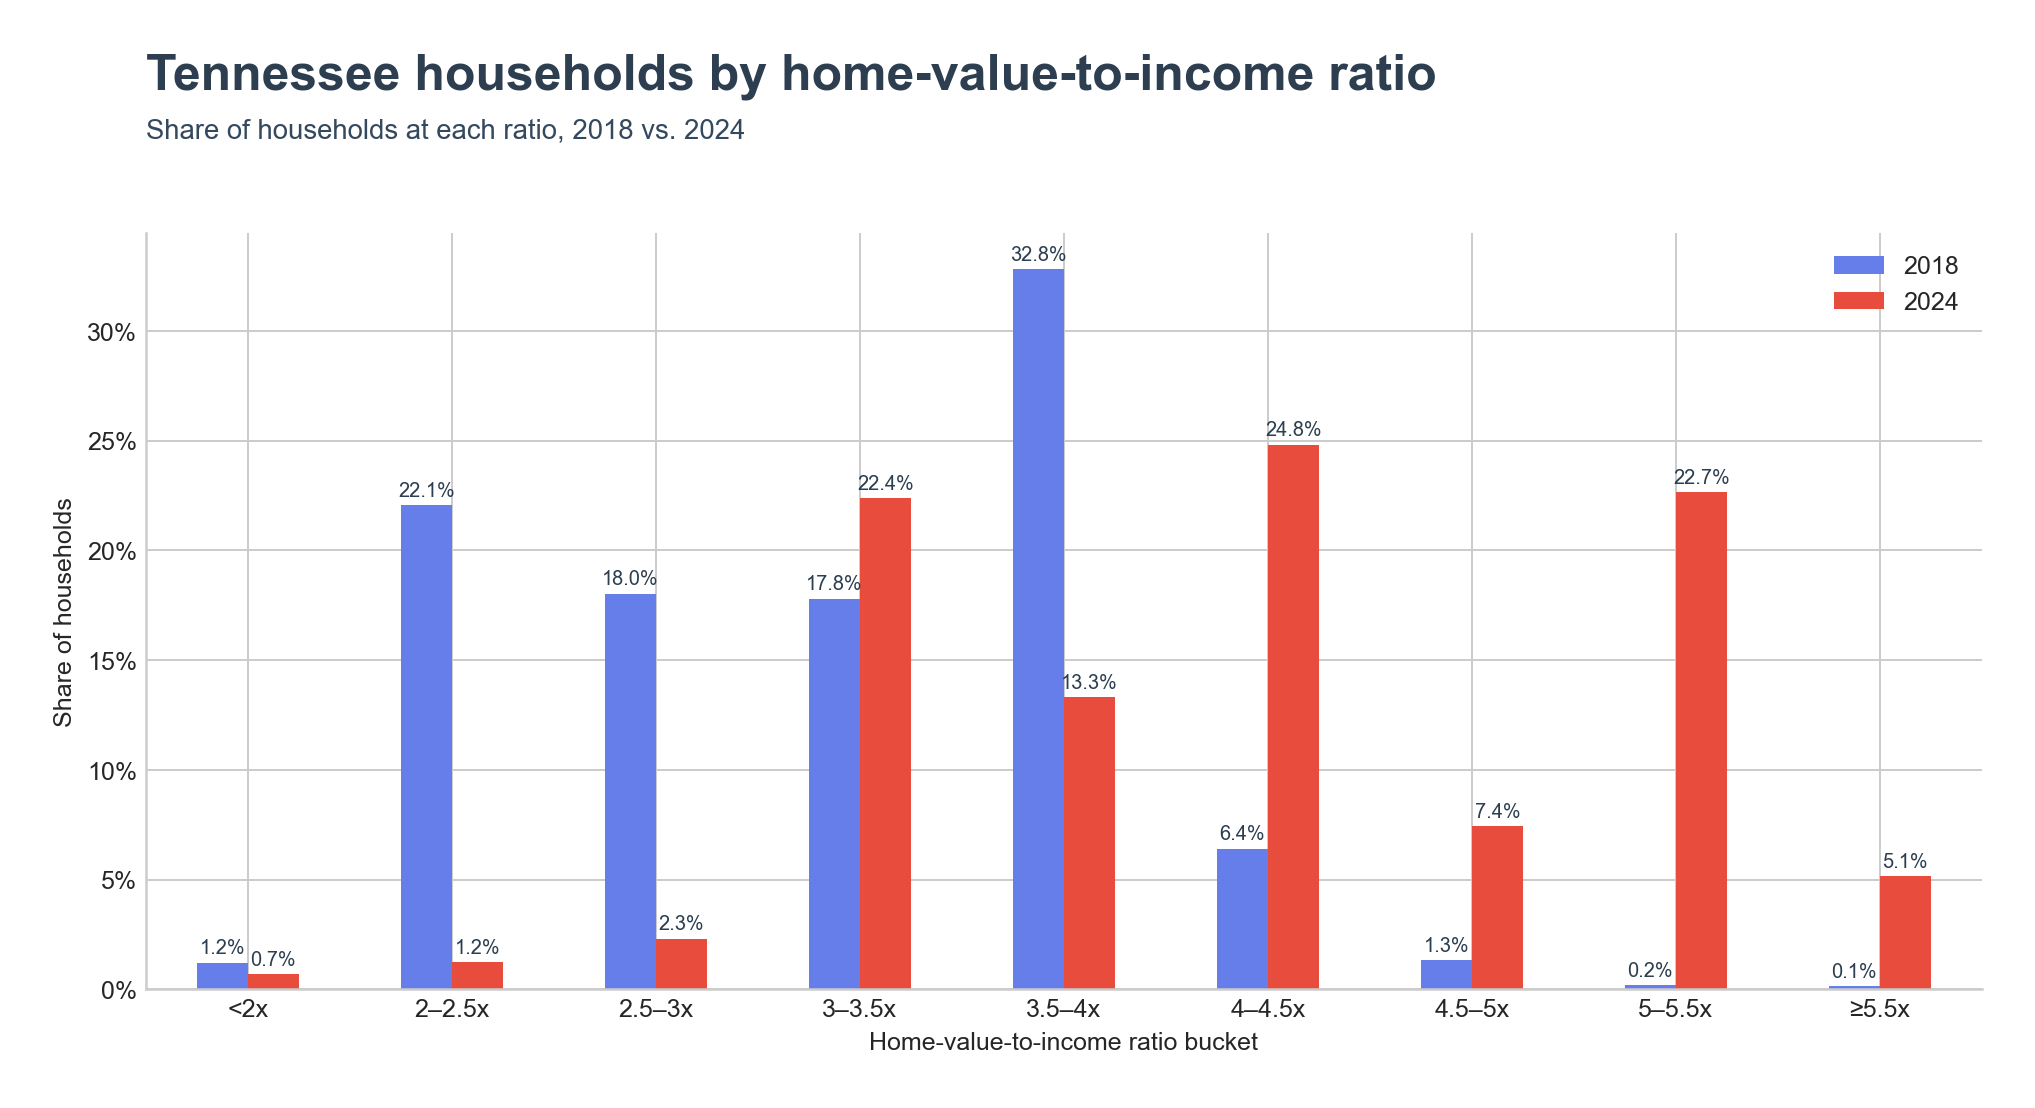
In 2018, 32.8% of Tennessee households lived in places with a ratio between 3.5x and 4x — the single largest band. By 2024, that band held only 13.3% of households. The 5–5.5x band grew from 0.2% to 22.7%, and the 4–4.5x band grew from 6.4% to 24.8%. The share of households in places under 2x fell from 1.2% to 0.7%.
Key Takeaways
- Tennessee's home-value-to-income ratio rose from 3.11x in 2018 to 4.12x in 2024, converging with the United States ratio of 4.12x.
- Tennessee's median home value went from $158,600 to $286,700 between 2018 and 2024, while median household income went from $50,972 to $69,595.
- Cookeville has the highest ratio in the state at 5.94x; Humboldt has the lowest at 1.93x.
- Williamson County (5.55x) and Davidson County (5.36x) are the top-ranked counties, both in the Nashville area.
- The 5–5.5x ratio band held 0.2% of Tennessee households in 2018 and 22.7% in 2024.