Connecticut's ratio, and how it compares to the nation
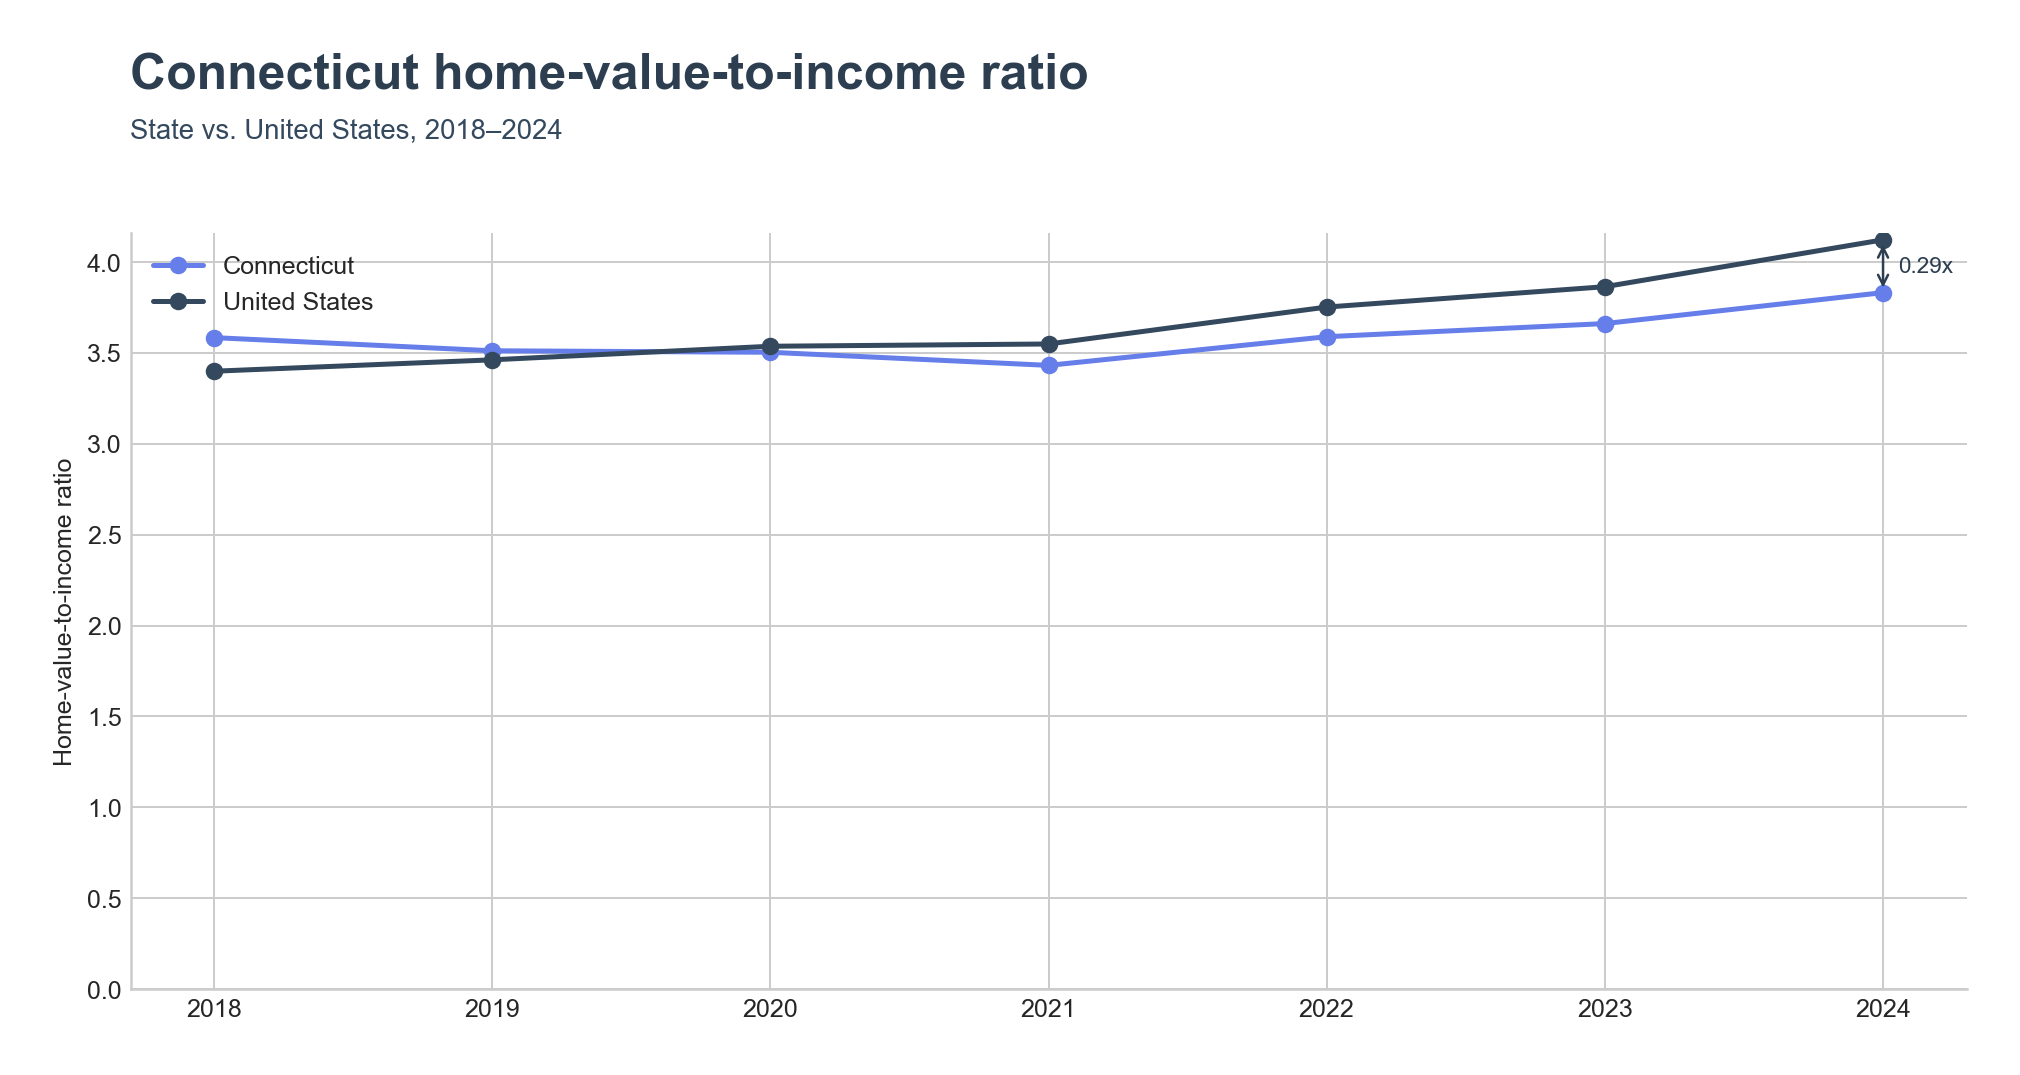
Connecticut's home-value-to-income ratio climbed from 3.58x in 2018 to 3.83x in 2024. In 2018, that put the state above the national figure of 3.40x. Growth has run faster nationally, though: by 2024 the United States ratio reached 4.12x, overtaking Connecticut's. A state that once ran hotter than the country now runs cooler.
The priciest corner of the southwest shoreline
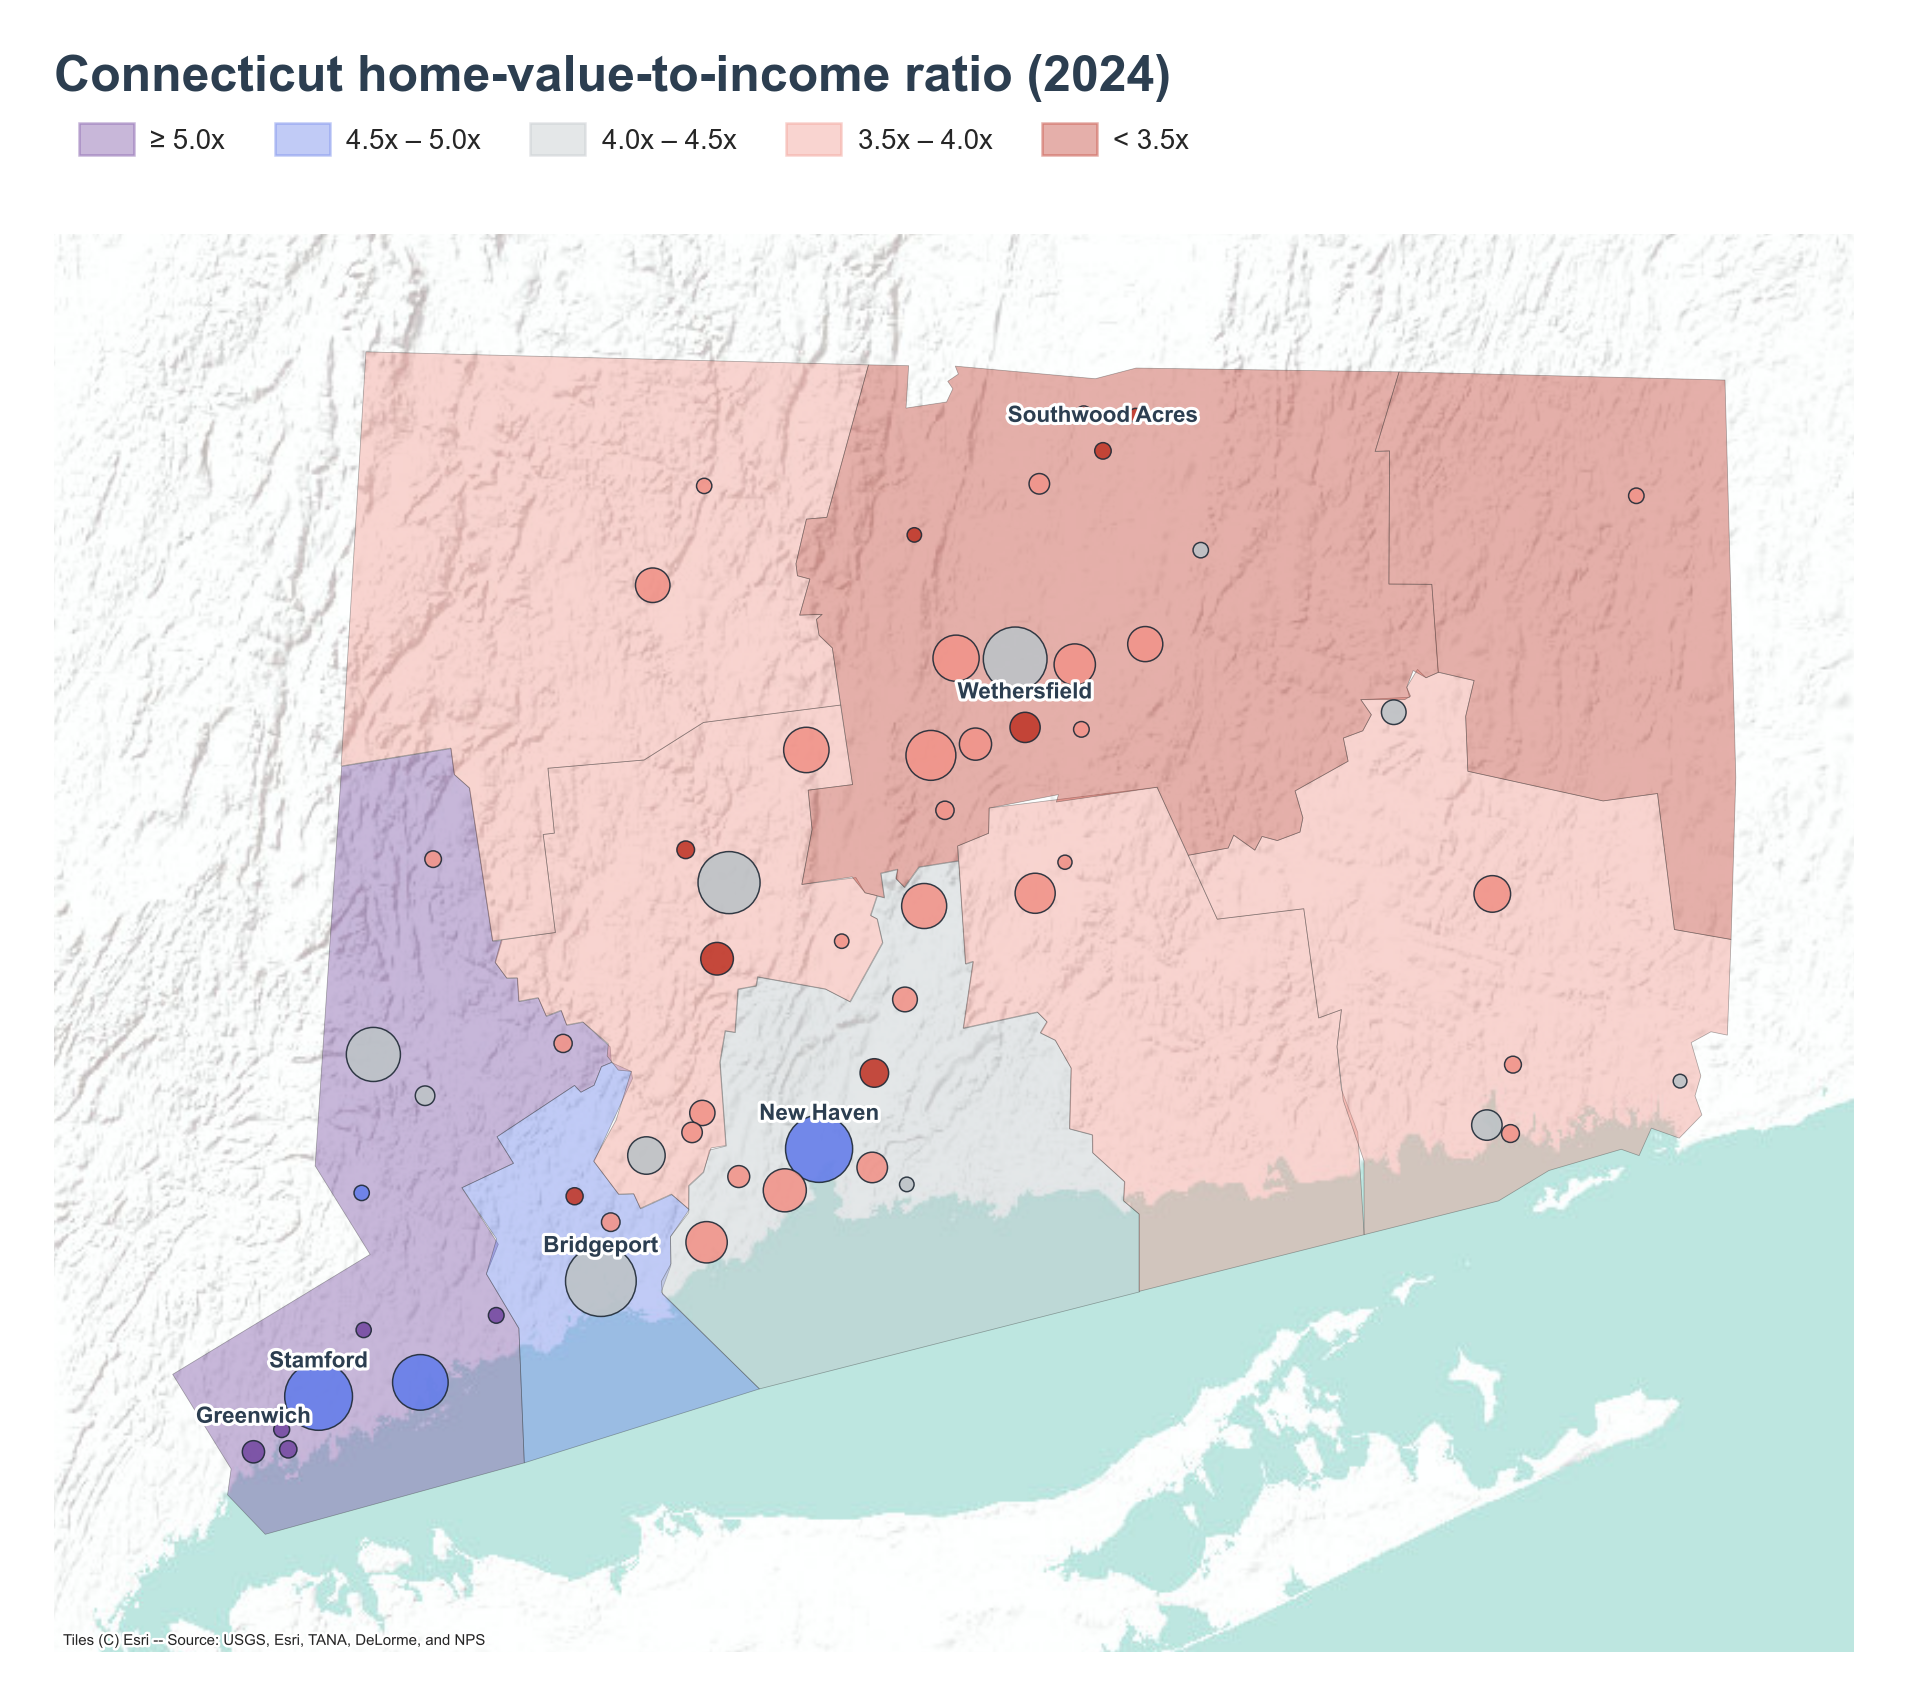
Greenwich posts the highest ratio in the state at 11.23x, with a median home value of $1,515,700 against a median household income of $134,914. Greenwich is home to a large hedge-fund and private-equity concentration, a legacy of its proximity to New York and decades as a base for finance-industry executives .
Close behind, Riverside sits at 7.60x on a median home value of $1,900,300 — the highest median home value of any highlighted place — against income of $250,001. New Canaan follows at 7.49x ($1,099,400 home value, $146,700 income), with Cos Cob at 6.35x and Staples at 6.05x rounding out the top five. All five sit within the Western Connecticut Planning Region, the state's most expensive planning region at 5.09x, well above Greater Bridgeport Planning Region's 4.78x for second place.
Where ratios run lowest
Southwood Acres has the lowest ratio among highlighted places at 2.43x, on a home value of $267,900 against income of $110,286. Wethersfield follows at 2.56x ($324,600 home value, $126,806 income), then Naugatuck at 2.69x, Long Hill at 2.73x, and Oakville at 2.94x. Wethersfield's historic center, one of the oldest continuously settled towns in the state , carries lower home values relative to income than the coastal southwest.
At the planning-region level, Northeastern Connecticut Planning Region has the lowest ratio at 3.40x, followed by Capitol Planning Region at 3.47x, Northwest Hills Planning Region at 3.59x, Lower Connecticut River Valley Planning Region at 3.64x, and Naugatuck Valley Planning Region at 3.69x. These regions span the state's interior and northern edge, away from the southwestern shoreline.
Home values are outpacing income
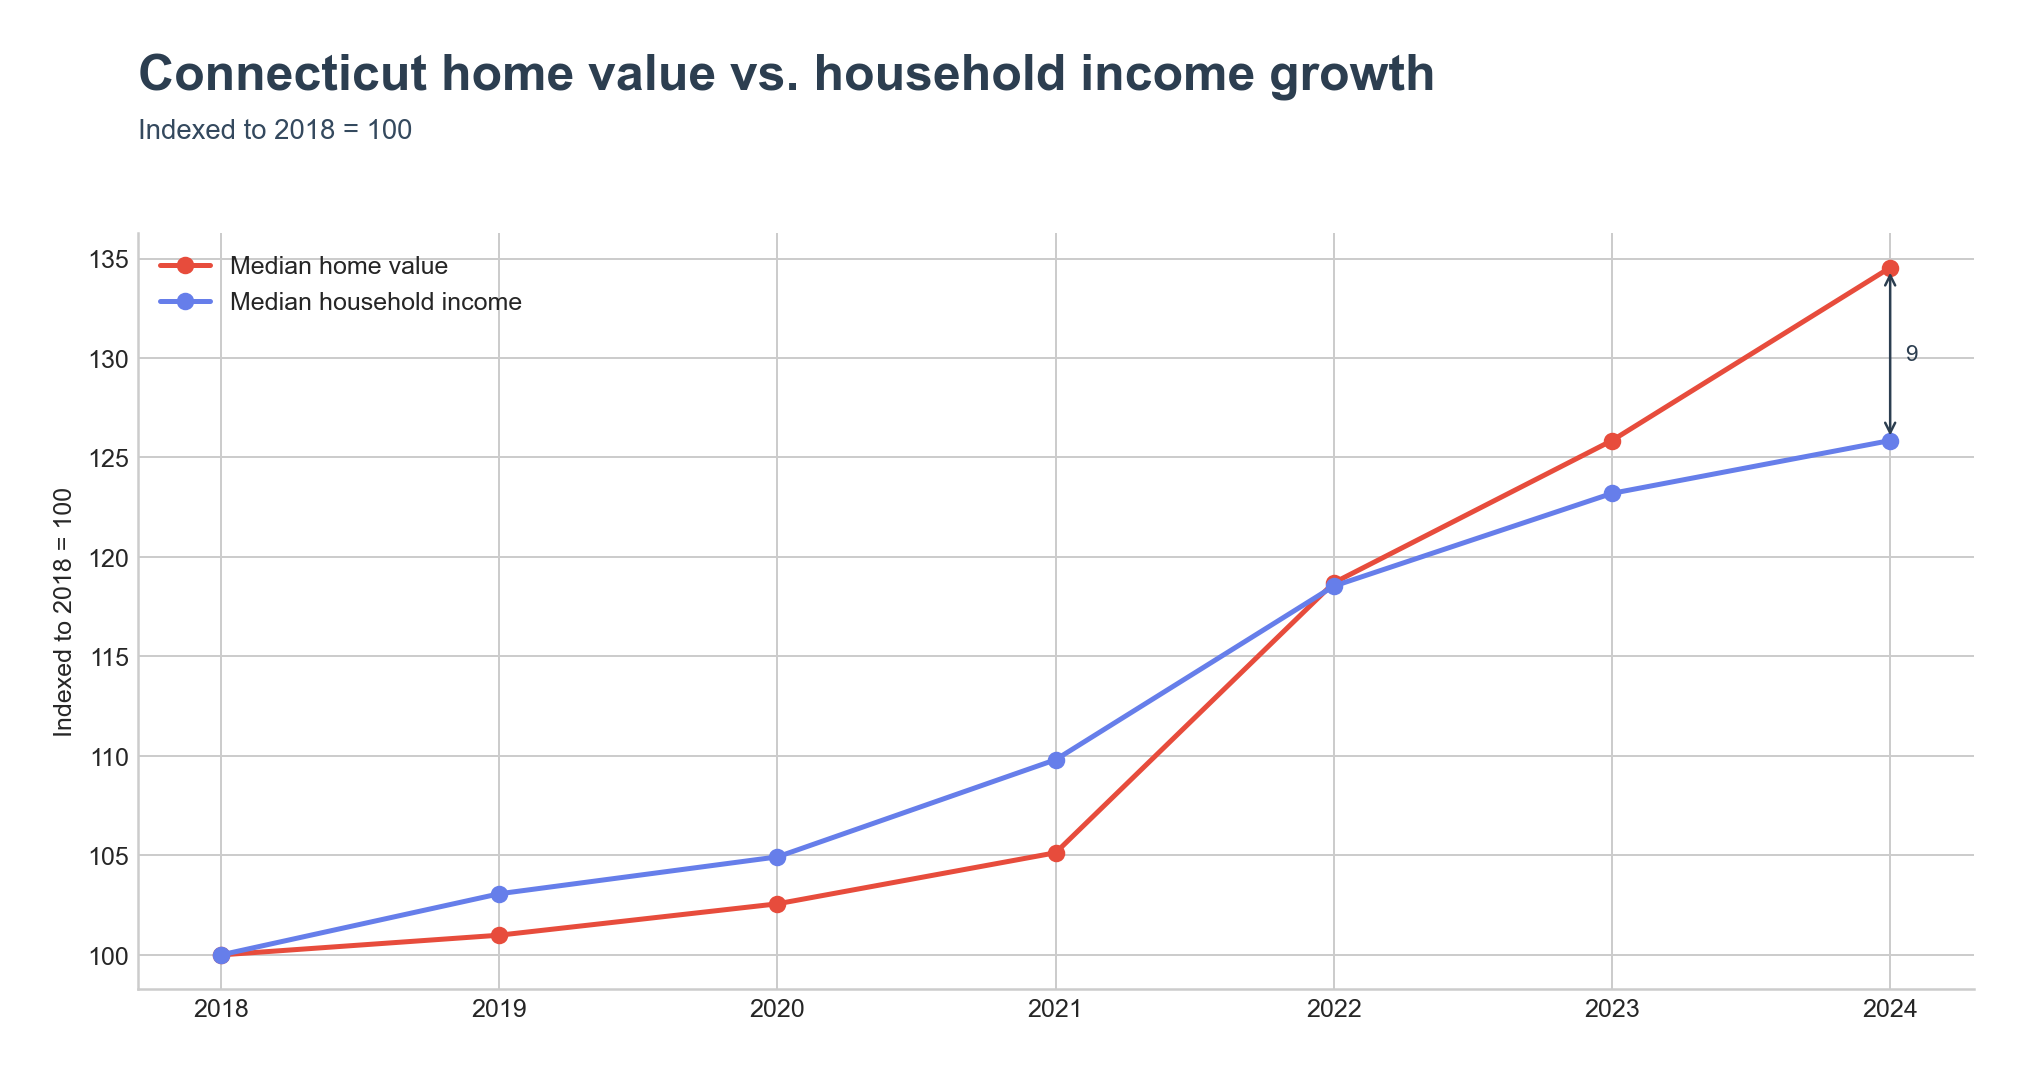
Indexed to 2018, Connecticut's median home value and median household income tracked closely through 2021, with income even ahead of home value for several years. Home value growth accelerated after 2021 and has since overtaken income growth, driving the state's rising ratio.
The distribution is shifting toward higher ratios
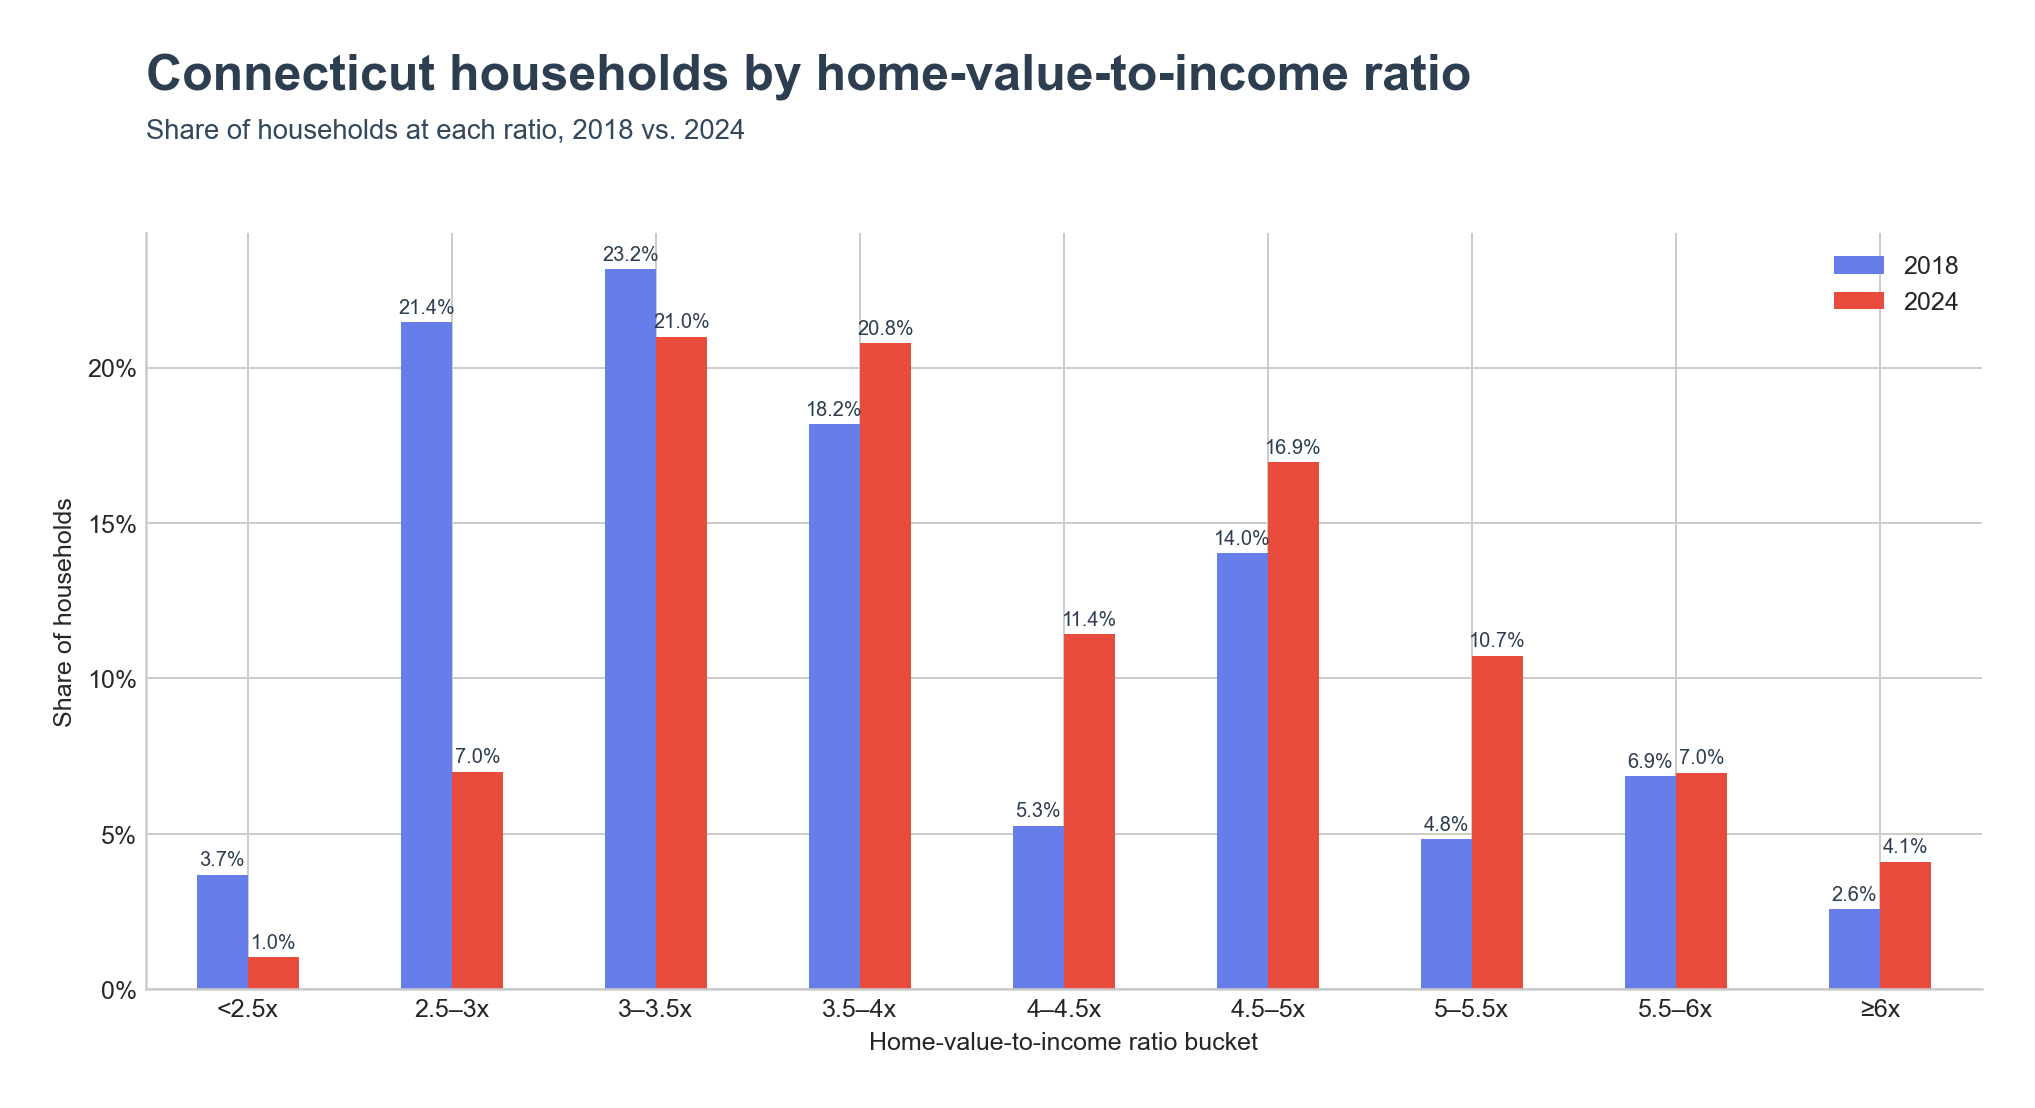
In 2018, 23.2% of Connecticut households lived in places with a ratio between 3x and 3.5x, and 21.4% lived in places between 2.5x and 3x. By 2024, those shares fell to 21.0% and 7.0% respectively, while every bucket from 4x to 5.5x grew — the 4.5x–5x bucket rose from 14.0% to 16.9%, and the 5x–5.5x bucket more than doubled from 4.8% to 10.7%. Fewer Connecticut households now sit in the most affordable buckets, and more sit in the higher ones.
Key Takeaways
- Connecticut's home-value-to-income ratio rose from 3.58x in 2018 to 3.83x in 2024, but the national ratio grew faster, reaching 4.12x in 2024 and overtaking the state's.
- Greenwich has the highest ratio among highlighted places at 11.23x, followed by Riverside at 7.60x and New Canaan at 7.49x, all within the Western Connecticut Planning Region.
- Southwood Acres has the lowest ratio among highlighted places at 2.43x, followed by Wethersfield at 2.56x.
- The Western Connecticut Planning Region has the state's highest planning-region ratio at 5.09x; the Northeastern Connecticut Planning Region has the lowest at 3.40x.
- The share of Connecticut households in places with a ratio of 4x or higher grew substantially between 2018 and 2024, while the share below 3x shrank.